
This post originally appeared on the Marketing section of Inbound Hub. To read more content like this, subscribe to Marketing
In many aspects of life, timing is key. If you've got to schedule a very important meeting, and all of the attendees aren't morning people, scheduling an 8 a.m. start time probably won't result in a productive meeting. Or maybe you want to book a cheap vacation -- you probably want to avoid scheduling one during the holidays.
The same is true with content creation and social media. If you want your content to do well on social media, you've got to be strategic about what you publish and when you publish it. To figure out how and when to publish content to have a big social media splash, Fractl recently partnered with BuzzStream to analyze 220,000 articles from 11 verticals published during June 2014 to November 2014. Check out our findings below.
What types of content get shared?
Great ideas lead to great content, and our research proves that how you choose to execute that content will affect its social traction. We divided the content of articles into five types: how-tos, lists, what-posts, why-posts, and videos. Here's how we defined each post type:
- How-to posts introduce a problem, offer a solution, and then discuss each step to reach the desired result.
- Lists are exactly what they sound like -- they focus on a particular topic, offer a number of points about the topic, and provide a brief conclusion.
- What-posts provide further information on a specific topic, with many articles surrounding comparisons of one thing to another.
- Why-posts typically provide readers with a reason or purpose and provide details that support a focused conclusion.
- Videos are also self-explanatory, providing the audience with a dynamic visual of the topic discussed within the article.
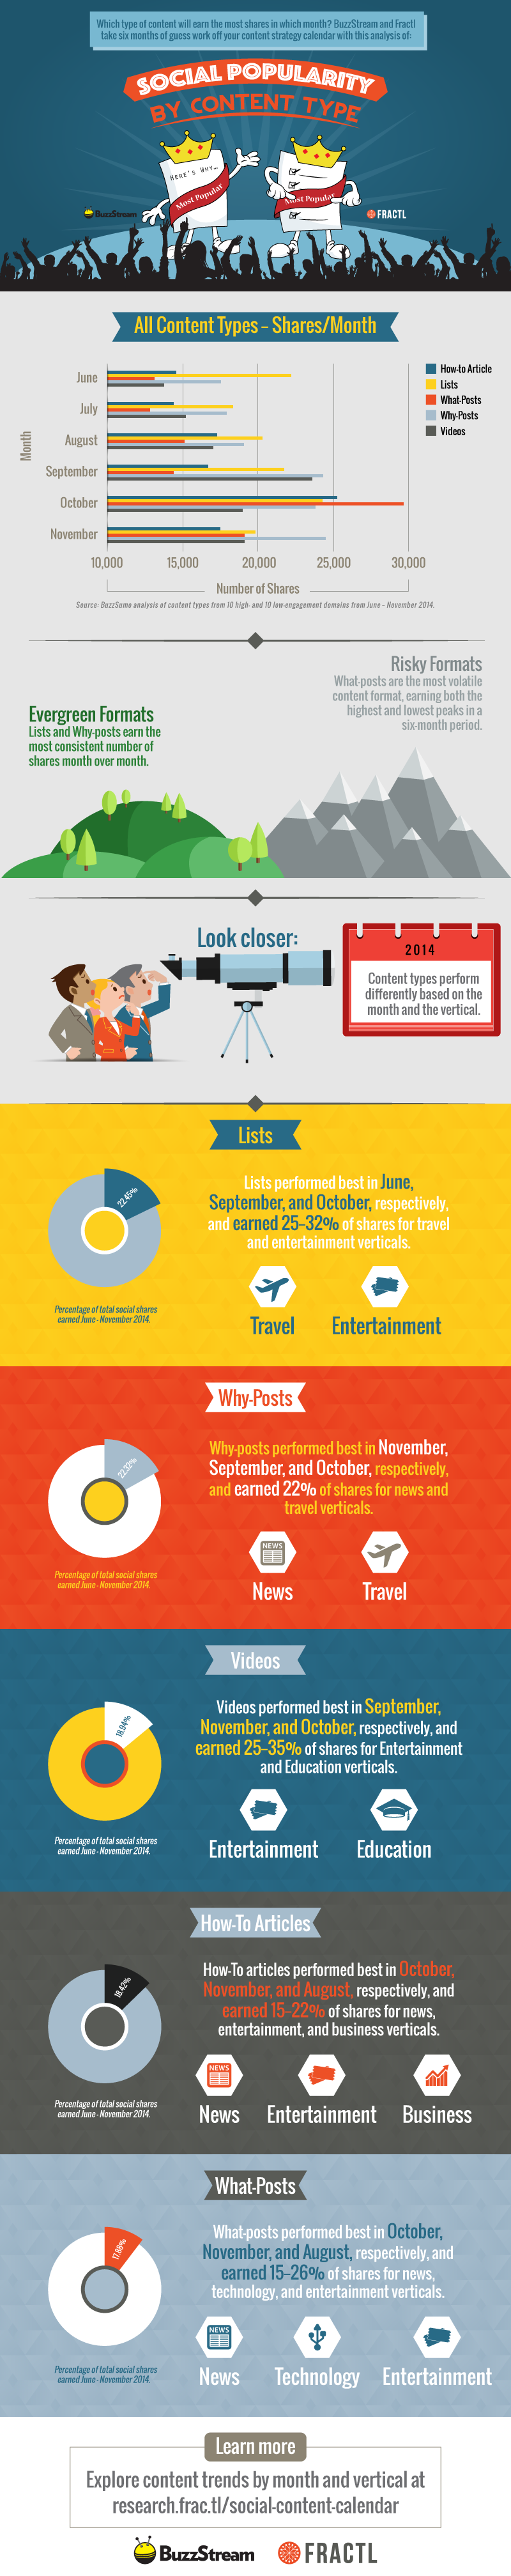
Across the six-month period of this analysis, we found that some post types did perform better than others. Lists and why-posts proved to have the most reliable social traction, averaging around 21,000 shares per month with a variance of less than 2.5%. What-posts were the riskiest format, showing a high variance of 13.45%. Further analysis of the six-month period revealed:
- Lists narrowly claimed the most social traction at 22.45%
- Why-posts earned 22.32% of social traction.
- Videos drew 18.94% of total shares and performed well in Q4.
- How-to articles earned 18.42% of shares.
- What-posts had the lowest social traction, earning 17.88% of total shares.
What types of content perform best for different industries?
The social metrics of content type also varied by vertical, proving that each audience has different preferences and behaviors.
For example, lists proved the best content type for the travel vertical, claiming 32% of shares. The list format corresponded with what people do when planning for a trip: Write down where they want to go, what they need to pack, and other details.
But lists didn't do as well in the education vertical, where this post type claimed only 10% of shares. Other interesting insights we found were:
- Technology social shares increased during the end of the year, when its audience searched online for the latest gadgets to complete their holiday shopping.
- July is the lowest-performing month for the education vertical, claiming only 10.57% of total shares, as school is closed for the summer and people’s minds are on other matters.
- How-to articles were the most consistent performers within the automotive audience, corresponding with the highly practical and technical nature of the subject matter.
- How-to posts also performed best in the food vertical, comprising of 37% of the social shares, most likely because people tend to enjoy posts on recipes.
We also decided to dive deeper into the 11 verticals and identify the top 20 websites in each. Filtering these results by content type and date, we saw that although the average number of social shares per vertical did not vary wildly -- usually less than 10% each month -- some verticals performed better than others. The news vertical saw the most social traction, averaging more than 28,000 shares each month. Its high performance is likely because it has the broadest topic range of the different verticals. The second highest-performing vertical, entertainment, averaged more than 17,000 shares a month, while travel rounded out the top three with an average of more than 10,000 shares. Other findings included:
- Lifestyle, tech, finance, business, and education averaged between 5,000 and 9,000 shares -- nearly three times less than the news vertical.
- Business was the only vertical to have a single-digit variance for all content types, emphasizing that its readers have a consistent sharing habit.
- Automotive, health, and food averaged between 2,000 and 5,000 shares, food being the lowest-performing vertical with fewer than 2,500 social shares a month.
- News was the only vertical that saw specific content types pass 5,000 shares.
When's the best season for shareable content?
With more than 128,000 shares, October emerged as the month with the highest social traction for each of the different content types. Further analysis found:
- Why-posts did well in September and November.
- Videos performed well in Q4.
- How-to posts took off in August and November.
- What-posts earned the most shares out of all content types in October.
- Videos did best in September with more than 24,000 shares.
But that doesn’t mean you should saturate publishing come fall. A closer look at the data determined that different verticals perform better at different times throughout the year:
- News was the only vertical to see three content types reach more than 2,500 shares each in June.
- None of the five content types reached 6,000 shares in any vertical during July and August.
- Business, health, tech, and food did not have any standout content type that earned more than 2,000 social shares in September.
- Automotive earned most of its shares in July, specifically with what-posts exceeding 3,000 social shares.
- Social traction in the business vertical remained consistent for five months, between 8,000 and 9,000 shares, before dropping in November.
- Lifestyle saw its highest monthly shares in September, with what-posts performing the best on social.
- Finance also saw its highest monthly shares in September, with list posts providing the highest social traction.
The biggest takeaway from our research? Timing and relevancy key, especially if you want to hit that ever-desired mark of “going viral.”
If you want to dive further into our findings, please check out the infographic below. If you want to put these findings to use, check out our free social content calendar.

![Should You Publish More Content to Increase Social Sharing? [New Research]](https://blog.hubspot.com/hubfs/00-Blog_Thinkstock_Images/publish-content-social.png)