.png?width=112&height=112&name=Sales%20Conversion%20and%20Close%20Rate%20Calculator%2001-300%20(1).png)

In this post, we'll break down the most important metrics for eight common roles: email marketing managers, blog managers, sales enablement managers, social media managers, product marketing managers, conversion/optimization managers, campaign managers, and sales managers.
(HubSpot customers: You can track and report on many of these metrics yourself using HubSpot's Reporting Add-on.)
Read through this post to gain a better understanding of not only your own role, but the roles of the other folks on your team, too. (And if you're interested in learning more, here's a guide that'll walk you through when marketers should check on various marketing metrics like these ones.)
Let's get started.
1) Email Marketing Manager
The email marketing manager is in charge of sending out regular email communication for any marketing campaign.
Open Rate
Open rate is calculated by taking the number of times an email was opened, and dividing that by the number of times that same email was delivered.
While open rate is sometimes said to be misleading, the metric is still an important one to measure. Why? It influences the number of clicks you have in your emails. If you're optimizing your email for clicks, but the open rate is low, you will still have fewer conversions. If your open rate increases, your clickthrough rate is more likely to increase.
Clickthrough Rate
Clickthrough rate (CTR) is calculated by taking the number of clicks per email, and dividing it by the number of emails that were delivered. Your CTR will show you not just how many people received your email, but how many people are taking the next step and interacting with it.
Unsubscribe Rate
Your unsubscribe rate is calculated by taking the number of people who unsubscribed from your email and dividing that by the number of people who received the email. It'll give you an indication of whether your content is being well received, or whether it's been turning people off.
"Correlating unsubscribes to content is stronger than correlation between clicks and content, as there are many variables at play such as CTA positioning and how strong the copy was," says Niti Shah, HubSpot's inbound marketing manager for APAC. "But unsubscribes are most often the result of people thinking, 'This content is just of no use to me.' This can help marketers uncover patterns in what works for a segment and what doesn't, which can inform everything from future content creation to what other channels promote."
2) Blog Manager
A blog manager is responsible for sustaining and developing the company's voice across all blog content. They usually write and edit blog posts, provide feedback to contributors, optimize content for SEO and lead generation, contribute to long-form content projects, conduct analytical projects, and grow blog subscribers.
Visits
The number of visits refers to the number of people who reach your website from a referring source outside your website domain. (Here's a guide to website traffic terms.) Before you can start analyzing the quality of your blog's content and how often it converts into leads or customers, you need to make sure you have enough traffic coming to your website. Your blog plays a key part in your top of the funnel as it is often the first step to get someone to your website.
"Visits isn't just a vanity metric. Coupled with your lead data, it's a crucial piece of information to decode what's happening in your funnel," says Ginny Soskey, Editor of HubSpot's Marketing Blog. "If you're not getting enough traffic to a given post or page on your website, you're going to have problems down the funnel. Identifying and diagnosing traffic problems early on will make sure you have enough lead flow coming in down the road."
Leads
Once you have a healthy amount of traffic coming to your website, you'll want to track many leads your blog content generates. Ultimately, the purpose of having your blog is to convert your traffic into leads.
First, work on getting a baseline for the raw number of leads generated from your blog. Then, you can start digging in a bit more to analyze the type of content that's generating those leads. This will help you figure out what topics and formats of blog posts you should focus on, as well as where you should include calls-to-action in your post. (Check out this blog post for ideas on how to run your blog lead generation analysis.)
Subscribers
Subscribers are often a forgotten metric when it comes to your blog content, but they're incredibly important. In fact, one of the keys to increasing blog traffic is increasing blog subscribers. The more subscribers you have, the more eyes you'll have on your content. The more eyes you have on your content, the more leads you are able to generate as a result of your blog content.
While subscribers are always an important metric to focus on, it's even more important when you're just starting your blog. Building a regular audience for your blog content as early as possible will impact how often your blog post is shared on other channels and your lead flow.
3) Sales Enablement Manager
A sales enablement manager's responsibilities will vary depending on the company. Usually, their responsible for working with the sales team to make sure they're prepared for their calls through content, campaigns, and competitive intelligence.
Lead-to-Customer Conversion Rate
The lead-to-customer conversion rate will show the percentage of leads who turned into customers. Even though there may be other factors that influence this metric (such as lead quality), it'll give you a good idea of how many of your leads sales are converting into customers. It can also be a good indication if your sales team needs more leads, more high quality leads, or more content to help close the current leads you are generating.
"This metric is also important to keep in mind when deciding which projects to take on yourself and which to leave to other marketers," says Debbie Farese, a senior marketing manager at HubSpot. "Always ask yourself, 'Will running this campaign or creating this piece of content help us close more customers?' If you only take on projects where the answer is 'yes,' then you will stay focused on bottom-of-the-funnel activities and have a clear reason why you leave demand generation efforts up to your colleagues."
Opportunity-to-Customer Conversion Rate
Opportunity-to-customer conversion rate is similar to the lead-to-customer conversion rate, but it looks at a smaller piece of the funnel. Sales enablement managers need to look at this metric not only in aggregate of the entire sales team, but also at a per-rep level. This will show you out of all the opportunities your sales team is creating, and how many actually turn into customers.
This can help indicate whether additional content or resources need to be created in order to turn opportunities into customers. Looking at this information at an individual sales rep level can also be useful as you gather data about what content might be needed to close more deals.
Content Driving Conversions
Sales should be given a lot of content to work with: case studies, blog posts, competitive intelligence reports, landing pages, and so on. But it's important to frequently evaluate the effectiveness of these resources so you can figure out what content should be updated or created in the future.
By using attribution reports, you can find out which sales enablement content is actually driving conversions. This will help you prioritize what content needs to be created, versus what would just be nice to create.
4) Social Media Manager
A social media manager's job is to build and manage a company’s social media profiles and presence, create shareable content, and drive consistent, relevant traffic and leads from social media networks.
Reach
Social media reach is the potential number of people you can reach with any social message at any given time. In other words, it's the number of people who follow you on different social media platforms -- including people who follow you on Twitter, Like your Facebook Page, and follow you on LinkedIn. As you increase this number, you are able to regularly communicate with more people about any of the marketing campaigns you run.
Leads
Your social media leads are people who have interacted with your content on a social media platform -- like clicking a link -- and then converted on a page on your website. It'll give you an indication of which types of content your followers are interested in on social media. You may find that certain content performs much better when posted on social media than other channels.
Engagement
Engagement shows the number of people who are actually interacting with your social media content. While your follower numbers are important because you need a group of people you know you could potentially reach, your engagement metrics will show you who is actually interacting and clicking on your posts.
"Measuring each of these metrics helps us determine the health of the funnel to figure out where we need to optimize," says Chelsea Hunersen, HubSpot's Community Manager. "Specifically measuring engagement helps us measure the health of our audience to make sure we are providing the right content."
5) Product Marketing Manager
A product marketing manager is a company's chief advocate for a specific feature set and its benefits, and they're in charge of crafting the strategy around the messaging and marketing for new launches. At some companies, the role of the product marketing manager and sales enablement manager is the same; at other companies, the role of the product marketing manager and product manager is the same. It'll vary depending on your company.
Adoption Rates
One of the product marketing manager's main responsibilities is to drive usage of different features within your product. In many cases, that may be helping to identify what may prevent someone from using a feature within the product.
The first step to figuring out your adoption rate is identifying the activation -- or what action someone must take -- to be considered an actual user of the product. For example, for someone to be considered a user of HubSpot's blogging tool, we have to determine whether creating a new blog post or publishing a blog post is considered someone "using the tool."
Once you've settled on the activation, then you can then start to analyze the percentage of customers who use a certain feature within the product. It's important to track how that metric increases or decreases based on the marketing activities you run over time. If your adoption gets too low, you may need to assess whether or not you should even have that feature in your product.
Conversion Rates
Once you track your adoption rates, it is also important to track your conversion rates within the product -- or even from outside of the product.
What does this mean? While the funnel you're typically used to talking about has visits converting into leads converting into customers, the funnel I'll talk about here is completely different. This funnel looks at the content or collateral we produce, and how that translates into actual use within the product.
For example, let's say we're trying to drive usage of a social media app. If I create content that explains how to post a tweet and use a call-to-action with a link to the social media app within the product, I want to track the conversion rate of someone reading my post and then using the app. This information can help me determine what type of content I should be producing as well as which campaigns I should be running.
Revenue
As you figure which parts of the product you want you and your team to focus on, think about which parts of the product drive revenue for your company. Is there a certain feature set within the product that your customers would need to upgrade to access? Is there a certain feature set within the product that you know will make someone stickier?
Once you've identified these features, run campaigns with the ultimate goal of generating revenue for your company. For this funnel, track how your content impacts usage and how that usage affects revenue. This metric is powerful because it can really shed light on how your work affects the bottom line.
6) Conversion/Optimization Manager
This person's title can vary a lot: conversion manager, optimization manager, SEO manager, and so on. Their role is to optimize landing pages, emails, blog posts, and webpages to drive more conversions.
Traffic from Organic Search
While some marketers are looking at traffic from all sources, conversion managers need to zero in on traffic from organic search. This will allow you to specifically measure the overall success of their SEO efforts. Part of this role involves trying to optimize pages on the company's website for different keywords. Once you do this, you'll then want to see if that is working to drive traffic to your site for those specific keywords.
Conversion Rate
This includes your visit-to-subscriber conversion rate, visit-to-lead conversion rate, lead-to-customer conversion rate, and so on. Conversion rate is helpful to see how effectively you are converting traffic on your website. Once you optimize pages on your site and start to see more traffic from organic search, it's important to make sure that traffic is taking the next step to convert. If you aren't seeing high conversion rates, this may be a good indication that you aren't optimizing for the right metrics.
Clickthrough Rate
Similar to the email marketing manager's role, the conversion manager needs to look at the clickthrough rate (CTR). The biggest difference in CTR for conversion managers is that CTR isn't just limited to your email marketing campaigns: you'll have a CTR on the calls-to-action on your website and blog, on your social media posts, on emails. This metric is very important no matter which channel you focus on, as it is the indicator that will tell you if people are engaged enough with your content to take the next step and convert.
"When it comes to marketing optimization, what you choose to measure will vary from channel to channel," says Pamela Vaughan, HubSpot's manager of blog optimization and growth. "For instance, my focus for email might be to optimize email clickthrough rate, whereas my focus for the blog might be to optimize our visit-to-subscriber conversion rate. The important thing is to tie your optimization focus (and thus your metrics) to your goals."
7) Campaign Manager
The Campaign Manager can serve a few different roles. At some companies, this may be the person who oversees any marketing campaigns that you run. For other companies, this may be the person in charge of top-of-the-funnel campaigns. No matter what their exact job description entails, their primary responsibility is always around generating leads.
Total Leads Generated
The campaigns manager and his or her team are responsible for generating leads from their marketing campaigns. In addition to looking at the total leads that were generated each month, it's important to break that down by the number of leads generated by each campaign. This'll help inform what works and doesn't work so you can plan more effectively for future campaigns. It can be a good indicator of which types of content works well on certain marketing channels. It can also be a help you figure out which content may only pertain to a niche audience.
Measure the total leads generated by campaign over a couple weeks after your campaign runs. You may find new insight into when to promote your content, what content to create, and the channels that have the most impact on lead generation.
Landing Page Submissions
In addition to the number of leads generated from your campaign, you should also look at the submission rates of your campaign's landing pages.
This will tell you a few things: First, is the landing page giving your visitors something compelling? In other words, is the information on the landing page interesting enough to convince your visitors to fill out the form and read your offer?
Secondly -- and this is often overlooked -- is the original source that refers someone to your landing page aligned with the actual content on your landing page? Oftentimes, we may not check how people are finding the landing page to begin with if we get a good number of leads. But this information is really critical for your future campaigns. If your submission rate specifically from social media is low, for example, then you might discover that social media is not aligned with your landing page message. Similarly, if your submission rate from email marketing is high, you can assume that email is a great channel to get people to come to your landing page and convert on the form.
Conversion Rate of Contacts Through the Funnel
I'm cheating a bit with this one because this metric actually includes about three metrics. In addition to analyzing the conversion rate of your leads by campaign, you also need to see how these leads are moving through the funnel and becoming marketing qualified leads (MQLs), opportunities, and customers. Our three metrics here are MQL conversion rate, opportunity conversion rate, and customer conversion rate.
Understanding how your leads move through the funnel is important to make sure your campaigns are driving the highest quality of leads for your sales team. If your campaigns are only converting visitors to leads, and those leads never move down the funnel, your campaigns are not as successful as you may have initially thought. Create strong campaigns and make your sales team happy by understanding how your campaign leads are converting.
"The conversion rate of campaigns throughout each step of your funnel is critical in determining which types of content attract the highest contacts who turn into customers at a higher rate," says Amanda Sibley, campaigns manager at HubSpot. "At HubSpot, we look at content types, as well as topics when looking at the conversion rates of leads at each step of the funnel. It helps us determine what kind of content to continue to create, and what to stop creating."
8) Sales Manager
The sales manager is in charge of overseeing the sales reps to make sure they're closing deals and hitting their goals.
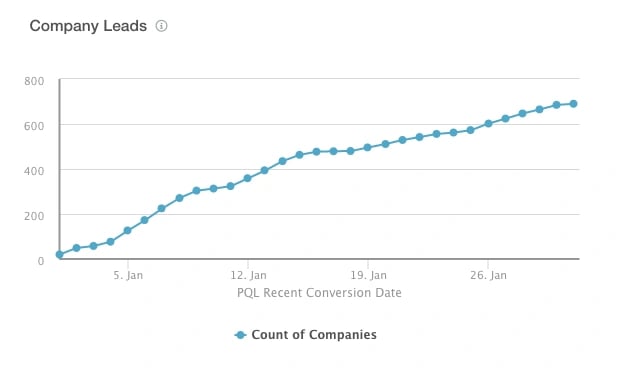
Leads Delivered to Sales
An important part of the relationship between the sales and marketing teams is making sure enough quality leads are delivered from marketing to sales. Part of ensuring this happens is monitoring the progress of how many leads are generated over a month. This isn't a way to "check up" on marketing, but more of a way of making sure both teams are doing their part in generating revenue for the company.
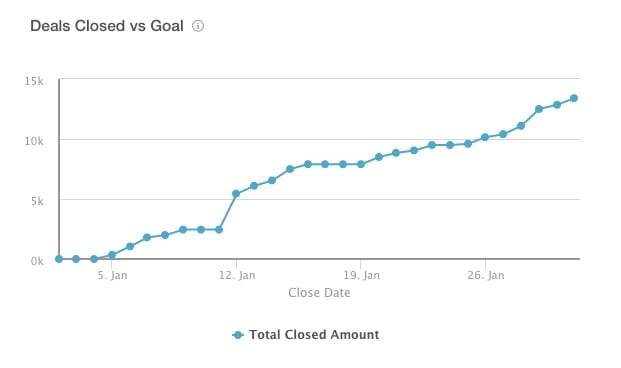
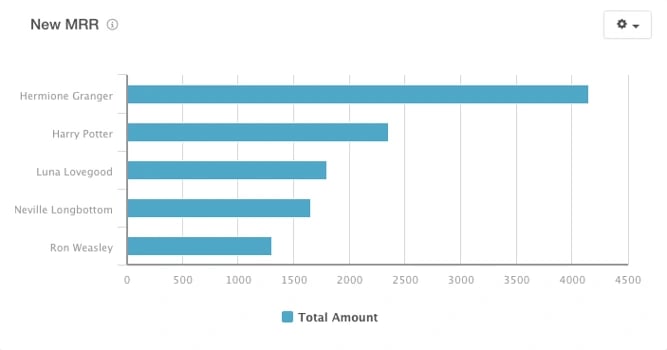
Sales Production
Once the marketing team generates leads for the sales team, it's up to the sales reps to take these leads and use them to close deals. You can choose to look at the overall revenue that's been generated during your sales cycle, or you can break it down by individual rep. This will allow you to monitor who is hitting their quota and who may need more help closing deals.
"Our sales culture as a team changed when we started sending this daily report out," says Michael Pici, a sales manager at HubSpot. "It created a culture of healthy competition and improved the momentum and pace of the sales team."
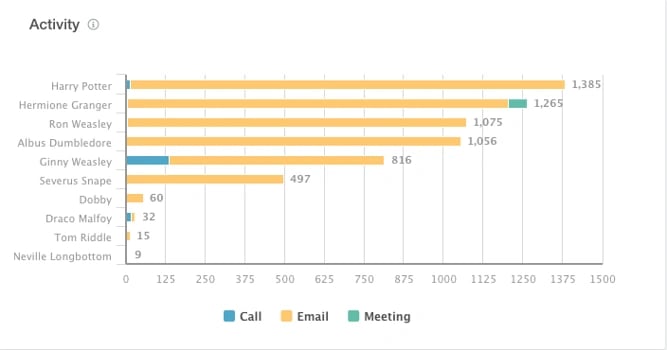
Sales Activities
Many teams may think that the important metrics stop at MRR generated and number of leads generated. But there's more involved in the sales process than just receiving a lead and closing that lead. You also need to monitor the activity of your sales reps such as calls placed, emails sent, and meetings booked. These metrics will help you focus on the efficiency of your team to make sure your reps aren't spending too much time and energy on activities that aren't producing results.
Sales and Marketing Metrics