Social media is an undeniably powerful channel for marketing in 2020.

In fact, social networks are the biggest source of inspiration for consumer purchases, with 37% of consumers finding purchase inspiration through social channels.
However, if you're using social media as a tool for organic exposure and brand awareness, rather than just a channel for paid ads, it can be difficult to track the success of your efforts.
As any social media manager knows, successful implementation of a social media strategy is contingent on countless factors — and all companies prioritize different channels, metrics, and criteria for success.
![Access Now: Social Media Report [Free Template]](https://no-cache.hubspot.com/cta/default/53/1cc615ff-101b-48f6-b60f-7d233c1e8eaf.png)
For example, is paid more important than organic to your business, and if so, to what extent?
Is more importance placed on audience engagement, or audience growth?
Has a posting cadence been directly tied to revenue?
With so many areas of focus for social media marketers, it's crucial to choose, analyze, and report on your key social media metrics with a social media report.
A social media report can help you clearly convey what factors your social media team prioritizes, why those factors matter, and how you're performing against those goals.
In this post, we'll highlight the importance of a social media report, list the metrics you should consider including in one, and walk through a step-by-step process for building a social media report yourself.
For a quick and easy solution to your reporting woes, click here to download HubSpot's Free Social Media Reporting Template.
Why Use a Social Media Report?
A social media report is the best way to distill the key metrics your social media team is tracking on a daily, weekly, monthly, quarterly, and/or annual basis.
Since social media encompasses so much, gathering and reporting on the data and channels that you've determined are most important for your business provides a lens of focus for your social media marketing team, and delivers a necessary high-level overview for leadership.
Social media doesn't just affect marketing. Prospects ask questions, customers write reviews, and thought leaders follow you for company news. Because social media coincides with nearly every aspect of your organization, gathering and distributing the state of your social media channels is a move that shows transparency and encourages cross-company alignment.
You can also use a social media report to report on campaign-level analytics. If your social media account is serving as a cog in a larger company initiative, this report shows to what extent social media contributed to the project's success.
Featured Resource: Free Social Media Report Template
HubSpot's free social media report template has pre-made slides for you to report on all of your predominant social media metrics. Download the template today and simply plug in your own metrics to customize a social media report for your organization.
Social Media Metrics to Report On
Your business likely values some metrics over others when it comes to social media reporting. Likely, these metrics also vary between your channels — since LinkedIn doesn't let you retweet, and Twitter doesn't let you click a cry-face button.
Before you start reporting on your social media channels' performance, read through this list of options of social media metrics so you can determine which ones you should include in your report.
1. Audience Size and Growth
This metric tells you how large your reach is and how quickly that reach is growing. This is typically seen as the core social media metric, as it shows how large of an audience you can leverage with your posts and content.
2. Cadence of Posts
A rather self-explanatory example, this metric represents how many times you posted in a given time period. This metric is usually compared alongside other metrics — such as engagement rates — to help you determine the right cadence for your audience.
This metric should also be channel-specific, because it makes sense to post more frequently on some channels than others.
3. Post Engagement
Post engagement measures how your fans and followers are reacting to your posts with likes, comments, and shares. A healthy post engagement suggests you have a loyal audience — and that your content is reaching them.
You can also track engagement as a percentage of your audience to determine engagement rate.
4. Mentions
One metric you have a little less control over is mentions. You can track mentions from customers, prospects, and even news outlets to gauge perception of your business and brand online.
5. Clickthrough Rate
When a post links to a page on your website, you can measure how many people and what percentage of your audience clicked through to the page. A strong clickthrough rate shows you're sharing website pages that your audience finds relevant.
6. Conversions & New Contacts
Conversions comes into play if you're using social media to generate leads, subscribers, or even customers. If you want to attribute contacts to your social media team's efforts, make sure you're using proper tracking and setting reasonable goals, as it's rare in some industries to go straight from social media to becoming a customer.
7. ROI
Directly tracing ROI (return-on-investment) to social media efforts can be tricky. However, if you determine it's worth reporting on this metric, make sure you have proper expectations set and attribution models established.
8. CPM / CPC
This metric is essential for monitoring the performance on your social media ads. If you're solely reporting on organic social metrics, you can ignore this one.
9. Competitor Metrics
To provide a benchmark, consider analyzing the aforementioned metrics for your competitors. Obviously, these metrics can vary drastically based on publicity, paid budget, and the size of the company, but it's still worthwhile to make the comparison.
How to Make a Social Media Report
Step 1: Choose Your Presentation Method
For consistency and clarity, make sure you're using a social media report presentation, spreadsheet, or memo template. This way, each time you update your metrics, you'll simply need to copy over your most up-to-date metrics onto that template rather than reinventing the wheel every time.
We suggest using a PowerPoint or Google Slide Deck template, because you can share it with your team via email, use it for an in-person meeting or presentation, or both.
Need a template to get started? Try this one.
Step 2: Determine the Metrics You'll Be Reporting On
Like we've established, different companies and different social media teams value different social media metrics.
It's your job to choose the metrics that matter most to your team and your organization.
Using the list from the section above, narrow down the essential metrics you believe are worth presenting to your team at large. Remember, you can change which metrics you report on for each of your organization's social media platforms.
If your social media report is campaign-specific, reach out to the project stakeholders to see if they're hoping to see reporting on any certain metrics in the social media report.
Pro Tip: For your first few ongoing social media reporting presentations, ask your peers which metrics they'd like to see, or which ones they need clarification on. Making these changes sooner rather than later helps you keep your team informed and engaged.
Step 3: Gather Your Data
Once you know what you're reporting on and how you're reporting it, it's time to start collecting data.
When you're first setting up your social media reports, create bookmarks for your data sources. Make a folder for the analytics page for each social media channel you're analyzing and/or your social media reporting software for an all-encompassing view.
If you're tracking click-throughs to your website, make sure you're analyzing from a single master location, such as your tracking URL builder or your traffic tracking tool like HubSpot or Google Analytics.
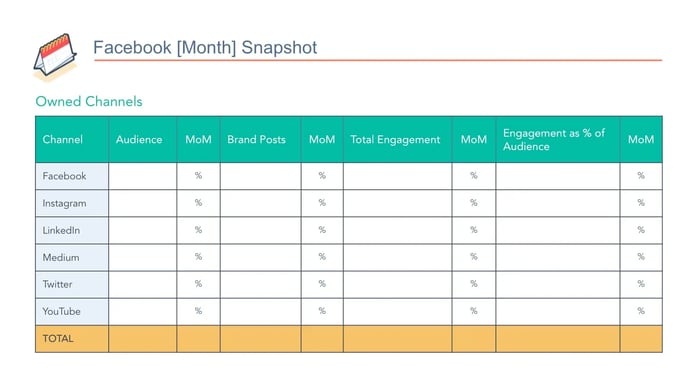
Step 4: Add in Some Visuals
A chart of numbers on a slide deck is, well, pretty boring.
While a numerical chart is important for sharing as much info as possible in an organized way, using visuals is a better way to convey the growth and success metrics of your social media performance. Try incorporating one or all of the following into your social media reports:
- Linear graphs to show followers over time.
- Pie charts to show clicks to different pages of your website (blog pages vs. case studies, for example).
- Bar graphs to show number of engagements on each platform.
These examples are more eye-catching than numbers on a slide and further illustrate what you want your team to walk away with. If data visualization is new to you, check out our Guide on Data Visualization for Marketers.
Step 5: Think of Your Story
A running social media report should always remind people about where you came from and where you plan on going. That said, make sure your reports make reference to how your numbers have changed since the last period of time on which you presented, in addition to why numbers have changed.
Did follower growth as a percent increase drop last month? Maybe that's because one of your posts from the month before went viral and resulted in unprecedented growth that was impossible to match. Make that clear and add context to the numbers.
Additionally, each report should contain clear action items about how you plan to continuously improve your social media performance. Social media is constantly evolving, so your approach and strategy for it should, too.
Now that you're equipped with the knowledge to build, design, and share your social media report, download your social media report template and get to work!


![The Future of Social Media [Research]: What Marketers Need to Know](https://blog.hubspot.com/hubfs/Future%20of%20Social%20Media.jpg)

![The Most Effective Types of Content on Social Media in 2024 [New Data]](https://blog.hubspot.com/hubfs/Copy%20of%20Featured%20Image%20Template%20Backgrounds%20%2816%29.png)


![11 Social Media Trends Marketers Should Watch in 2024 [New Data]](https://blog.hubspot.com/hubfs/social-media-trends_6.webp)