
Below, you’ll see some of the best examples around, along with some free templates to get you started. Dive in below and find your favorite
Table of Contents
What is a Gantt Chart?
Gantt charts are project management tools that help marketers visualize project timelines, progress, and deliverables. Visual lines or bars clearly display which tasks are completed and what’s to come, allowing managers to allocate time and responsibility accordingly.
Components of a Gantt Chart
The basic principle of a Gantt chart is that it charts projects against time.
Like most charts, it has horizontal and vertical axes. The tasks or projects you want to complete are usually on the vertical axis. The timeline to complete these projects or tasks is usually on the horizontal axis.
Gantt charts also have horizontal bars that represent progress with each task or project. The length of the bars represents your progress with each task.
I like to group most of the components or elements of a Gantt chart into four main categories:
- Resources. Project managers must have insight into what resources are needed for tasks outlined in a Gantt chart to complete each task on time.
- Milestones. Along your timeline, there will likely be small and large milestones that must be hit to keep your project on track. For instance, a blog launch milestone might be a “blog post draft due on 5/30.” You should include such detail in your chart.
- Tasks. For each milestone, there are smaller daily tasks you and your team members must complete. Your chart should contain the list of those activities. For example, “edit blog post.”
- Dependencies. Tasks on your Gantt chart will be related to each other. For example, the editor won’t be able to edit the blog post until the writer has met their milestone and submitted their draft on 5/30. Note these dependencies in your chart.
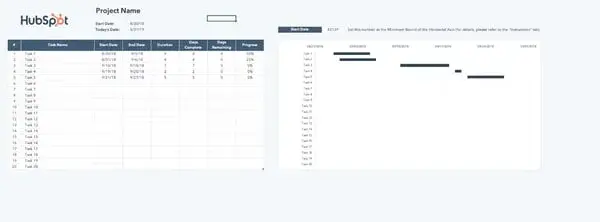
Free Gantt Chart Template
This Gantt chart template makes it easy to...
- Outline your project.
- Highlight key stages.
- Set due dates.
- And more!
Benefits of Using a Gantt Chart
A Gantt chart‘s primary goal is to track a project’s timeline and completion. It’s beneficial for project managers (PMs) who must keep team momentum on campaigns with many moving parts, like product launches or marketing events.
Here are some additional benefits of using Gantt charts:
- Visual tracking gives an overarching view of projects and their timelines, helping the directly responsible individuals (DRIs) understand progress and assign responsibility accordingly.
- Clear project timelines aid with resource planning, as you'll know which tasks require which tools and exactly when DRIs will need those tools.
- Visual understanding of which project elements rely on each other for completion so PMs can inform responsible individuals of high-priority tasks.
- Increased transparency, as all parties are aware of expectations and how individual progress impacts team progress.
How to Use HubSpot’s Gantt Chart Template
- Update project name and start date.
- Configure the Gantt chart.
- Review project scope.
- Identify key tasks and milestones.
- Estimate task dates.
Getting started with your first Gantt chart is one of the best ways to create a visual roadmap for your project.
Here’s how to use our template for Excel to create a chart that helps you stay on target. Alternatively, you can also use free Gantt chart software.
Step 1: Update the project name and start date.
After downloading the template, take a few minutes to configure it. We’ve included instructions in one of the tabs and are walking you through it here.
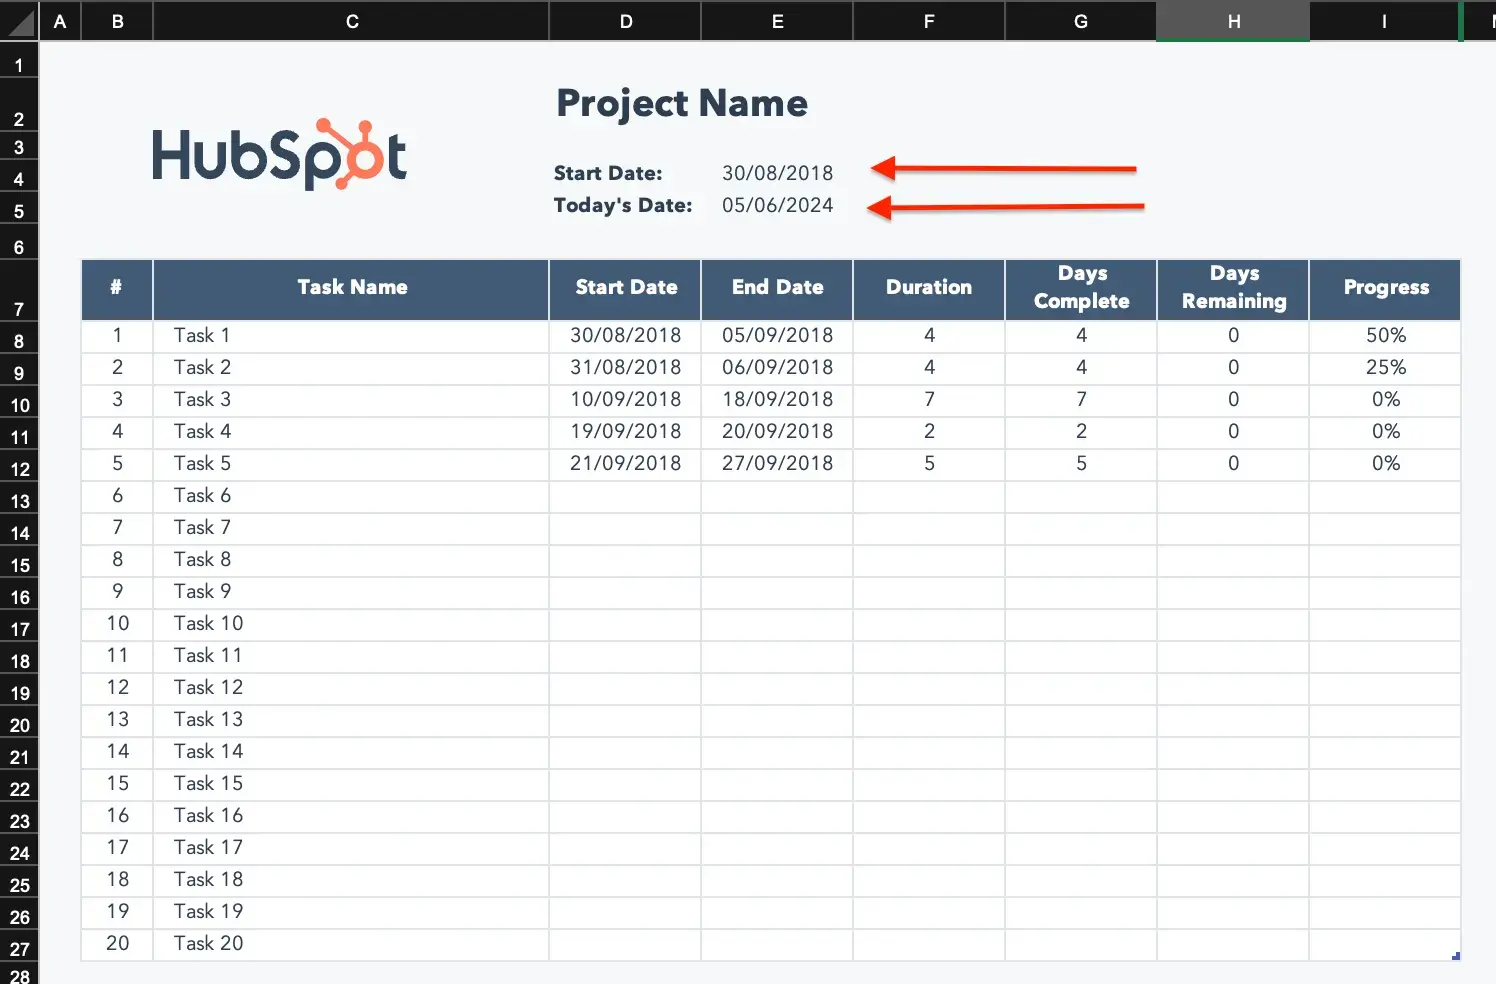
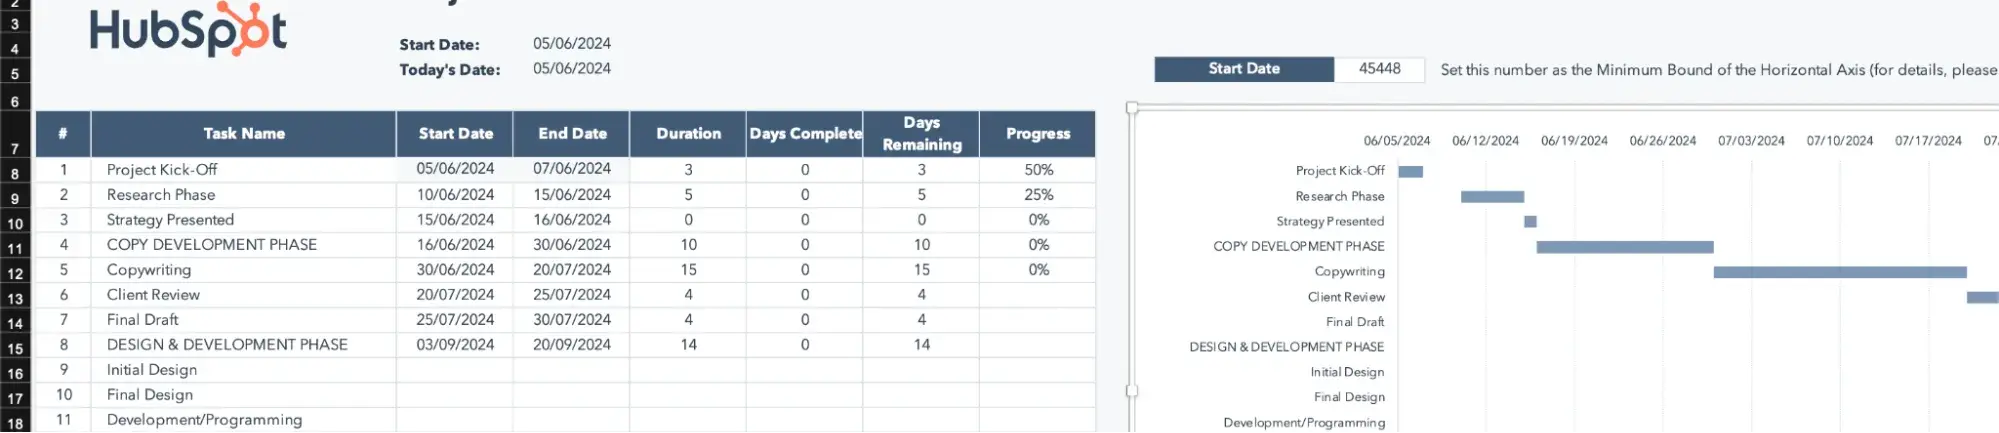
Replace the “Project Name” placeholder with your project information. Today’s date automatically populates. However, you’ll need to choose a start date.
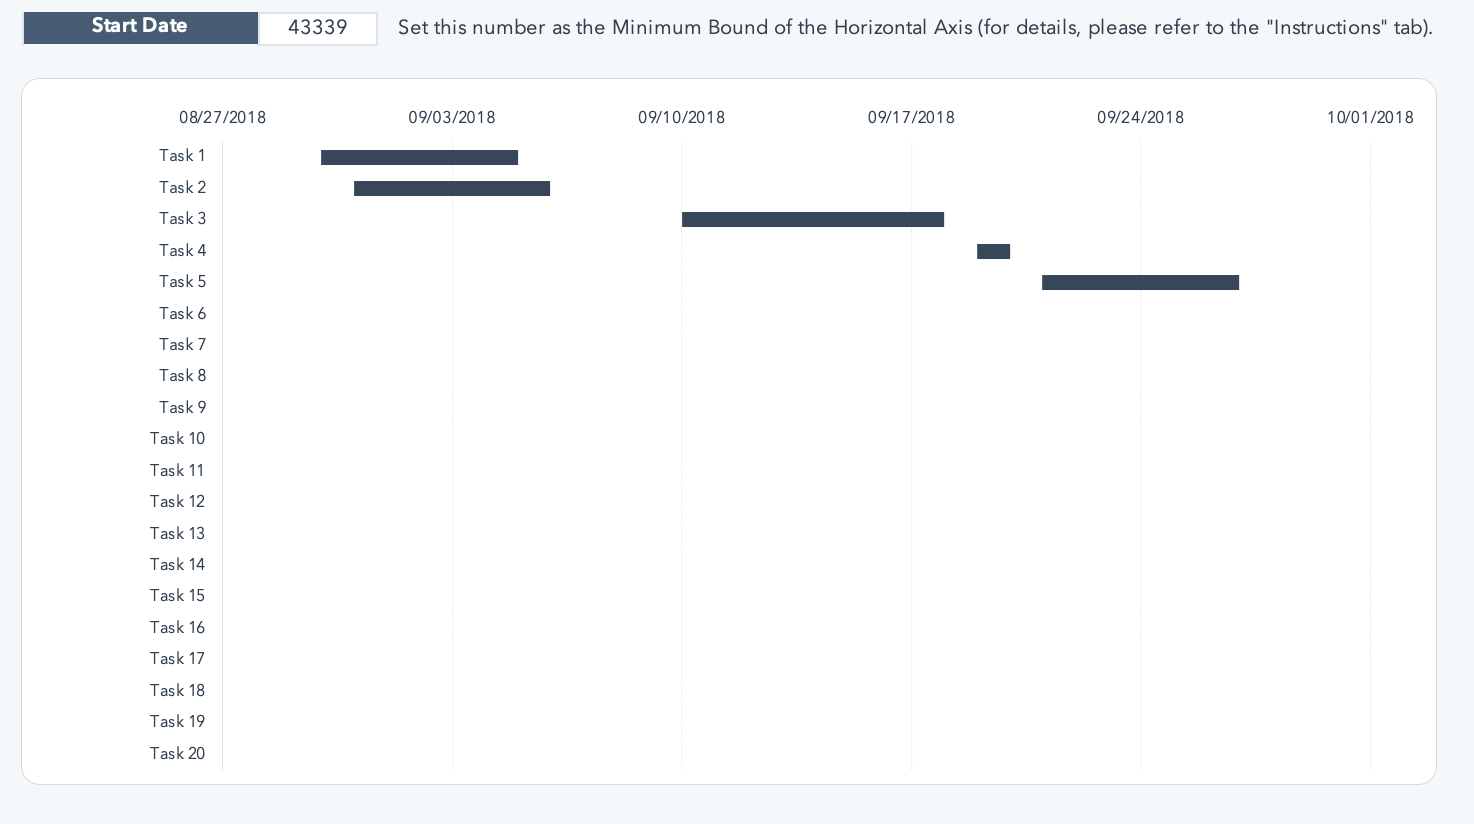
Step 2: Configure the Gantt chart with your start date.
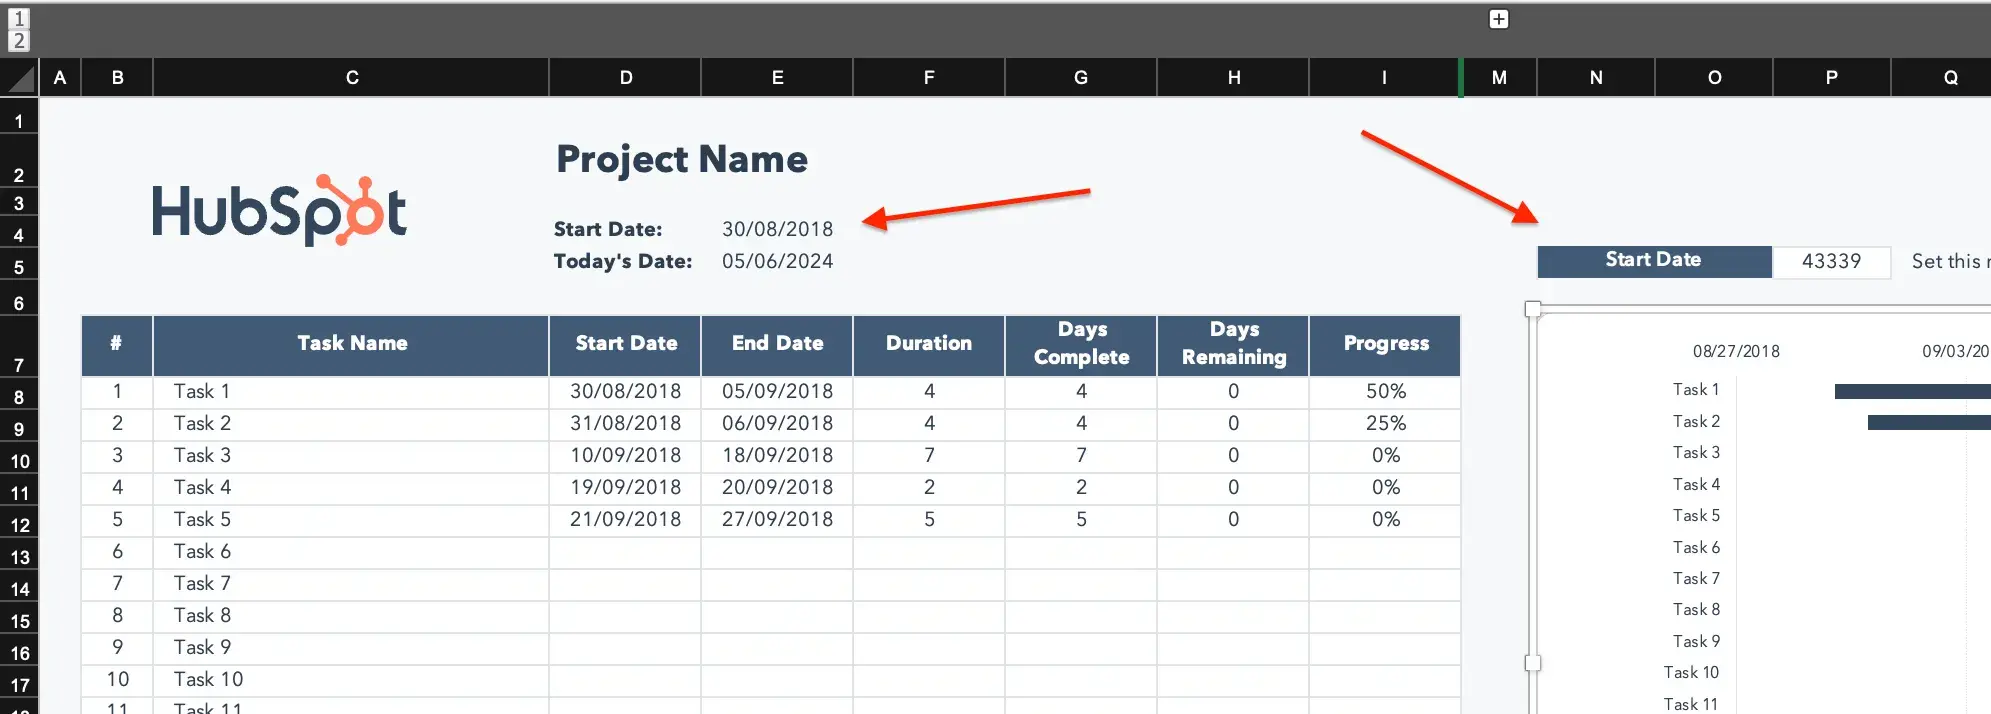
The start date you choose populates at the top of the Gantt chart as a 5-digit number.
Depending on your screen size, you may need to make note of this number (or you may still be able to see it in the next step).
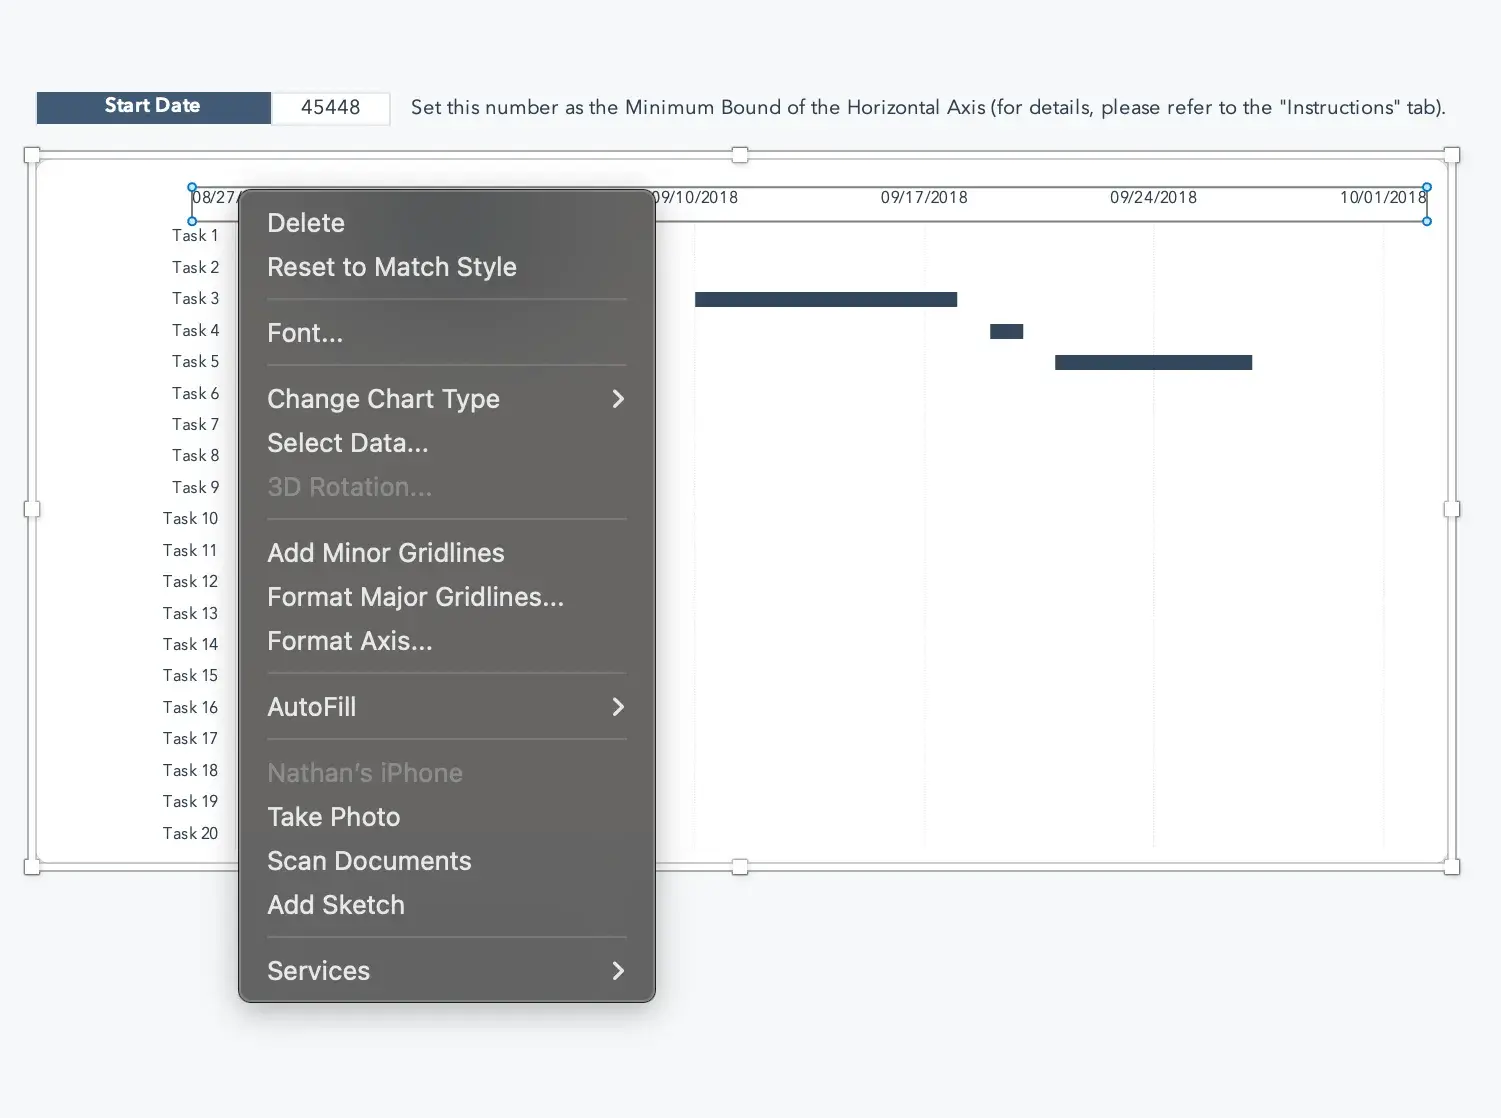
You’ll see that the dates in the Gantt chart example don’t yet reflect your project dates. To change that, right-click one of the dates in the top bar of the Gantt chart and choose “Format Axis” from the dropdown menu.
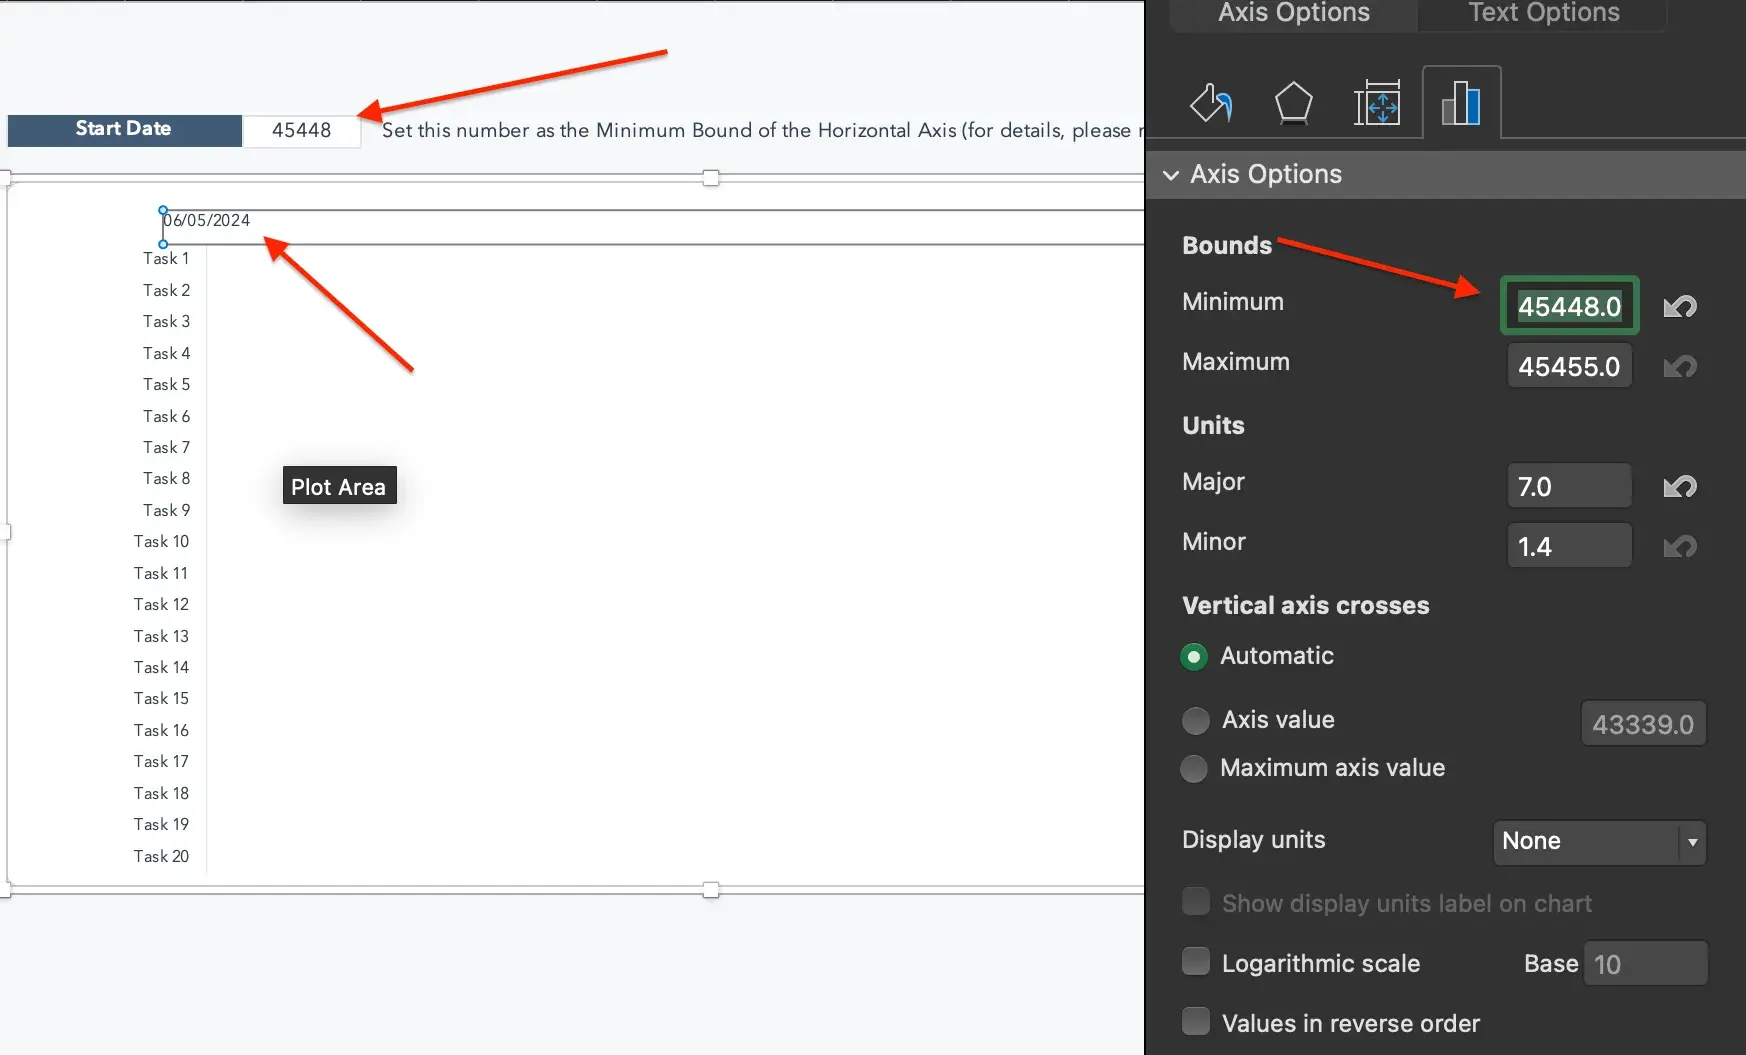
Change the Minimum Bound to your start date. The Gantt chart will now reflect your project start date.
Step 3: Review project scope.
When creating a Gantt chart, understanding how your project flows is the most critical aspect. By inputting good data, your chart will be accurate and effective.
Review the proposal and any phases you’ve identified. If you haven’t defined what happens in each phase, take a few moments to do so. You may or may not need to track all of them.
However, using the Gantt chart helps you identify which are most important to the stakeholders.
Step 4: Select key tasks and milestones.
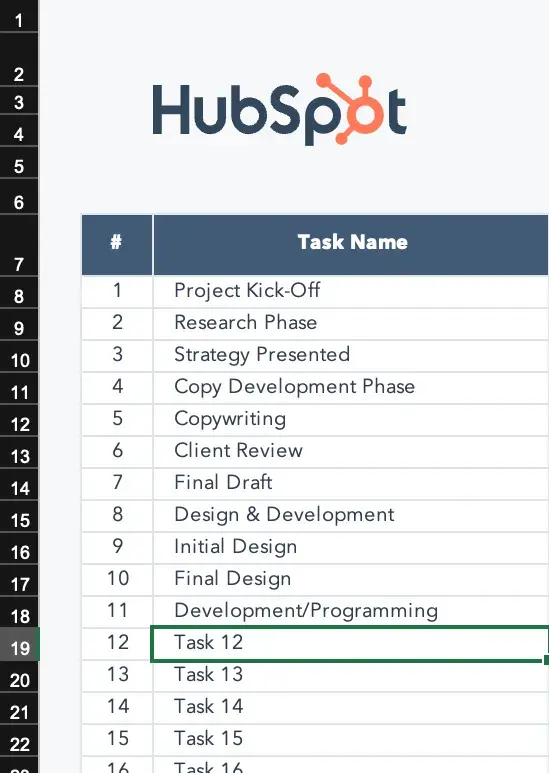
After identifying all project tasks, identify key tasks and milestones and plug them into the Task list.
Step 5: Estimate dates for each task.
Enter approximate start and end dates next to each task. As you go, you’ll notice that your chart begins to populate.
If you want to track entire phases as well as individual tasks, enter them in. The above Gantt chart example uses all caps to track phases and title cases for individual tasks. You can also see how phases overlap individual tasks.
Note: If you have more than 20 tasks, add rows by right-clicking any number between 2 and 20 and selecting “Insert Row” from the dropdown. However, it’s essential to add them above #20 (Row 27) to keep formulas operational.
The columns automatically track allotted dates, and you can track actual time spent to estimate future projects better.
How to Make a Gantt Chart
You can create your own Gantt charts in Excel, PowerPoint, Google Sheets, and more, and this tracking method can be used in various industries, from marketing to construction and even design.
Let’s dive in with some beautiful Gantt chart examples below. Prepare to geek out.
Free Gantt Chart Template
This Gantt chart template makes it easy to...
- Outline your project.
- Highlight key stages.
- Set due dates.
- And more!
1. How to Make a Gantt Chart in Excel
Creating Gantt charts in Excel is a common practice and one you’ll likely come across in your work. Excel doesn’t have a predefined Gantt chart, but the “Stacked Bar” feature is your friend, allowing you to show project progression.
Here’s an example of an Excel Gantt chart.
2. How to Make a Gantt Chart in PowerPoint
Want to include a Gantt chart in your next PowerPoint presentation? Use this PowerPoint example as your guide.
PowerPoint doesn’t have a built-in Gantt feature, but you can build and edit a chart inside of the platform using their “Stacked Bar” feature.
Pro tip: Leverage the taskbars and adjust their length per your plan. This template is also flexible, so you can shorten or increase the length of tasks if things come up during your project execution process.
Make unique color codes for each specific task so you can place a corresponding milestone image when completed. This way, you can monitor your progress and immediately understand each color's meaning.
3. How to Make a Gantt Chart in Word
What’s that? You’re not familiar with Microsoft’s “Stacked Bar” feature yet? Well, if you’re getting friendly with Gantt charts, you’ll use this go-to feature quite often.
If you’re creating a Gantt chart in Microsoft Word, you’ll stack bars once more. However, if you update and tweak your Gantt chart regularly, Excel or PowerPoint may give you better flexibility.
Pro tip: When using the template above, leverage the stackable bars feature to create an interactive Gantt chart to demonstrate task progress and monitor your accomplishments clearly.
In addition, create a daily check-in schedule on your chart so you can move the “Today” line forward as each day goes on, helping you stay on track and understand what’s to come.
4. How to Make a Gantt Chart in Google Sheets
If Google Sheets is where you spend most of your time, this is the Gantt chart for you. G-Sheets makes it easy to build customizable Gantt charts you can edit as needed using simple formulas.
If you’re creating a Gantt chart in Google Sheets, use the above template and circulation table for automated chart creation. Simply input the information specific to your business, and the chart will be created automatically.
Note: You have less creative freedom with this chart, but it’s excellent for those hesitant to create a chart from scratch.
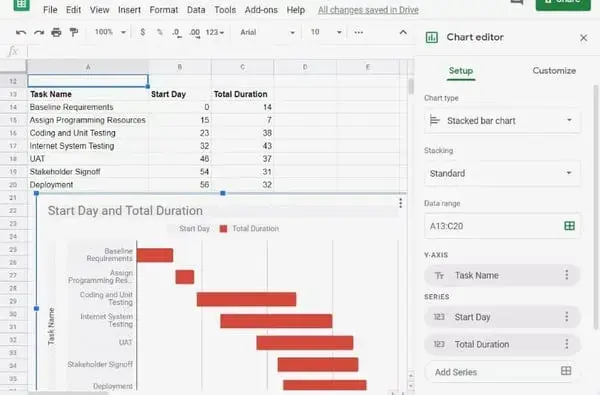
5. How to Make a Gantt Chart in Google Docs
Want a Gantt chart you can share and collaborate on with colleagues? Consider creating your chart in a Google Document. Save it to your Google Drive and share it as normal.
Google offers “Stacked Chart” options in their “Chart Editor,” so getting started is a breeze.
Pro tip: In Google Docs, use the timeline template documents to your advantage and give yourself an overview of your project progress. It’ll help with visualization, staying on track, and allowing you to see how you’re progressing over time. You can then share information with relevant stakeholders.
Examples of Gantt Charts
1. Gantt Chart for Editorial Calendar
Take your editorial calendar up a notch with a Gantt chart. Include publication dates as your milestones, add subgroups for each phase of content creation, and add tasks to your chart.
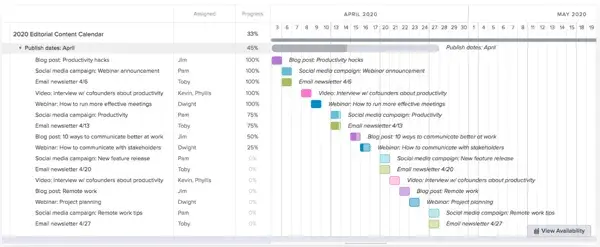
What I like: The color coding on this chart allows you to identify distinct tasks at a glance quickly. The colored squares also reflect the percentage of the project that has been completed, going from a light shade to a darker one as your team makes progress.
2. Gantt Chart for Project Management
Project management is one of the most common verticals relying on Gantt charts.
These charts help project managers identify the tasks involved in each project, create a timeline for each task, and assign dates, tools, and progress updates for each of the tasks within the project.
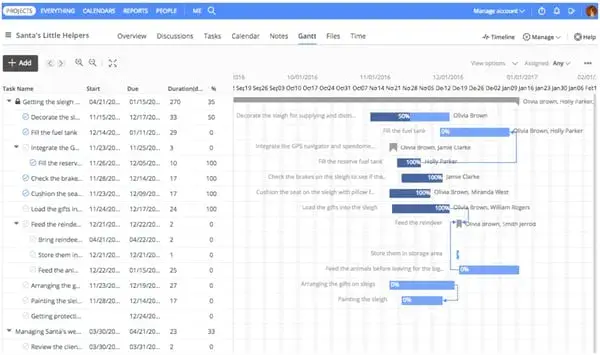
What I like: This chart uses bars with lengths corresponding to the dates assigned to each task. You can visualize the length of time for each task, how they relate chronologically, and whether there’s any overlap.
3. Gantt Chart for Marketing Campaign
There are many tools available that help marketers create Gantt charts, especially for marketing campaigns. This example from GanttPro offers ready-made campaign templates with predefined tasks, subtasks, and milestones.
What I like: This template allows you to clearly group subtasks together to coordinate all the components of your campaign with one Gantt chart. This chart also makes it easy to assign tasks and know who is responsible for what.
4. Gantt Chart for Design Projects
Designers, you can use Gantt charts, too. Plan design launches, track brainstorming, and share draft progress with a carefully organized chart, like the example below.
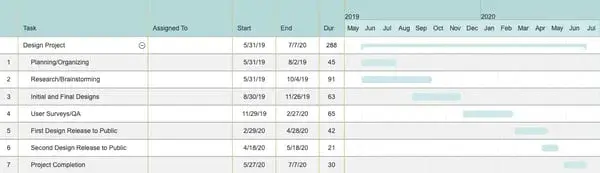
What I like: This chart allows you to break down each step of your design project and visualize how long the total project will take. It’s easy to take some of the steps for granted, but it’s essential to name and designate a timeframe for each.
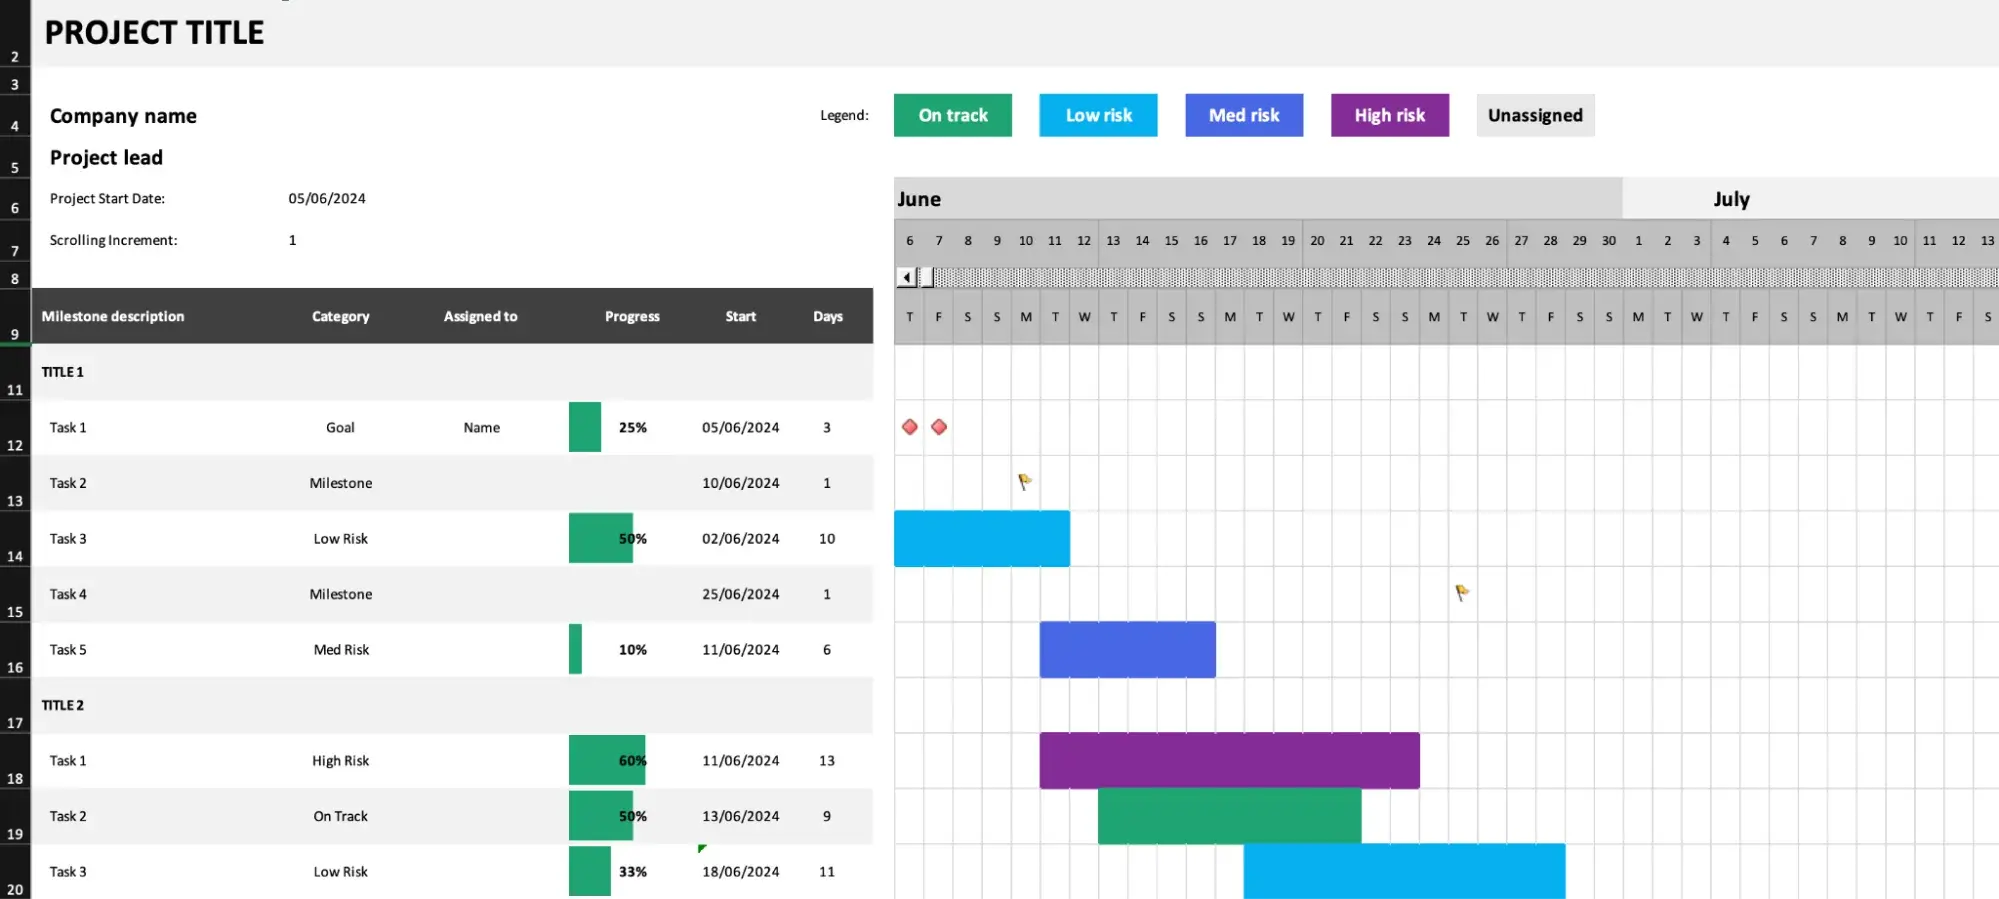
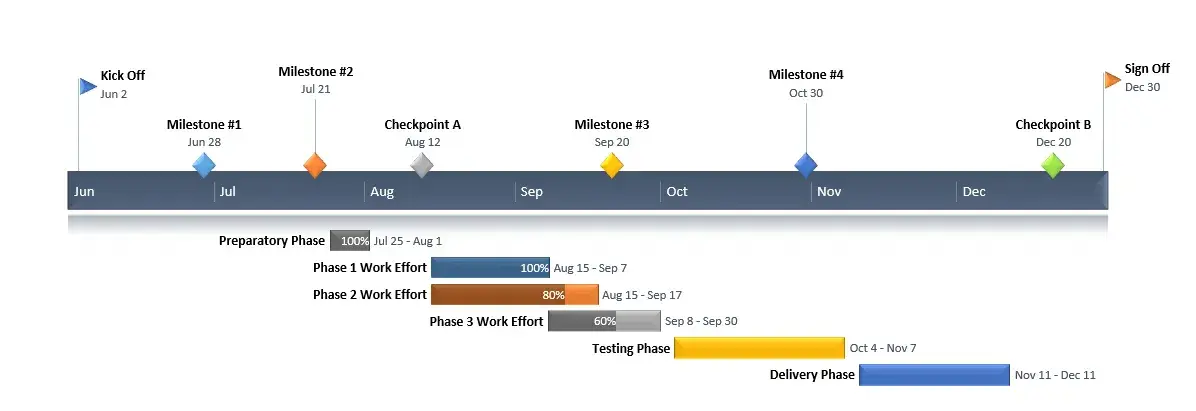
5. Gantt Chart for Product Launch
Product launches have many moving parts. Keep track of research, budgets, team roles, and even risk assessment in a customizable Gantt chart like this one. You can even set dependencies and assign tasks to certain people.
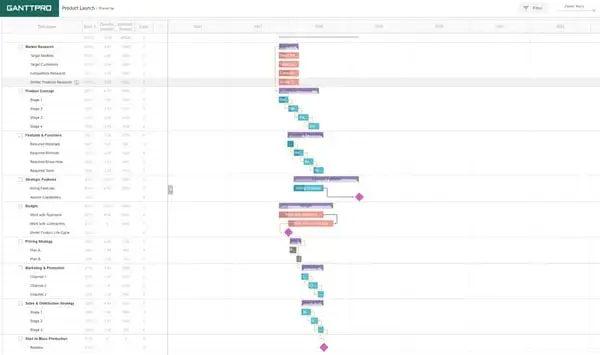
What I like: This chart displays both the total timeframe for the project, the overlap of tasks, and which tasks depend on which, giving you a visual for the big picture while keeping track of your progress.
6. Gantt Chart for Social Media Campaign
When mapping a social media marketing campaign using a Gantt chart, include the tools you’ll need, the content you’ll be sharing, and the assets used on each channel. We love this example from Fabrik.
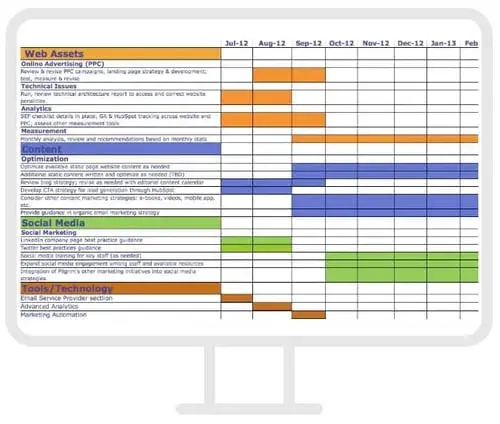
What I like: This chart includes all the major categories necessary for a social media campaign — web assets, content, and tools/technology — along with the specific tasks belonging to each category.
This gives you a comprehensive view of the campaign and its progress.
7. Gantt Chart for Event Marketing
From outreach before the event to “thank you” emails once it’s over, planning an event requires high levels of organization.
Use a Gantt chart like this one to keep track of your strategy, team progress, and key actions before, during, and after your event.
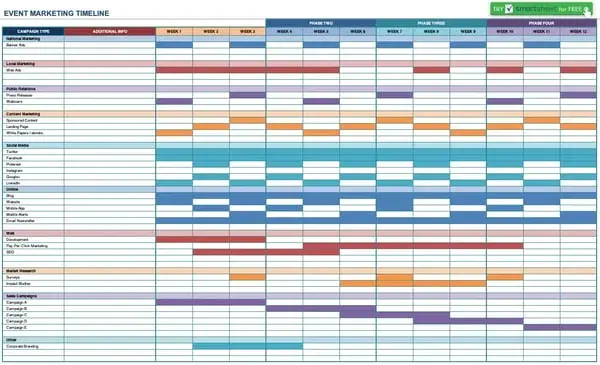
What I like: The color coding helps make the complexities of event planning and marketing more manageable. While this example doesn’t provide many details, it gives you a good idea of how a Gantt chart can help you organize your event.
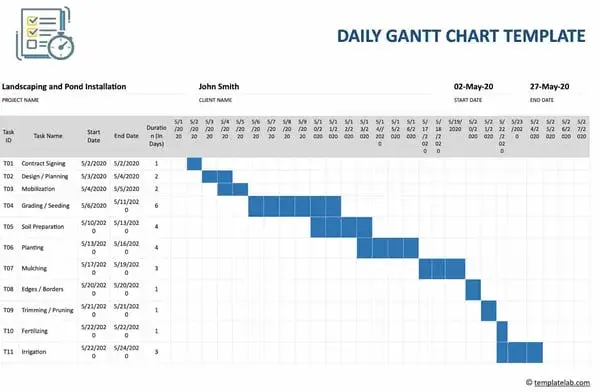
8. Gantt Chart for Construction Projects
Construction teams revolve around schedules, and a Gantt chart makes it easier to plan, sequence, and track every phase of the build. From site preparation and foundations to inspections and handover, a well-structured Gantt chart keeps everyone aligned on what happens when.

What I like: This chart shows task dependencies, project milestones, critical path activities, percentage of completion of activities, and other important construction scheduling details. You can instantly see how delays in one activity impact others, making it easier to adjust timelines, coordinate trades, and keep the project moving without costly surprises.
Getting Started With Gantt Charts
Gantt charts can help keep your projects organized so you never miss a beat.
When you’re ready to begin creating your Gantt chart, refer to the examples on this list and download our free Excel template to start.
Editor's note: This post was originally published in April 2023 and has been updated for comprehensiveness.
Project Management


![I Took a Deep Dive Into PERT to Create More Accurate Time Estimates [+ Templates, Examples, and Formula]](https://53.fs1.hubspotusercontent-na1.net/hubfs/53/pert-1-20250213-8082845.webp)

![5 Dos and Don'ts When Making a SMART Goal [+ Examples]](https://53.fs1.hubspotusercontent-na1.net/hubfs/53/smart-goals.webp)
![The Business Requirement Document: What It Is and How to Write It [+5 Templates]](https://53.fs1.hubspotusercontent-na1.net/hubfs/53/what-is-a-business-requirement-doc.jpg)