We all know that one of the best ways to support any argument or idea is with data, but data alone can be difficult to grasp or easily misinterpreted by your audience if it’s not presented in a visually aesthetic way.
Think about it. Have you ever seen a data-packed presentation, report, or infographic that made you think way too hard to interpret what message all the statistics, images and charts were actually trying to say?
![Download Now: An Introduction to Data Visualization for Marketers [Free Guide]](https://no-cache.hubspot.com/cta/default/53/6ecf26a9-faff-4c16-a2d4-b70751ce8b65.png)
While the presenter/creator had every intention of using data to convince you their message matters, the result was the exact opposite: You’re confused and indifferent instead of convinced to believe, do, or act the way they originally hoped.
Since we all have to make a strong case for our ideas from time to time, and because we often only have one attempt to get it right, we put together a guide, An Introduction to Data Visualization, so you can more effectively communicate your ideas at every level of your organization -- whether in annual reports, weekly presentations, or in your marketing collateral.
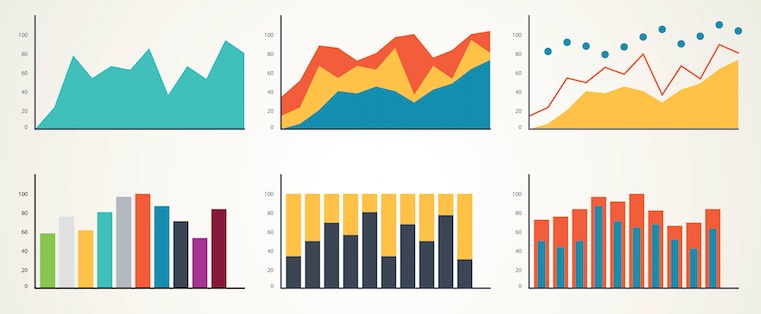
When you present your stats, facts, and figures properly using design techniques like changes in color, size, or orientation, your numbers can help you:
- Answer questions, such as, “How many website visitors did we have last month?”
- Communicate quickly and effectively that, "Traffic to our website is up," for example.
- Discover new insights like, “The majority of visitors went straight to our blog.”
- Add objectivity to an argument: “This is why we should invest in our blog.”
Find out when to use data visualization, how to find the story in your data to make your point, and best practices for visualizing your findings to make the biggest impact on your audience by downloading your own copy below.
![Blog - Data Visualization [List-Based]](https://no-cache.hubspot.com/cta/default/53/2f02d8fe-c9b0-4078-a3ae-5831c892fbd0.png)
![16 Best Types of Charts and Graphs for Data Visualization [+ Guide]](https://blog.hubspot.com/hubfs/types-of-graphs-for-data-visualization.jpg)


![An Introduction to Data Visualization: How to Create Compelling Charts & Graphs [Ebook]](https://blog.hubspot.com/hubfs/data-visualization-guide.jpg)

![How to Create an Infographic Using Poll & Survey Data [Infographic]](https://blog.hubspot.com/hubfs/00-Blog_Thinkstock_Images/Survey_Data_Infographic.jpg)