When we think about visual marketing content, it's easy to default to popular mediums like television, web video, and social media. It's for good reason, too. These channels do a great job of grabbing your audience's attention and getting them familiar with the visuals related to your brand.

But, there's one type of visual marketing content that's sometimes overlooked by marketing teams. It's not as flashy as high-end influencer videos or Super Bowl commercials, but it's one of the most effective and reliable forms of marketing content.
Infographics are an excellent marketing tool for educating customers and sharing information. They describe a product, service, dataset, or action in a visual way so that it's easier to comprehend as the reader. Infographics have been used for marketing purposes since the 19th century and they continue to be an effective tool for marketers to this day.
Read on for some additional stats you should know about infographics this year.
Infographic Stats to Know in 2020
Marketing Efforts
- 32% of marketers believe that visuals are the most important type of content that they're business creates. (Social Media Examiner)
- In 2019, 74% of marketing content contained a visual element. (Venngage)
- 65% of brands use infographics for marketing purposes. (Xerox)
- 56% of marketers use visuals in all of their marketing content. (Social Media Today)
- Infographics can increase website traffic by up to 12%. (One Spot)
- Infographics are the fourth most-used type of content marketing. (HubSpot)
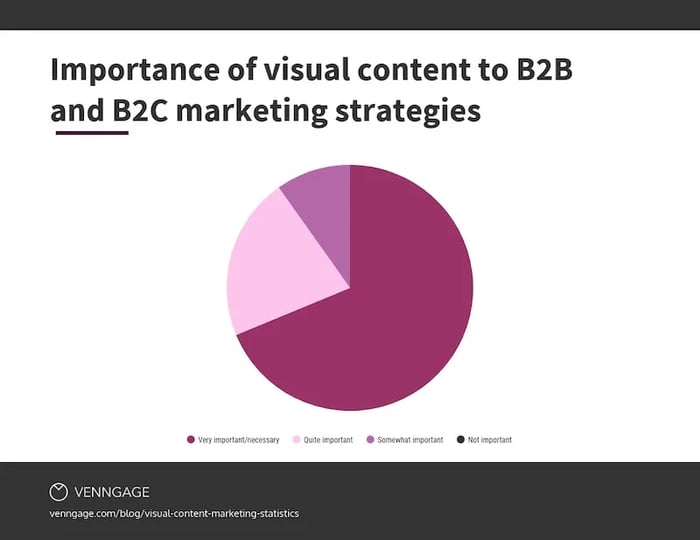
- In 2018, 69% of marketers said that visual content was either "very important" or "absolutely necessary." (Venngage)
Buyer Behavior
- 90% of the information transmitted to the brain is visual. (Infographic World)
- On average, people will remember 65% of the information they see in a visual. Whereas they will only remember 10% of the information that they hear out loud. (Cognition)
- Infographics are 30 times more likely to be read in their entirety than blog posts or news articles. (Digital Information World)
- 65% of buyers are visual learners — meaning they absorb the most information when they look at an image, graphic, or video. (Pearson)
- Web articles that contain images receive 94% more views than articles that don't. (Jeff Bullas)
- When directions are accompanied by visuals, readers are 323% more likely to complete the action described. (Springer)
- Web content that includes images gets 650% more engagement than content that only includes text. (Webdam)
- 84% of people who have used an infographic consider them to be useful. (Infographic World)
Sales Engagement
- Infographics and other colorful visuals can increase sales by up to 80%. (Xerox)
- Consumers tend to focus on "information-carrying images" like infographics more than they read the page's text. (NN Group)
- Buyers understand infographics better than they understand written instructions. (Springer)
- The brain processes visual information 60 times faster than written information. (Content Factory 1)
- Presentations with visual aides are 43% more persuasive. (MIS Research Center)
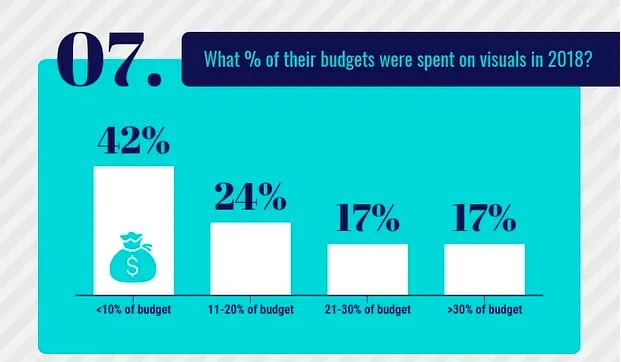
- In 2018, 42% of marketing teams spent less than 10% of their budget on creating visual content. (Sproutworth)
Social Media
- Infographics are liked and shared more than any other type of content on social media. (NN Group)
- Facebook posts that include an image receive twice as much engagement than posts that don't include an image. (BuzzSumo)
- 74% of marketers include visuals when posting on social media. (Social Media Examiner)
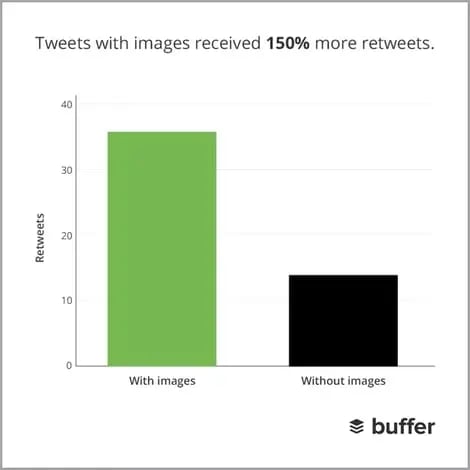
- Tweets that include visuals are 150% more likely to be retweeted. (Buffer)
Using Infographics With Your Marketing Strategies
Infographics are used in a variety of marketing campaigns. You can use them to educate buyers about new products or services, or you can use them to enhance your marketing content by adding an eye-catching visual element.
You can also utilize them to explain how to use a product or service effectively. Adding visuals to your onboarding process can make it a lot easier for new customers to learn how to use your product or service — which can make a significant difference in customer satisfaction and retention. After all, your customers may be happy when they buy your product, but they won't be thrilled for long if they can't figure out how to use it.
If you're looking to create your own infographics, learn how to create infographics with free PowerPoint templates.
![How To Create An Infographic In PowerPoint [+Free Templates]](https://blog.hubspot.com/hubfs/Untitled%20design%20%2885%29-2.png)
![How to Create the Perfect Project Timeline [Template + Examples]](https://blog.hubspot.com/hubfs/project-timeline-example%20%281%29.jpg)


![6 Ways to Use Icons in Your Infographics [+ Where to Find Free Icons]](https://blog.hubspot.com/hubfs/infographicicons_8.webp)