.png?width=112&height=112&name=Image%20Hackathon%20%E2%80%93%20Square%20(14).png)

In my experience working in sales organizations, too few leaders know their numbers and how to turn their insights into action.
In this post, I'll cover the top sales KPIs and metrics you should measure. I’ll also break it down role by role, so you can learn how to analyze your sales managers, business development reps, account managers, and sales development reps by performance.
You can also access a free sales metrics and KPI template and calculator to measure your team’s performance. Let’s get started.
Table of Contents
- What are KPIs in sales?
- KPIs for Sales Managers
- Account Manager KPIs
- KPIs for Sales and Marketing to Track
- KPIs for Business Development Reps
- KPIs for Sales Development Reps
- Sales KPI Template and Calculator
.png)
Free Sales Metrics Calculator
A free, interactive template to calculate your sales KPIs.
- Average Deal Size
- Customer Acquisition Cost (CAC)
- Customer Lifetime Value (CLV)
- And more!
Download Free
All fields are required.
What are KPIs in sales?
Sales KPIs are metrics used to track the performance of a business, a sales team, or individual salespeople against their goals. Choosing KPIs that are most relevant to your industry and business goals is key— focusing on the wrong ones can be costly to your company.
What does KPI stand for in sales?
KPI stands for key performance indicators. KPI examples in sales can come in many different forms because they measure specific activities. Sales managers, account managers, sales reps, and even marketers have sales KPIs that they should track.
To save you some time, I've narrowed down a list of sample KPIs for sales managers— focusing on the ones I believe are most important to managing field sales teams.
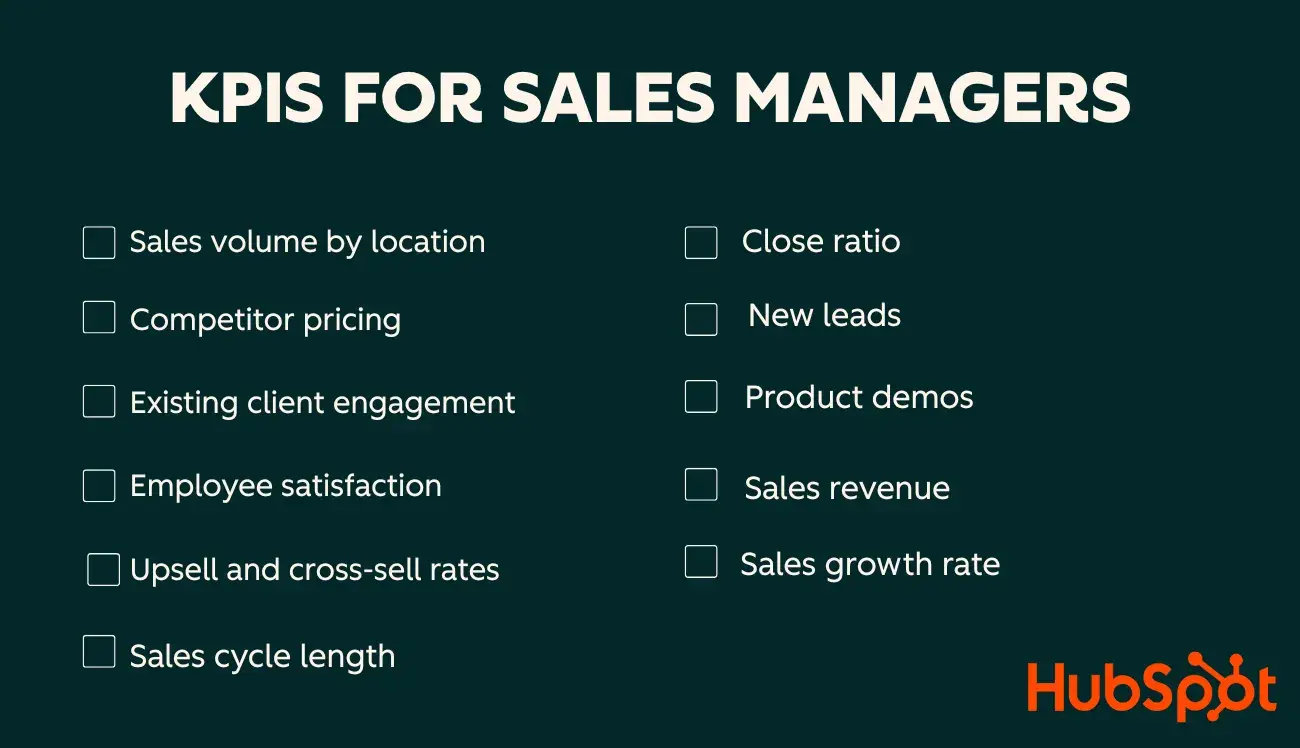
KPIs for Sales Managers
- Sales Volume by Location
- Competitor Pricing
- Existing Client Engagement
- Employee Satisfaction
- Upsell and Cross-sell Rates
- Sales Cycle Length
- Close Ratio
- New Leads
- Product Demos
- Sales Revenue
- Sales Growth Rate
If your company aspires to increase revenue and accelerate growth (which company doesn’t?), these sales KPIs can offer insights into how to reach your goals. They’re like the dashboard in a sports car, indicating when you need to speed up to keep pace with your competitors— or slow down when the road ahead is unclear or dangerous.
1. Sales Volume by Location
Sales volume by location measures the number of sales transactions or revenue between stores. By comparing across locations, including physical stores and online transactions, you’ll see where demand for your product is highest and lowest and can attempt to understand why.
I suggest using this information for A/B testing, promotional sales, or samples.
If sales volume is large in region A, perhaps there is a higher demand there, in which case you can focus on customizing certain products and services for that region. Or, if two locations see relatively similar sales volume in January, sales leaders can try implementing a promotional sale in one location and not the other in February to see if it drives sales.
2. Competitor Pricing
I think competitor pricing is important market intelligence to make sure that your pricing strategies are fair and reasonable, and that you aren’t losing deals or market share on pricing alone. 35% of sellers surveyed in the State of Sales Report lost deals because prospects aren’t convinced the product or service is worth the price.
Some businesses that offer commodity products, like Amazon, closely monitor competitor pricing and use dynamic pricing fluctuations to stay competitive. Some SaaS companies use a competitor-based pricing strategy, though their pricing models are usually based on feature tiers, functionality modules, or utility pricing.
I’ve always preferred selling based on a value-based pricing model and my company’s unique selling proposition. In my recent role as a proposal writer, I’ve seen some bids so low that it’s clear that some competitors don’t understand the scope of the work they need to deliver. Or, they are willing to sacrifice profitability now to win a prospect’s business to secure other deals in the long term.
If your business is losing too many deals based on price, try using a value-based pricing model before cutting the prices themselves. This is especially true if you can unbundle or deactivate product features to offer pricing that aligns with your comprehensive solution.
Pro tip: Make sure you’re training your reps to handle pricing objections appropriately. Try role-play exercises so they're prepared to defend your prices with value statements instead of defaulting to discounts.
3. Existing Client Engagement
Maintaining a good rapport with customers after the sale is equally important for maintaining long-term business. As a sales rep, I continue to maintain relationships by regularly touching base with customers. This helps me retain clients, earn referrals, and learn more about my audience’s challenges.
You can measure customer relationship management by tracking customers in a spreadsheet or CRM and running regular performance reports showing how interactions impact lifetime customer value.
4. Employee Satisfaction
Believe it or not, employee satisfaction impacts your sales. Sales reps who believe in your company and feel engaged at work will do a much better job at selling your products. Consider that:
- 98% of surveyed sales professionals say that sales culture is important to job satisfaction.
- 98% say that sales culture is important to meeting sales goals.
Employee satisfaction can be difficult to quantify, so I suggest using an eNPS survey, along with a few qualifying questions to understand what's making them happy or unhappy, then compare the results against your goal.
5. Upsell and Cross-Sell Rates
Who are the most qualified leads in your CRM? Your existing customers. According to HubSpot's Sales Trends Report, 76% of sales professionals shared that over 10% of revenue comes from upselling. Another 68% said that 10% of revenue came from cross-selling efforts.
I recommend tracking your upsell and cross-sell numbers, then use that data to figure out whether certain verticals respond well to certain product or service pitches.
Example: If reps have good luck selling Feature X to clients with Product Package Y six months into their relationship with you — this might be a worthwhile milestone to add to your sales process.
6. Sales Cycle Length
Sales cycle length is the average length of time it takes to close a deal, from initial lead interest to contract or purchase. Today’s B2B sales cycles involve six decision-makers, two to four touchpoints, and deal cycles topping 117 days. When sales cycles are too long, it may be an indication that:
- Your reps aren’t qualifying leads properly, and their funnel has too many low-intent leads.
- Prospects or customers aren’t convinced of the value of your products and services based on what they’ve seen and heard.
- Your salespeople aren’t following up on leads as often as they should.
- The sales rep isn’t in contact with the decision maker, or the contact they are working with doesn’t have enough influence over the decision-making process.
- A competitor has captured the prospect’s attention more effectively than you.
A shorter sales cycle typically means more deals closed per quarter, higher revenue, and lower sales costs. Here are a few tips to optimize your sales cycles:
- Implement lead scoring and qualification tools and processes to reduce time on low-quality leads.
- Use AI workflows and automations to schedule meetings faster, send follow-up emails, and personalize enablement content. 79% of sellers report that AI and automation make sales cycles more productive and efficient.
- Create personalized presentations and content for different industries and personas.
- Define your ideal customer profile (ICP) so reps prioritize leads with higher likelihood of buying. Suggest approaches for clients that don’t meet your ICP criteria.
- Educate your sales team on competitive tactics, differentiators, and signal words to learn when a competitor has engaged your prospect.
Pro tip: For B2B sales, I like to compare sales cycle length between individual reps. Are some reps closing in three weeks while others are closing in six? Ask the top-performing reps to mentor struggling ones or share best practices.
7. Close Ratio
Your close ratio measures how efficiently a salesperson or team is closing deals based on the leads they‘ve worked. You might have a low close ratio if you have plenty of leads flowing in from events, campaigns, and other channels, but that isn’t translating into deals.
It might help to address close ratio challenges by automating follow-ups or using a lead scoring tool to better target prospects. Or, you may need to adopt better sales enablement tools, such as competitive playbooks, price configurators, or proposal templates.
Try measuring your close ratio on a monthly and quarterly basis. Hold debrief calls or send rep surveys to identify what’s eroding your close ratio numbers.
I remember when I was selling software early in my career, a competitor’s solution had a feature that ours lacked. The competitor encouraged prospects to ask about that feature even if they didn’t need it, because it was a feature that was missing from the home screen of our solution. It was an objection intended to derail a demo just as it began, and it often did until the feature was finally available. Encourage your reps to bring forward common features or value gap objections like this, and coach them on how to overcome them.
How to calculate your close rate: Divide the number of actual closed deals by the number of lead opportunities the salesperson had during a given time period.
8. New Leads
If your deals aren’t closing at a sustainable rate, it’s helpful to start at the beginning and see if your team has enough new leads to meet your team’s pipeline coverage needs. I think the easiest way to do this is to implement a lead tracking system or use a CRM that allows you to capture and monitor leads, like HubSpot's Free Lead Management & Tracking Software.
Low lead generation may indicate that your outbound sales reps need better playbooks or scripts that concisely articulate your company’s value. I remember interviewing for a field sales position once where they showed me the promotional materials (or lack thereof) they had for supporting selling over the phone and door-to-door. I passed on the experience.
Aside from producing better sales enablement content, create opportunities for new outbound sales reps to shadow experienced ones, or create a training program for lead generation. Diversifying your tactics and outreach methods also helps — sales pros today say they get their highest-quality leads and highest response rates from social media.
Free Sales Metrics Calculator
A free, interactive template to calculate your sales KPIs.
- Average Deal Size
- Customer Acquisition Cost (CAC)
- Customer Lifetime Value (CLV)
- And more!
Download Free
All fields are required.
9. Product Demos
A product demo is a key moment in the sales cycle where you have your prospect’s undivided attention to showcase what your product can do. These can be self-service through recordings or 1:1 with a sales rep. Tracking the number of product demos delivered, which type they are, and your demo-to-close conversion rate is useful for companies in industries like SaaS.
Based on my experience selling software, the highest impact demos for moving sales along the pipeline are those where a prospect has a defined set of features they want to see, so you can enrich the demo environment with similar test data to mimic what the customer works with on a daily basis. The more engaged a prospect is in seeing a tailored demo with a defined set of requirements, the higher their buying intent, at least for the prospects I’ve worked with.
Pro tip: You can analyze recordings of demos with a tool like Gong to uncover key feature requests, common questions, and common objections.
10. Sales Revenue
Sales revenue, also known as just revenue or sales, refers to the total amount of money generated from sales of products or services within a given period. This is a crucial KPI to track as it directly reflects the effectiveness of your sales team and the overall success of your business.
It’s often measured per year (ARR) or per month (MRR). According to our research, 42% of teams prioritize annual recurring revenue (ARR) as their top metric, a sign of growing focus on sustainable sales revenue rather than one-off deals.
11. Sales Growth Rate
There’s no denying that sales growth rate is the foundation to any high-performing sales team. It’s a strong signal to your company’s overall health and position in your target market. I remember the excitement of years when I worked on teams with strong growth, and how meaningful my contributions felt when I closed a significant deal.
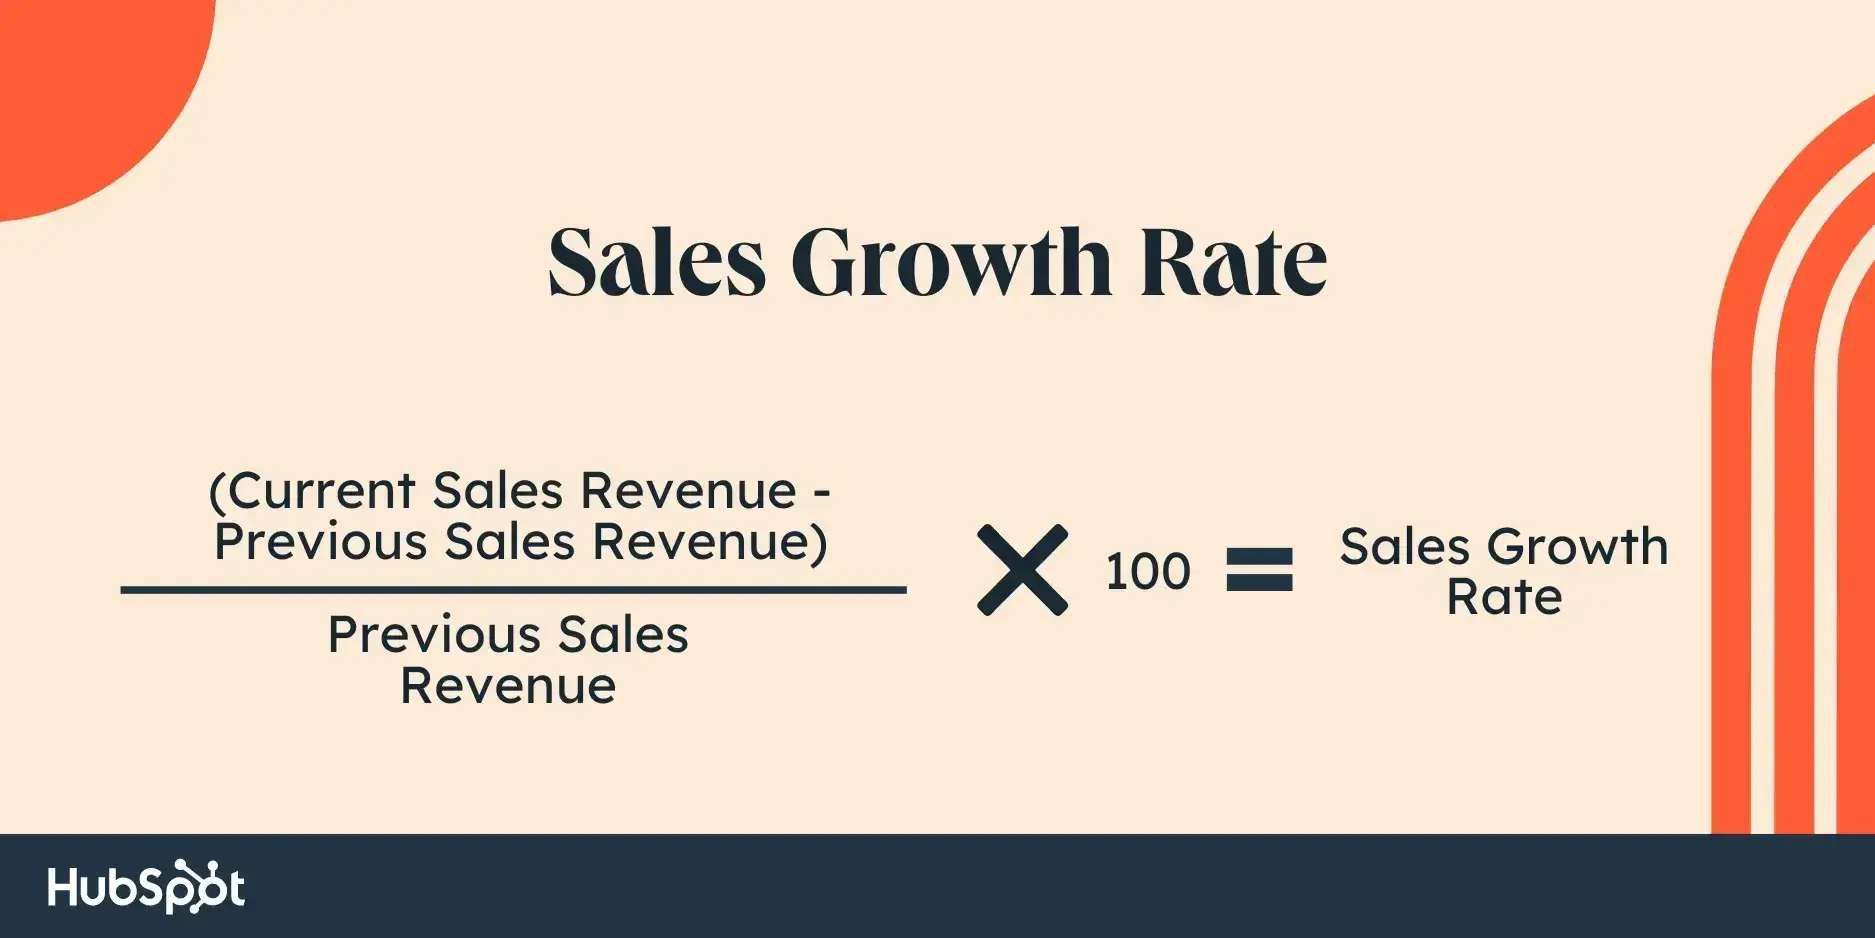
How to calculate: To calculate the sales growth rate, you would use the following formula:
(Current sales revenue - previous sales revenue)/Previous sales revenue X 100 = Sales growth rate
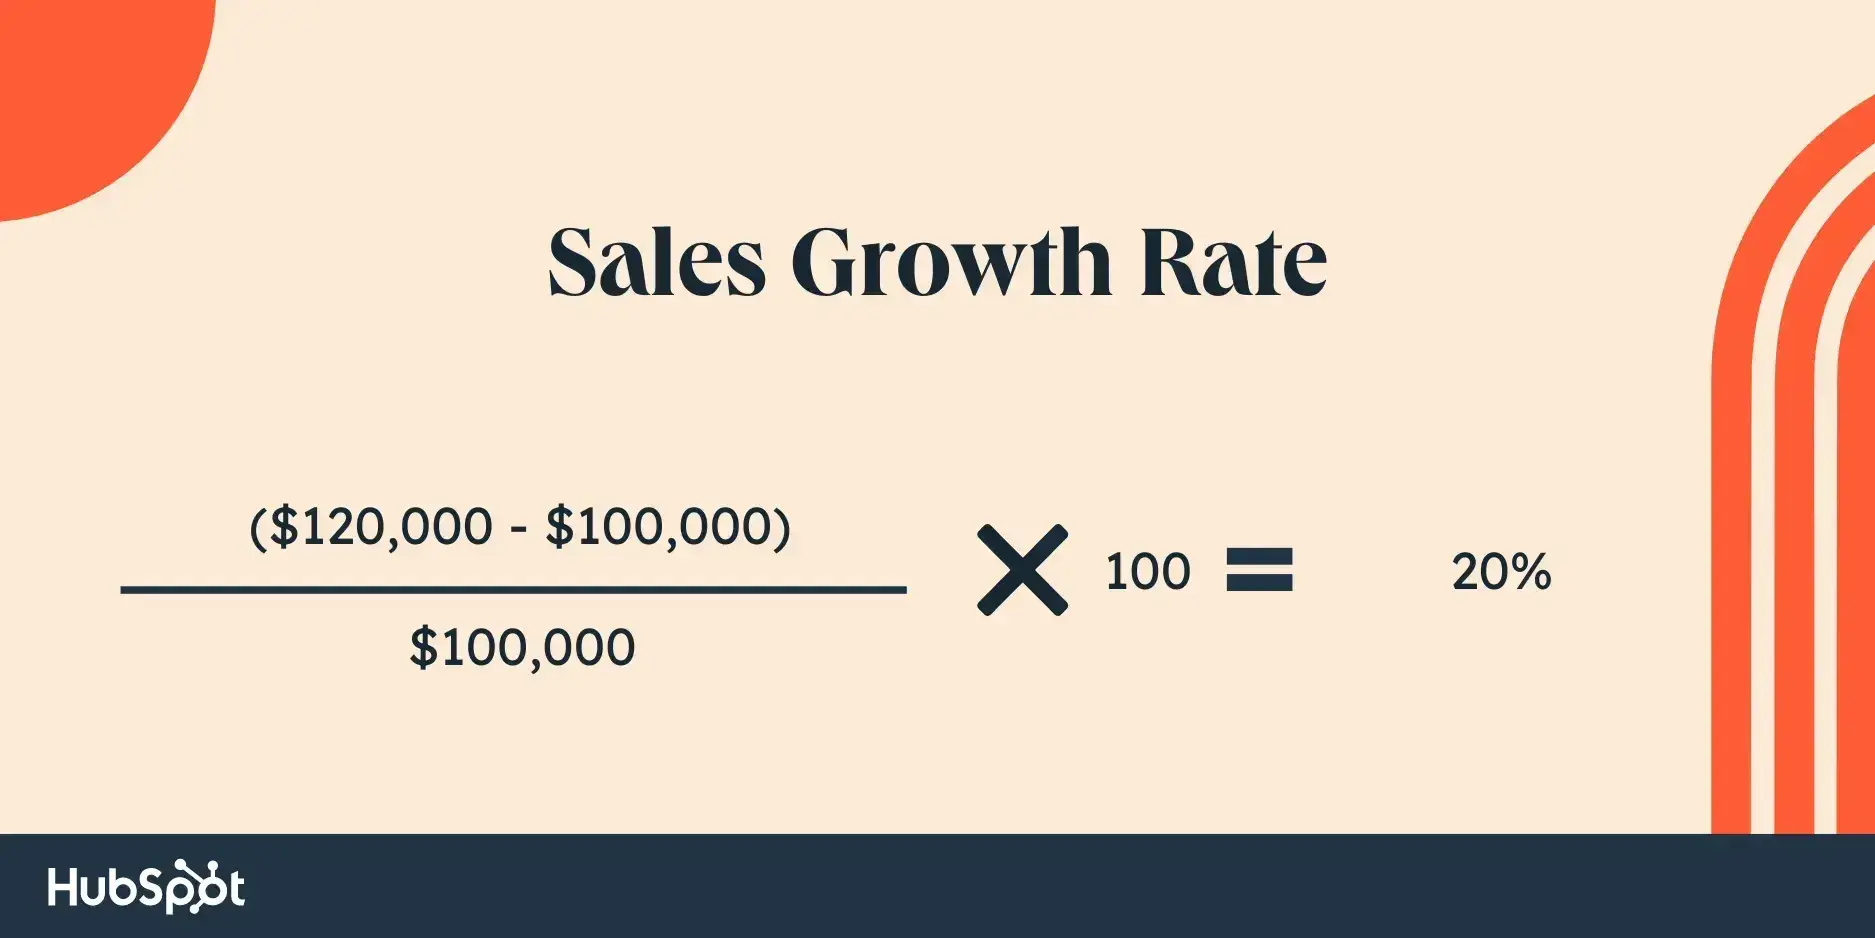
For example, if your company had $100,000 in sales revenue in the previous year and $120,000 in sales revenue in the current year, the sales growth rate would be calculated as:
($120,000 - $100,000)/$100,000 X 100 = 20%
Aside from offering in-demand products and services and providing great customer service, you can boost your company’s sales growth rate by:
- Focusing on your target customer and segmenting your marketing and sales strategies.
- Automating workflows where possible, such as follow-ups, outreach, and approvals to a defined value.
- Empowering salespeople by equipping them with the resources like slide decks, FAQs, case studies, playbooks, and demo scripts they need to impress customers. And equip field reps with quality hardware. I once tried to close my laptop at the end of a customer presentation, and the screen bezel popped off and flew in the air. Not the smooth departure I was hoping for on that snowy day.
- Create and share real-time dashboards with your team to keep them motivated and informed.
KPIs for Business Development Reps
Your business development representatives (BDRs) are actively prospecting, often using cold outreach methods. The examples of sales KPIs I collected below can help managers track BDR performance.
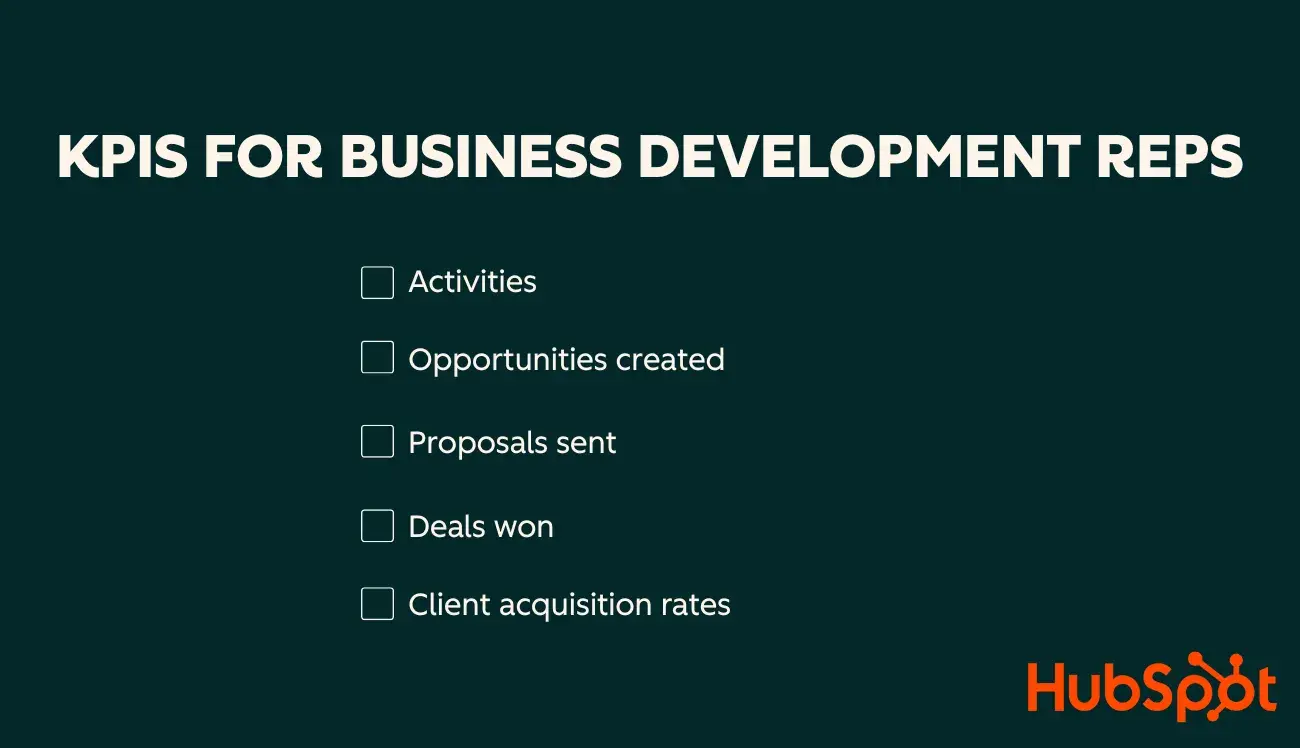
1. Activities
A sales activities report tells you the number of BDR sales activities each rep completed in a set amount of time. You could measure this through:
- Number of sales calls.
- Number of emails.
- Meetings scheduled.
I respect the activities report as it gives valuable information and a baseline for a sales manager to benchmark team productivity. However, it has its limits and doesn’t tell the whole story. Rather than looking only at the number of activities, I try to analyze the length and depth of a sales call, especially during cold call campaigns.
2. Opportunities Created
This is a metric that managers consistently monitor. Sales activity means nothing unless it results in tangible pipeline growth. For this reason, I’ve found productivity metrics, such as sales activities, are best compared to the number of opportunities created by the BDR.
You'll get insight into which activities are working best and which reps are generating the most results from their efforts, answering important questions like:
- How are your salespeople contributing to the expansion of your business in their given territory?
- Who's reaching their quota?
- What percentage of your team is hitting their number?
- Is the quota too high? Too low?
3. Proposals Sent
Whether the BDR nurtures the relationship themselves or hands a prospect to the account manager, the number of quotes or proposals sent can give you an indication if BDRs are prospecting to the right people and generating SQLs and opportunities that have genuine interest.
Pro tip: Customize your proposals for each prospect and tailor your content for different decision-makers. Track the number of views so you can gauge your prospect’s readiness to move forward.
4. Deals Won
While a BDR isn't responsible for closing business, you want to keep a pulse on how much new business results from your outbound efforts. This sales KPI example monitors the number of deals won per rep and across the rest of the team and can help you make sound decisions when budgeting and reinvesting in sales plays.
5. Client Acquisition Rates
Another commonly used measurement is the rate of client acquisition. This KPI simply measures the conversion rate of prospects to new clients as a percentage. You can look at this as a team number or for individual BDRs.
If there are large discrepancies between individual rates, I recommend that you dig deeper. Are lower-performing reps approaching bad-fit prospects? Is there something that over-performers do in sales meetings that others don't?
How to gather and use this data:
- Compare conversion rates to the number of prospects a rep reaches out to.
- If you find that conversions decrease after a certain number of touches, use that number as a benchmark to prevent your reps from getting burned out or stretched too thin.
- Use conversion rates to compare different outreach methods, such as emailing or cold calling, versus pursuing face-to-face interactions.
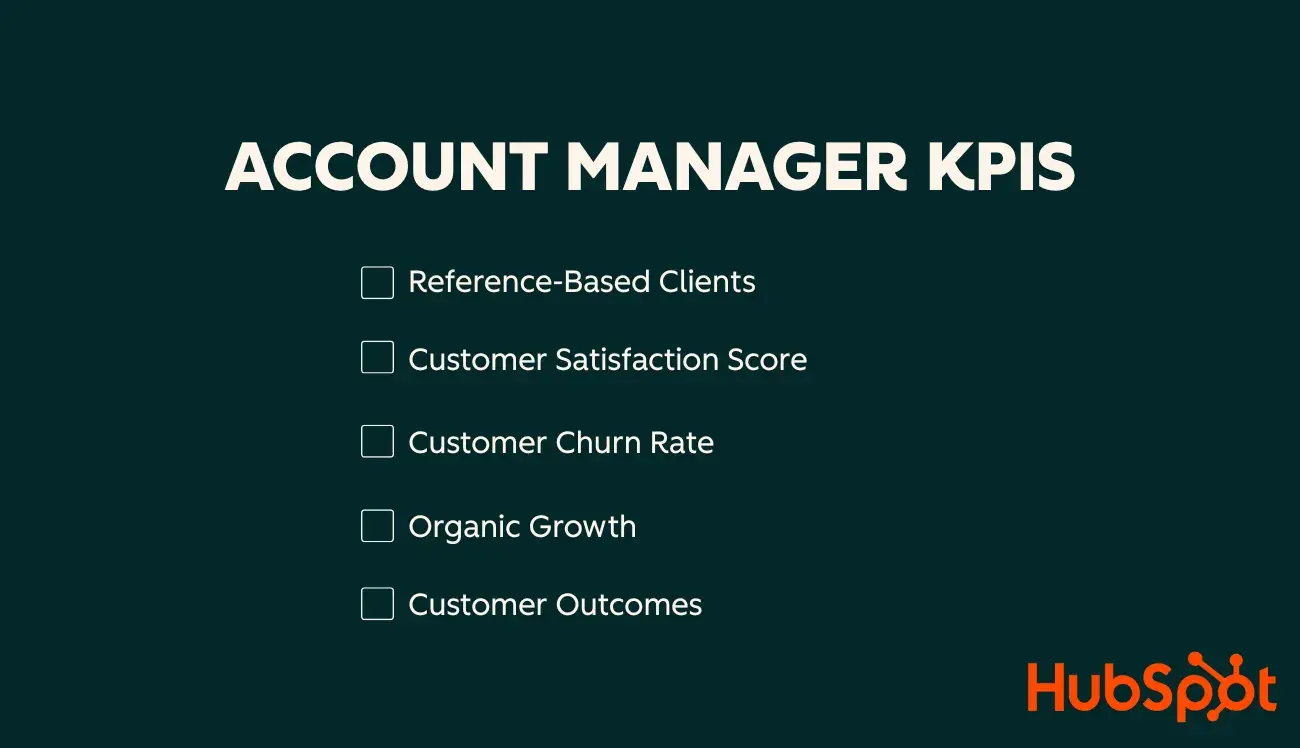
Account Manager KPIs
- Reference-based Clients
- Customer Satisfaction Score
- Customer Churn Rate
- Organic Growth
- Customer Outcomes
I worked as an account manager for a few years, and maintaining customer loyalty and minimizing churn were always important metrics to me. I often collaborated with our contract renewal teams to help them build business cases for customers to continue using our technology, and maintain any premium support plans they signed up for with their initial purchase.
If you’re only focused on sales and don’t pay attention to customer satisfaction and renewals, you could end up with a bunch of “churn-and-burn” business.
We’ve already covered a few KPIs relevant to account managers, like CLV, upsell, and cross-sell revenue. I also think it‘s smart to track the following account managers’ KPIs for sales.
1. Referral-based Clients
I love seeing what percentage of my team’s closed deals come from referrals. Not only does this point to the health of the company, but it helps me uncover if there are particular clients who are superstar advocates. Tracking referral-based clients allows your team to nurture these important customer relationships and amplify the voices of happy customers.
You can track this metric by:
- Starting a referral program with a tracking code or link that clients can share.
- Embedded surveys in your lead processing or onboarding journey.
- Track leads originating from customer referral campaign content.
2. Customer Satisfaction Score
Your customer satisfaction score asks customers to rank how satisfied they are on a scale from one to five (or on a scale of angry emoji to heart-eyes emoji):

This KPI is a popular alternative to the net promoter score. Instead of measuring how likely it is for a customer to recommend your product, it measures how pleased they are with your products, customer service, and more. I like that this sales KPI is easy to calculate and helps with a real-time analysis of customer sentiment. Just make sure the emojis are big enough to see on a mobile device. Otherwise, your customers might do as I did, and give a “Terrible” rating when they intended to give you a “Great” score.
3. Customer Churn Rate
As an account manager, another essential KPI is your customer churn rate. This metric is the percentage of customers who cancel or don't make another purchase during a specific time period.
While customer churn will always happen, high churn rates can be a sign of:
- Wrong product/market fit.
- Pricing objections.
- Poor customer experience.
Pro tip: Need help reducing customer churn? I suggest proactive communication, asking for feedback often, and leaning into your best customers to reduce customer churn.
4. Organic Growth
If your company is in a period of growth through mergers and acquisitions, it can be helpful to separate external growth from organic growth. Organic growth measures the increase in a company's sales or profits resulting solely from its own internal business activities. It’s generally more sustainable, repeatable, and scalable than external growth.
For most of my sales career, I worked for OpenText and IBM, companies that attribute much of their growth to acquisition. These companies are very different now than when I worked for them. They seem to be reprioritizing organic growth and related rates like lead-to-customer conversion, customer lifetime value, and churn reduction over revenue growth by acquisition of outside revenue streams.
How to measure: Organic growth rate = [(Current period revenue − previous period revenue) / Previous period revenue] ×100
5. Customer Outcomes
Customer outcomes measure how well your team is delivering on customer expectations. Some of these metrics are difficult to measure, and these KPIs may be a combination of qualitative and quantitative metrics.
Quantitative customer outcome KPIs can include:
- Revenue.
- Number of support tickets.
- Time on the platform.
- Number of subscriptions.
Qualitative customer outcome KPIs can include:
- Employee comments.
- Customer emails.
- Client testimonials.
This combination of KPIs will help you improve both customer outcomes and expectations.
KPIs for Sales Development Reps
While some of the sales KPI examples in the previous sections may also apply to your sales development representatives (SDRs), SDRs primarily respond to inbound leads. For this reason, you should be tracking their performance with these KPIs as well.
1. Average Response Time
This metric is the average time it takes an SDR to reply to a new lead. 82% of consumers say that an immediate (10 minutes or less) response to a marketing or sales question is important to them. The longer your response time, the lower their faith in you will be — and the higher the chance a competitor will find their ear.
If a lead fills out your form or is flagged as qualified by your marketing team, there’s no time to waste. I recommend always benchmarking response time and encouraging reps to improve it.
2. Percentage of Leads Followed Up With
Your SDRs should be making contact with all qualified leads. This metric can also give you insight into productivity, bandwidth, and task management.
Tip for sales managers: If leads are falling through the cracks, assume a neutral position before automatically faulting sales rep productivity. There could be an understandable (and easily addressed) issue sabotaging the pipeline, such as a hiccup with the intake form or a CRM malfunction.
Free Sales Metrics Calculator
A free, interactive template to calculate your sales KPIs.
- Average Deal Size
- Customer Acquisition Cost (CAC)
- Customer Lifetime Value (CLV)
- And more!
Download Free
All fields are required.
3. Positive vs. Negative Reply Rates
This KPI measures the ratio of favorable responses (interest, meetings booked, etc.) to rejections or no-interest replies. It’s fairly granular for B2B sales and can help you understand prospect sentiment.
This is measured at a prospect level, meaning all that matters is the total number of prospects contacted. However, many emails, calls, or other touches it took to contact them aren't reflected in the figure. The metric is expressed as a percentage, so if 50 prospects were contacted and three responded positively, the positive reply rate is 6%.
How SDRs should use this figure: Tag all positive replies and identify trends. This metric can reveal flaws and highlight benefits in aspects of your sales process like outreach cadence, prospecting approach, and channel preferences.
4. System Touches
How many touchpoints do your SDRs have with prospects throughout the sales journey? This can be a highly individual number depending on your industry and B2B vs. B2C, but it’s important to track and try to keep it low. 31% of salespeople say the number of sales touchpoints is increasing.
Typically, a low average number of touches means your sales team’s interactions are efficient, while a high number might mean your messaging or approach is less effective.
I recommend that managers analyze their most successful reps’ average touchpoints. Do their closed-won deals average three video meetings, eight emails, and four phone calls? Ask these reps to share their sales strategies, techniques, and advice to streamline your team's average, collective sales cycle.
How to measure: CRM data integration is essential to track this number. Automate tracking email, video, chat, demos, and social media touches to find the big picture.
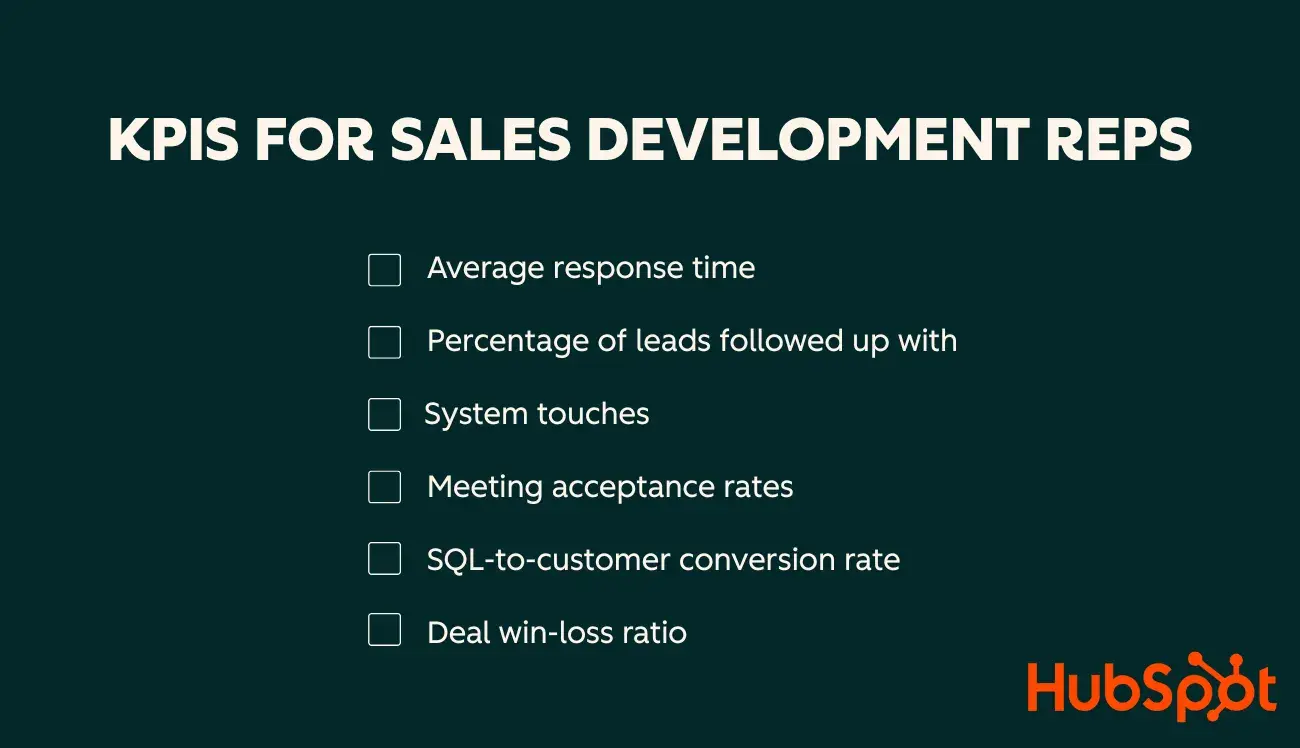
5. Meeting Acceptance Rates
Consistently landing appointment acceptances is a mark of an exceptional sales rep. Prospects often try to push meetings off, don’t take them seriously, or just stop responding. If an SDR lands meetings on a regular basis, it means they’re making their prospects prioritize your product or service in their schedules. I recommend using automation to personalize sales scripts and empower your team. 83% of sellers are using AI to personalize interactions, and 84% to optimize the sales process.
How to calculate this rate: Divide the number of meetings a rep schedules by the total number of replies they receive from prospects.
Pro tip: If this rate is low, try role-playing objections with your SDR to improve their efficacy. In a healthy sales organization, managers can keep an eye on overall health and see individual contribution so they can watch for risks or rock stars, shares Sara Lobkovich, principal consultant at Red Currant Collective.
“Leverage helpful data that can be automated as much as possible so that sellers can focus on selling, not on data quality and data management!”
6. SQL-to-Customer Conversion Rate
This KPI measures the percentage of sales-qualified leads that convert into paying customers — and it’s the ultimate test of lead quality and sales alignment.
Low conversion rates across the board can indicate an issue with your lead generation and qualification process.
A positive SQL-to-customer conversion rate requires strong campaign activity, like a targeted audience, personalized content, and inspiring events. I’ve found that cold calling from a spreadsheet alone simply won’t produce the results you want. Use a CRM platform that enables personalization and captures customer insights to create an inspiring pitch.
7. Deal Win-Loss Ratio
Win-loss rates are often beyond the control of individual SDRs, but can give a holistic picture of sales success. I was on a team once that monitored the team’s success rate at closing deals. Those numbers were part of a larger report for upper management, and less of a priority than meeting quota and the overall sales ratio for SDRs.
In my recent proposal developer role, my priority was to create proposals that were compliant with the customer’s (and our internal) standards. In the multi-channel organizations I’ve been a part of, pricing structure and deal win-loss was instructive for a higher level of management.
KPIs for Sales and Marketing to Track
- Percentage of Leads in Each Lifecycle Stage
- MQL-to-Customer Conversion Rate
- Average Length of Customer Lifecycle
- Volume of New Opportunities
- Cost per Lead
- Cost per Acquisition
- Customer Retention Rate
- Average Revenue per Account
- Net Promoter Score (NPS)
- Customer Lifetime Value (CLV)
For organizations with sales and marketing departments, it can be difficult to measure sales performance. After all, how do you know the handoff is successful? HubSpot’s research shows that marketing and sales alignment has increased in recent years, but a lack of alignment is still a major challenge for 19% of sellers. Ineffective communication and mismatched tools are two of the biggest challenges.
Here are KPIs that can help you analyze your performance across marketing and sales.
1. Percentage of Leads in Each Lifecycle Stage
If you break down leads by lifecycle stage (such as lead, marketing-qualified lead, SQL), you can try to diagnose pipeline issues between the departments.
Marketing is responsible for increasing the percentage of leads that make it to MQL. Sales qualifies these as SQLs and takes responsibility from there. But if sales isn’t getting enough leads or the right leads, sales numbers will be affected.
2. MQL-to-Customer Conversion Rate
This number measures the share of marketing-qualified leads (MQLs) that become paying customers. Both marketing and sales have a vested interest in this conversion rate — marketing because they supply the MQLs, and sales because they convert those into customers. Elevating this number should be a shared objective.
At IBM, my team was very focused on lead and sales attribution to various marketing campaigns. We used campaign codes or codewords to tie opportunities to the direct mail, web, TV, or event campaign that generated the lead. MQL-to-customer conversion was an important KPI because of the considerable investment IBM made in its marketing campaigns. It was a great learning experience about how sales and marketing teams can collaborate and share successes.
Pro tip: A high MQL-to-customer conversion rate means you’re bringing in high-quality leads. If you’re struggling to convert, work toward better marketing-sales alignment to understand your audience. HubSpot research found that when alignment rises, so does lead quality.
3. Average Length of Customer Lifecycle
The customer lifecycle refers to the different stages a customer goes through on their purchasing journey. This typically includes research (self-service, consuming marketing content), engagement, and closing. The average length of the customer lifecycle measures the typical length of time between first impression and first purchase.
The shorter your lifecycle, the better. A shorter cycle reduces acquisition costs and generates revenue more efficiently. Marketing and sales both have a stake in this lifecycle and can continue to iterate improvements to shorten it.
4. Volume of New Opportunities
To achieve alignment between sales and marketing teams, it’s important to track the volume of new opportunities. I define a sales opportunity as a qualified prospect who has a high probability of becoming a customer.
In my time as a sales leader, I saw many performance metrics driven among the sales teams that were actually counter-productive to achieving the company’s core goals. Marketing and sales must work together to qualify leads and create more opportunities.
5. Cost per Lead
Cost per lead (CPL) is the average marketing spend required to generate one lead. If your CPL is too high, you’ve burned cash before you’ve sold a thing.
This metric helps quantify the success of a marketing campaign by measuring how well leads are making their way from marketing to sales. The lower the cost per lead, the more effective the campaign is at bringing in leads for the sales team.
How to calculate: Divide the campaign budget by the number of leads acquired from the campaign.
6. Cost per Acquisition
From market research to deal closed, cost per acquisition measures the exact dollar amount that was spent to market to a new customer, walk them through the sales process, and welcome them on board.
By comparing this metric over time, your marketing and sales teams can learn what works and focus on those activities. In turn, the cost per acquisition should decrease, making both teams more efficient at closing new business.
“This sales KPI provides a clear vision of the ROI for acquiring a new customer,” shared Jayanti Katariya , CEO of Moon Invoice.
Pro tip: Compare cost per acquisition to customer lifetime value to understand the cost-benefit analysis of an acquisition over time.
7. Customer Retention Rate
Just because a customer signed a contract with your company doesn‘t mean you’re done earning their business. Customer retention measures how well a business retains its customers and their revenue over time.
While there are several ways you can measure customer retention, I think it's easier to have a single metric to review regularly. You can calculate a single number by measuring customer retention rate with this formula.
8. Average Revenue per Account
Understanding the average annual recurring revenue (ARR) or monthly recurring revenue (MRR) for an account can help you understand how much revenue you’re driving for your business. 42% of sales teams prioritize ARR as their top success metric.
Your sales team can also use this information to learn about your audiences and take an account-based selling approach to new prospects with similar business models to accounts with high average revenue.
9. Net Promoter Score
Your Net Promoter Score (NPS) is a measurement of how likely customers are to recommend your product or service to someone else.
The survey asks participants to rank the likelihood of a recommendation on a scale of 0-10. Their numerical ranking is divided into three categories:
- Promoters (9-10). They like you— they really like you. Not only will these customers likely renew, but they also won't hesitate to recommend you to friends or colleagues.
- Passives (7-8). They’re satisfied, but that's about it. Passives feel your product/service is the status quo.
- Detractors (0-6). They don’t like you — they really don't like you. Detractors will likely churn, might tell others to avoid doing business with you, and will do the most damage to your brand.
The cadence of the survey depends on your business and goals. As a general rule, start by sending an NPS every three to six months. To calculate your score, subtract the percentage of detractors from the percentage of promoters. You can also use this handy NPS formula.
Pro tip: Don’t send your survey too early to new customers; let them fall in love with you first!
10. Customer Lifetime Value (CLV)
Customer lifetime value indicates the total revenue a business can reasonably expect from a single customer account. It considers a customer’s revenue value, comparing that number to the predicted customer lifespan.
It's a crucial metric to figure out which customer segments or buyer personas will drive the most revenue for a company. The applications aren’t limited to accounting for broad portions of your customer base. The figure can also be used to gauge the value of individual accounts and, in turn, your account managers’ ability to engage existing clients.
Their ability to consistently offer value to their clients can be measured, in large part, by the value they offer back.
Sales KPI Template and Calculator
Free Resource: Sales Metrics Calculator
What are the top sales KPIs to measure?
I know these can be a lot of KPIs to keep track of, and by no means do you need to start measuring each of these next quarter. Below are the best sales metrics to track when you're first starting. All of these metrics can be calculated in this free template.
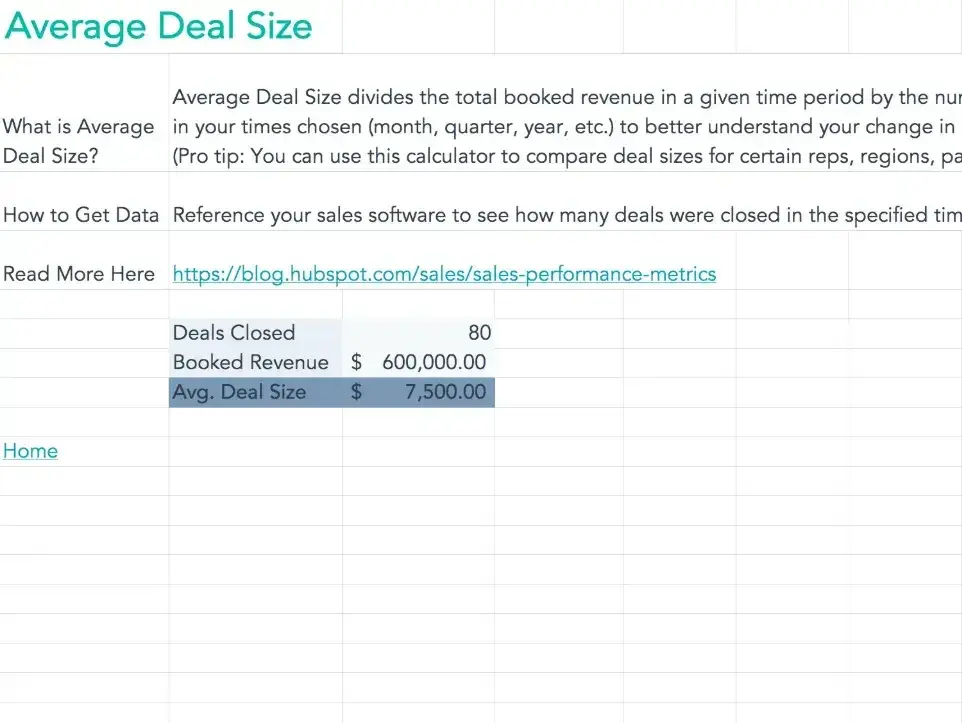
- Average deal size: Measure this metric when you first get started to set a benchmark for future goals.
- Win rate: Gauge how many closed-won deals your team is closing.
- Demo-close ratio: Accurately forecast your pipeline by understanding how many demos your sales reps are scheduling.
- Quota setting calculator: Know rather than guess what your team's quota should be next quarter.
- Commission calculator: Set up a fair and attainable compensation structure for your team.
- Customer acquisition cost (CAC): See how much it costs your business to bring a customer on board.
- Customer lifetime value (CLV): Determine the value that your customers will bring over the entire time that they do business with you.
- CAC-to-CLV: A ratio to determine how much it costs to bring a customer on versus the value they bring over time.
- Revenue by product: Understand which products bring in the most sales so your team can sell strategically to meet the customers’ and the business’s needs.
- Customer retention rate: Measure how many customers continue doing business with your company over time.
- Revenue churn: Measure how many customers stop doing business with your company over time.
- Employee turnover rate: Track how many employees leave the company in a given time period.
Track sales KPIs that matter.
What's your big takeaway from these sales KPIs? Mine is that no one is ever short of clues to help them optimize their sales pipeline. The more you know, the more you can improve. Manage your sales KPIs with our free calculator, and watch yourself grow better.
Editor's note: This post was originally published in June 2019, and has been updated for comprehensiveness.
Free Sales Metrics Calculator
A free, interactive template to calculate your sales KPIs.
- Average Deal Size
- Customer Acquisition Cost (CAC)
- Customer Lifetime Value (CLV)
- And more!
Download Free
All fields are required.
Sales Metrics


-Nov-05-2025-08-56-33-6007-PM.webp)
![Sales metrics: What to track, how to track, & why [expert tips]](https://53.fs1.hubspotusercontent-na1.net/hubfs/53/Sales-metrics-1-20251030-6874232.webp)


![Understanding Sales Variance [Formula + Examples]](https://53.fs1.hubspotusercontent-na1.net/hubfs/53/Sales%20Variance.png)