
Securing funding is a tall order for any business. If you're in the thick of that process, you need to have a grasp on some key metrics and sticking points — one of them being something known as your leverage ratio.
Here, we'll explore the concept a bit further, review some of the ratios that fall under the broader "leverage ratio" umbrella, see what a solid one looks like, and take a look at some examples.
Subscribe to "The Pipeline" — The Weekly 5-Minute Read to Help You Crush Quota
Skip to:
- What Is a Leverage Ratio?
- What's a Good Leverage Ratio?
- Types of Leverage Ratios
- Leverage Ratio Examples
Leverage Ratio
The term 'leverage ratio' refers to a set of ratios that highlight a business's financial leverage in terms of its assets, liabilities, and equity. They show how much of an organization's capital comes from debt — a solid indication of whether a business can make good on its financial obligations.
A higher financial leverage ratio indicates that a company is using debt to finance its assets and operations — often a telltale sign of a business that could be a risky bet for potential investors.
It can mean that earnings will be inconsistent, it could be a while before shareholders can see a meaningful return on their investment, or the business could soon be insolvent.
Creditors also rely on these metrics to determine whether they should extend credit to businesses. If a company's financial leverage ratio is excessive, it means they're allocating most of its cash flow to paying off debts and is more prone to defaulting on loans.
A lower financial leverage ratio is usually a mark of a financially responsible business with a steady revenue stream. Even if a company behind it is running significant debts, an exceptional financial leverage ratio tells potential shareholders and credit agencies that a business poses minimal risk and is likely worth an investment.
Simple Leverage Ratio: Debt-to-Asset
One of the simplest leverage ratios a business can measure is its debt-to-asset ratio. This ratio shows how much a company uses debt to finance its assets.
You can calculate this metric by dividing the total debt—both short-term and long-term, by total assets.
Debt-to-Asset Ratio = Total Debt (short term + long term)/Total Assets
With this measurement, you can better evaluate how financially stable a company is, and use this metric to compare other companies within the same industry. A high debt-to-asset ratio could mean a company is more at risk of defaulting on its loans.
What is a good financial leverage ratio?
An ideal financial leverage ratio varies by the type of ratio you're referencing. With some ratios — like the interest coverage ratio — higher figures are actually better. But for the most part, lower ratios tend to reflect higher-performing businesses.
For instance, with the debt-to-equity ratio — arguably the most prominent financial leverage equation — you want your ratio to be below 1.0. A ratio of 0.1 indicates that a business has virtually no debt relative to equity and a ratio of 1.0 means a company's debt and equity are equal. In most cases, a particularly sound one will fall between 0.1 and 0.5.
A ratio of 0.5 — an indication that a business has twice as many assets as it has liabilities — is considered to be on the higher boundary of desirable and relatively common. That said, what can be considered a "common" figure varies from case to case, according to factors like a company's scale, maturity, and industry.
What is a high leverage ratio?
What is considered a high leverage ratio will depend on what ratio you are measuring. For example, a total debt-to-assets ratio greater than 1 would be considered high – meaning a company has more liabilities than assets.
Similarly, a debt-to-equity ratio greater than 2 would also be considered high. Next, we’ll look into businesses where high leverage ratios are common.
Businesses With Higher Leverage Ratios
A typical startup often has to incur significant debts to get off the ground and allocate a significant portion of its cash flow to settle them — making for higher financial leverage ratios. Businesses with higher production costs also tend to run higher debt-to-equity ratios than most others.
Beyond that, certain industries lend themselves to higher average financial leverage ratios. In those cases, you can gauge the soundness of a company's financial leverage by comparing it to those of its competitors.
For example, businesses in capital-intensive industries — like oil and gas or telecommunications — often have to sink significant financial resources into infrastructure and maintenance, making for large investments that can inflate debt-to-equity figures.
How to Calculate Leverage Ratio
There are a few different types of leverage ratios that fall under the "financial leverage ratio" umbrella. Here's how to calculate some of them, using data found on your balance sheet or general ledger:
Types of Leverage Ratios
1. Operating Leverage Ratio
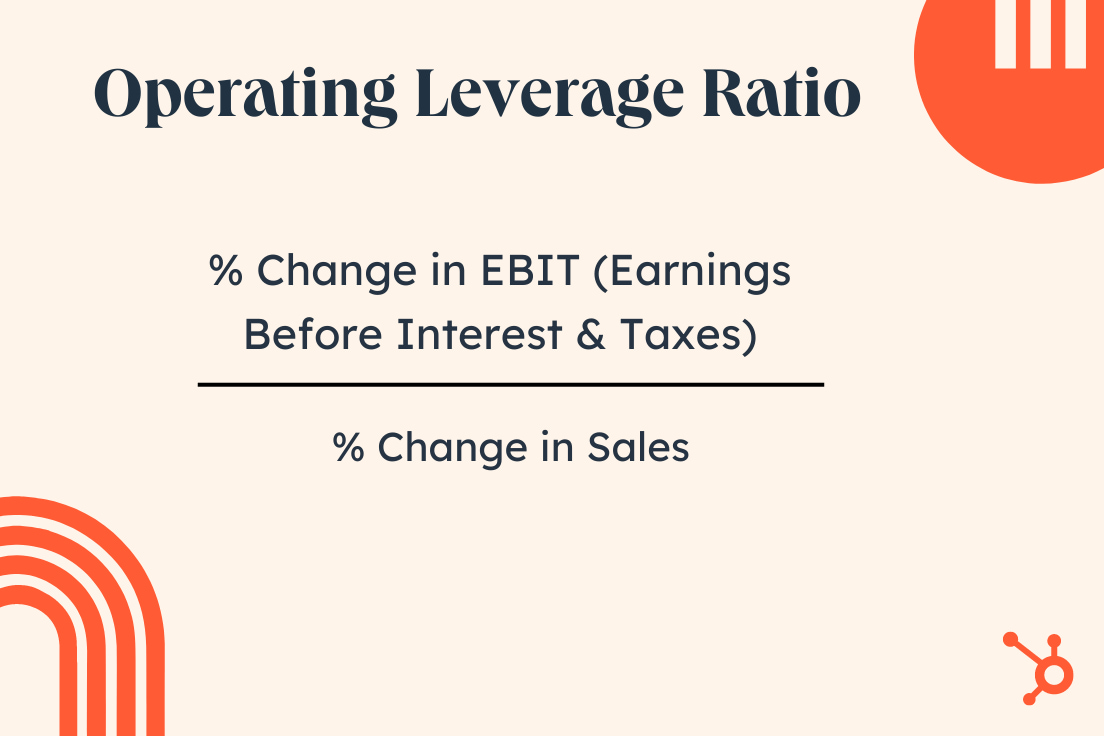
The operating leverage ratio measures the ratio of a business' contribution margin to its net operating income. It evaluates how much a business' income changes relative to changes in sales. It's calculated using the following formula:
Operating Leverage Ratio = % change in EBIT (earnings before interest and taxes) / % change in sales
2. Net Leverage Ratio
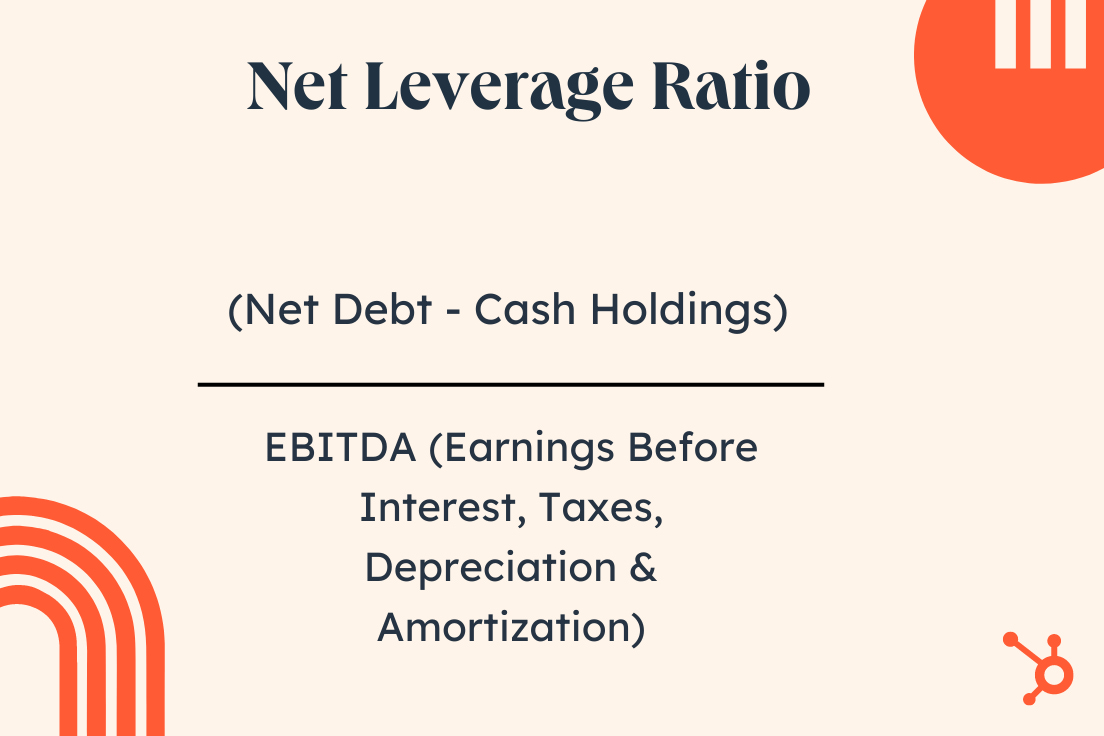
Net leverage ratio, or net debt to EBITDA (earnings before interest, taxes, depreciation, and amortization) measures the ratio of a business' debt to earnings. It reflects how long it would take a business to pay back its debt if debt and EBITDA were constant. It's calculated using the following formula:
Net Leverage Ratio = (Net Debt - Cash Holdings) / EBITDA
3. Debt-to-EBITDAX
Similar to the net leverage or debt-to-EBITDA ratio is the EBITDAX. EBITDAX is earnings before interest, taxes, depreciation, and amortization before exploration expenses. This ratio is primarily geared towards oil and gas companies that incur exploration expenses from researching locations to drill and costs of drilling. As such, these companies require lots of capital to cover labor, equipment, and other related costs.
This metric measures a company’s ability to generate income from its operations and service debts.
To calculate your EBITDAX:
EBITDAX = EBIT + Depreciation + Amortization + Exploration Expenses
4. Debt-to-Equity Ratio
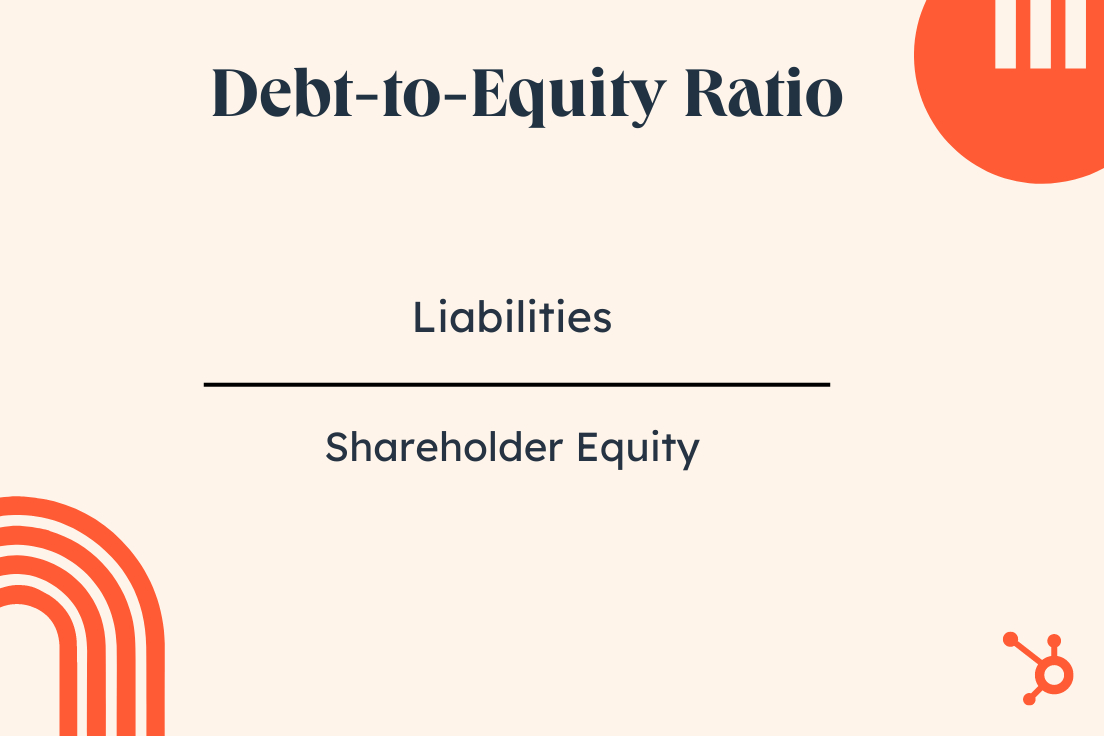
The debt-to-equity ratio measures the ratio of a business' total liabilities to its stockholders' equity. It offers an at-a-glance look at the value of a business relative to its debts. It's calculated using the following formula:
Debt-to-Equity Ratio = Liabilities / Stockholders' Equity
5. Debt-to-Capital Ratio
This metric is used to evaluate a company’s financial structure and how it’s financing its operations. In this case, it takes into account both short-and long-term debt, and capital refers to shareholder equity. You can calculate it with the following formula:
Debt-to-Capital Ratio = Debt/(Debt + Shareholders Equity)
6. Debt-to-Capitalization
Capitalization refers to the amount of money a company raises to purchase assets that they then use to drive a profit. A company can raise this money by using debt or selling stock to its shareholders.
The debt-to-capitalization ratio measures the amount of debt a company uses to finance its assets compared to the amount of equity used to finance its assets.
Debt-to-Capitalization Ratio = (Short-term Debt + Long-term Debt)/(Short-term Debt + Long-term Debt+ Shareholder Equity)
A high debt-to-capitalization ratio could indicate that a company has a higher risk of insolvency due to being over-leveraged.
7. Interest Coverage Ratio
One of the caveats of reviewing total debt liabilities for a company is that it doesn’t take into account the company’s ability to service or pay back its debts. This is an issue the interest coverage ratio fixes.
Interest Coverage Ratio = Operating Income/Interest Expenses
The interest coverage ratio demonstrates a company’s ability to make interest payments. Although it varies by industry, an interest coverage ratio of 3 and up is preferred.
8. Fixed-Charged Coverage Ratio
The fixed-charge coverage ratio measures how likely a company can pay its fixed charges from earnings before interest owed and taxes. Fixed charges can include lease payments, loan payments or any expense that is fixed or is the same payment amount each month. To calculate it, take the EBIT (earnings before interest and taxes) and divide it by the interest expense of long-term debt.
Simply put, the fixed-charges coverage ratio shows how many times a company can cover its predictable monthly financial obligations.
Financial Leverage Ratio Examples
Here are some examples of what financial leverage ratios can look like in practice.
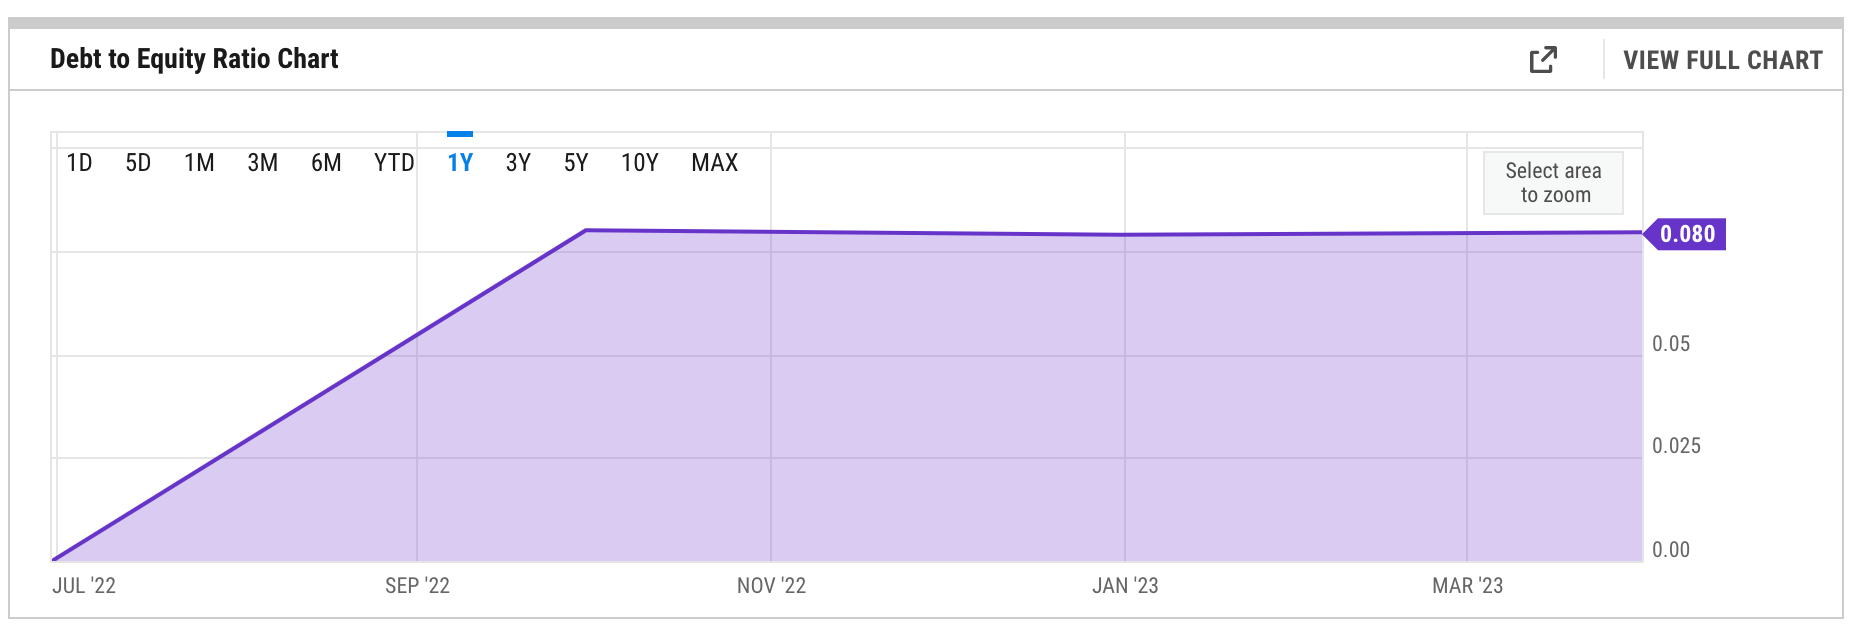
1. Meta’s 2023 Debt-to-Equity Ratio
As you can see from this chart, Meta has a debt-to-equity ratio of .080. As this ratio is under 1, Meta (Facebook’s and Instagram’s parent company) is in a pretty healthy state when it comes to managing its liabilities.
2. Apple's 2021 Debt-to-Equity Ratio
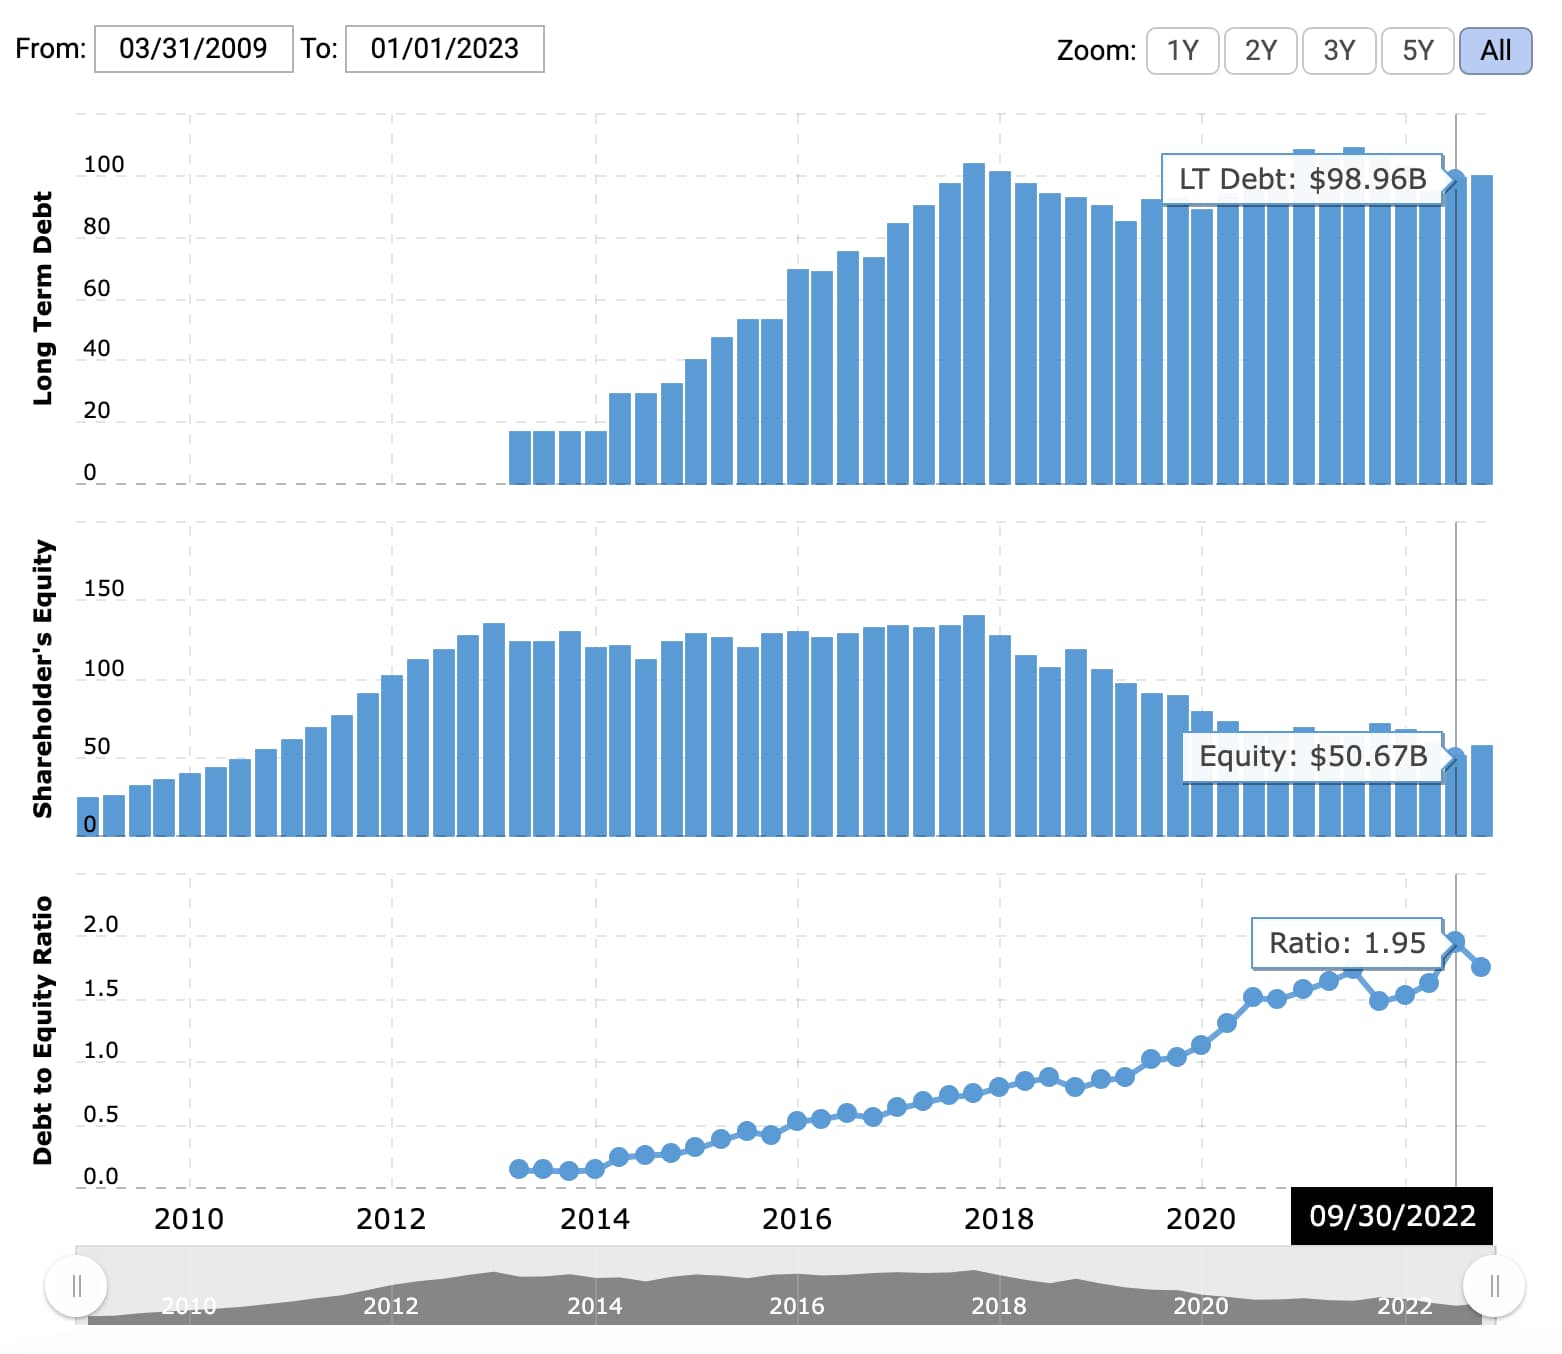
Though Apple's current debt-to-equity ratio is above 1.0, by no means is it unmanageable or alarming. Plus, it's Apple — shareholders probably aren't too worried about the company's liabilities getting out of control.
3. Verizon's 2015 Debt-to-Equity Ratio
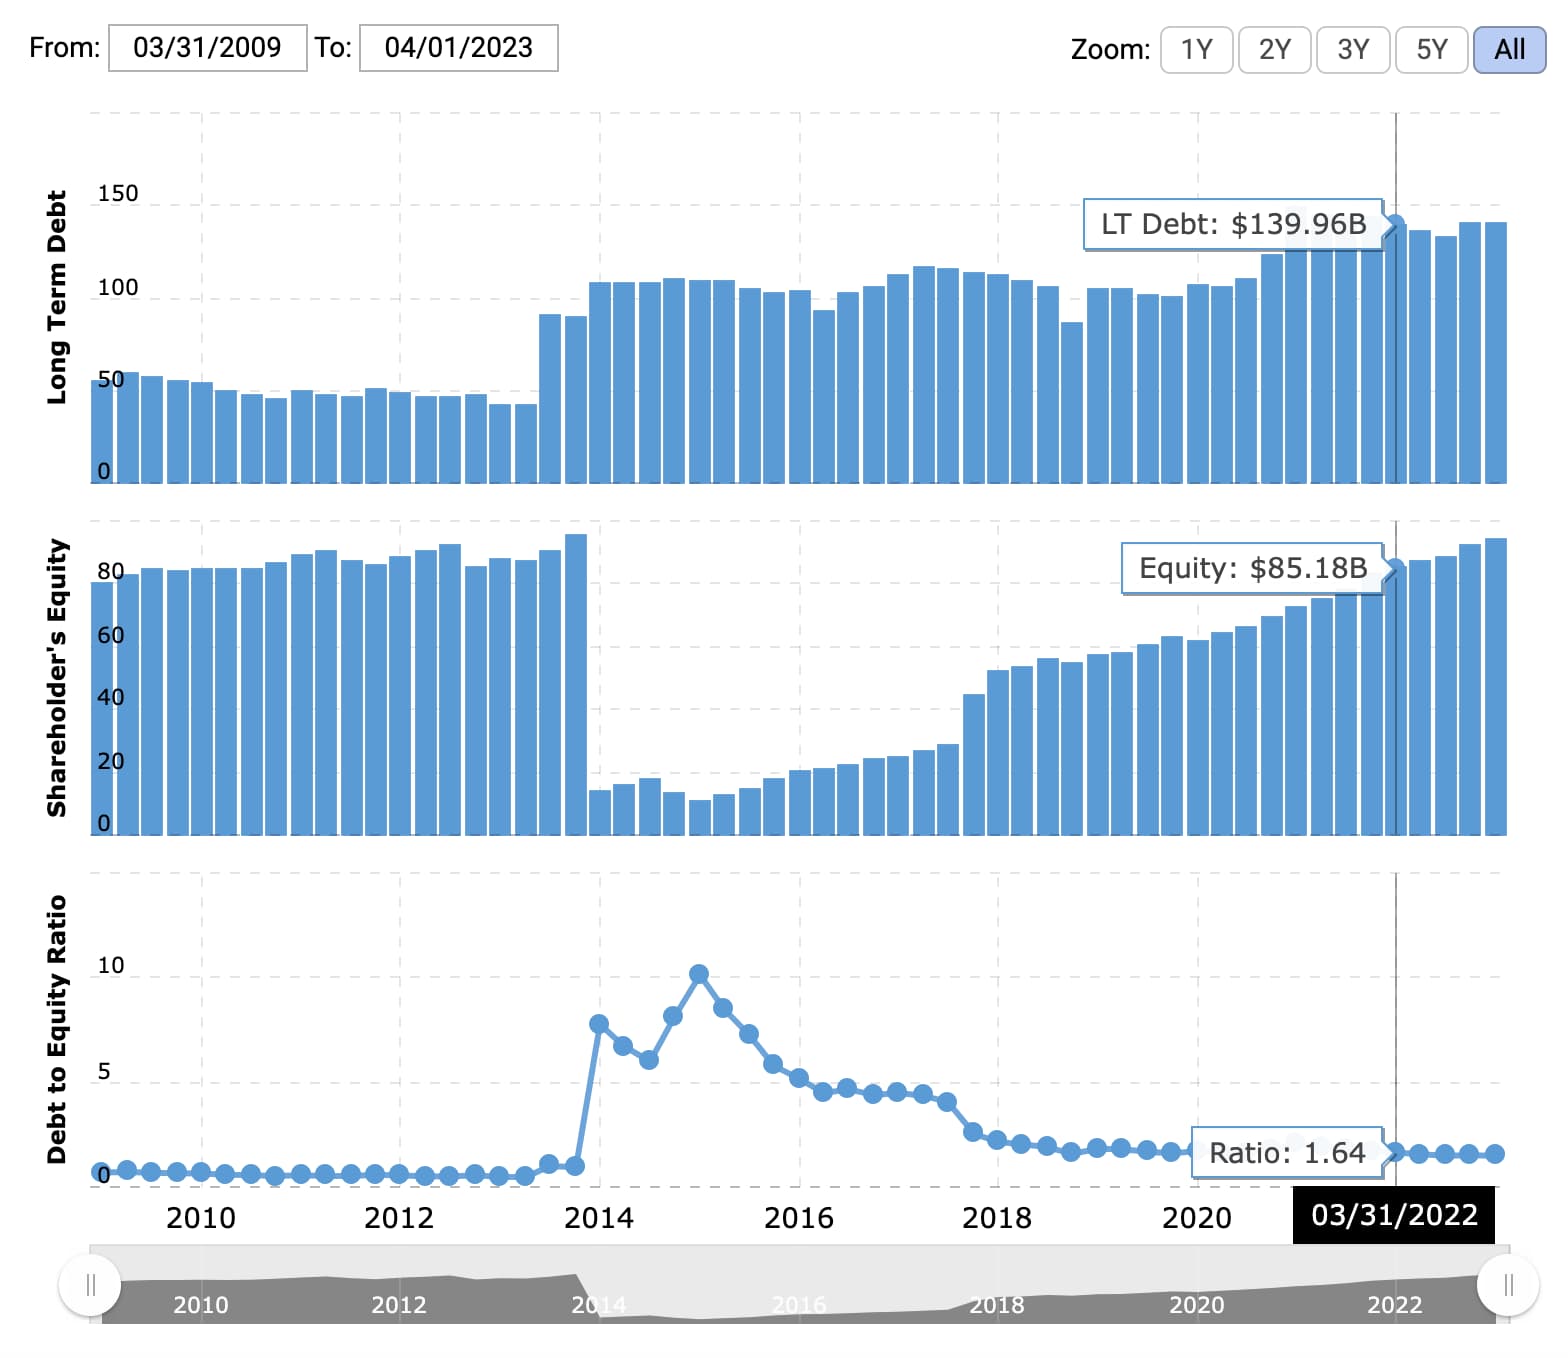
In 2015, Verizon made some sizable investments — including allocating $28 billion for spectrum licenses and capital for future network capacity — that took a significant initial toll on stockholders' equity while adding to its debt, leading to an inflated debt-to-equity ratio. However, once those investments started paying off, Verizon's financial leverage ratio leveled out and returned to a lower, more reassuring figure in 2022.
Leverage Ratios Diagnos Business Health
If you're looking to secure funding or just want a better understanding of how your business might fare going forward, it's important you have a grasp on your leverage ratios. These figures can be very telling into your company's health, potential, and ability to deliver on its financial obligations.
Editor's note: This post was originally published in November, 2018 and has been updated for comprehensiveness.

accounting


![Debt-to-Equity Ratio, Demystified [+Helpful Formulas]](https://53.fs1.hubspotusercontent-na1.net/hubfs/53/debt-to-equity-1-20250115-1477462.webp)