
Table of Contents
What is sales analytics?
Companies leverage predictive sales analytics to draw patterns from previous customers’ and leads’ behavior. This allows teams to predict future prospects’ business potential. Predictive sales analytics enable you to gauge future success and identify the most effective strategies for your sales efforts.
Automating the process draws from your historical data and the data you accrue continuously. The software gathers customers' behavioral trends. AI and machine learning to automatically translate your raw data into actionable predictions. The more you use the program, the more accurate predictions become.
Those predictions can help guide different aspects of your sales and marketing approaches. You can identify upselling opportunities, zero in on popular products, and improve your marketing messages.
Though predictive sales analytics programs are practical, they’re not necessarily the only means of running a sales data analysis. Here’s a step-by-step guide to help you through that process.
How to Run a Sales Data Analysis
1. Select who or what you want to analyze.
This one is pretty straightforward, but it’s still worth mentioning. You can’t run a sales data analysis if you don’t know what kind of sales data you’re interested in analyzing.
You’re going to want to understand your endgame from a high-level perspective. A sales data analysis can tell about product, department, team, campaign, or rep performance. Know who or what you’re trying to understand first, and go from there.
For example, if you're a sales manager in an e-commerce company, you should analyze the performance of your sales teams across different regions.
By focusing on the sales teams, you can gain insights into their effectiveness, identify strengths and weaknesses, and make data-driven decisions to enhance performance.
What we like: Understanding your endgame and determining who or what you want to analyze in your sales data is important. Clear focus can streamline your analysis efforts and uncover valuable insights specific to your objectives.
Best for: This step is ideal for businesses aiming to understand sales performance comprehensively. Targeted and meaningful insights can be achieved by defining the analysis scope, including product effectiveness, team performance, and campaign impact.
Pro tip: Choose relevant metrics like conversion rates, average deal size, or customer acquisition costs to gain deeper sales insights and measure success effectively. These key performance indicators (KPIs) drive data-driven decision-making and enhance your sales strategy.
2. Identify specific, measurable objectives.
Next, hone in on something definite and measurable. For example, let’s say you run a retail business and recently ran a month-long promotion where all your products were marked 30% off.
Now, you want to determine which of your sales products sold best relative to regular sales over a similar period. In this instance, you’d be interested in measuring product sales by unit for the campaign’s duration and another similar timeframe.
What we like: Analyzing the sales performance of specific sale products relative to regular sales allows you to identify the items that experienced the highest demand and generated the most revenue during the promotional period.
Best for: This step is particularly valuable for businesses recently conducting promotional campaigns, such as a month-long sale with discounted prices.
Pro tip: To ensure focused and aligned objectives for sales data analysis, set clear benchmarks and metrics. This enables effective tracking and evaluation of the success of your promotional campaigns, providing valuable insights to inform future strategies.
3. Determine how frequently you want to analyze your sales data.
The frequency at which you review data will vary depending on the nature of the analysis. You might want to measure data weekly, monthly, quarterly, or even daily.
Certain sales analytics reports will warrant ongoing monitoring for future reference. In our example, the report would rely on previous monthly data to provide a reference point for the siloed, month-long campaign.
For a retail business running a month-long marketing campaign, determining the frequency of sales data analysis is crucial.
By reviewing the data weekly during the campaign and comparing it to monthly data from previous periods, you can track its progress, identify trends, and make timely adjustments to maximize its effectiveness.
What we like: By establishing a consistent schedule for analyzing sales data, you can track performance over time and identify patterns or trends that may impact your sales strategy.
Best for: This step is ideal for businesses that want to establish a regular cadence for reviewing sales data. Whether you analyze data weekly, monthly, quarterly, or even daily, the frequency should align with your organization's reporting needs and goals.
Pro tip: Consider the balance between capturing meaningful insights and managing the volume of data. Choose a timeframe that aligns with your reporting needs and allows you to track performance over time effectively.
4. Compile your sales data manually or use sales analytics software on a rolling basis.
Manually compiling sales data is technically still possible. If you prefer that route, use Excel or Google Sheets spreadsheet software. However, CRMs and sales analytics software are more attractive options today.
A CRM can help expedite the process of accruing sales data. It allows you to track individual customer information quickly. Further, many offer resources for logging sales team performance.
A wide range of sales analytics software can help you get this done. We’ll review some popular options later.
What we like: Sales analytics software and CRMs offer convenient solutions for compiling sales data. They simplify the process and provide additional functionalities for analyzing and leveraging the data.
Best for: This step is highly beneficial for businesses seeking to optimize their sales data compilation process. Sales analytics software and CRMs are particularly valuable for organizations looking to automate data collection, improve accuracy, and gain deeper insights into sales performance.
Pro tip: To streamline the compilation of sales data, leverage a CRM that offers robust features for tracking customer information and sales team performance.
5. Leverage data visualization tools.
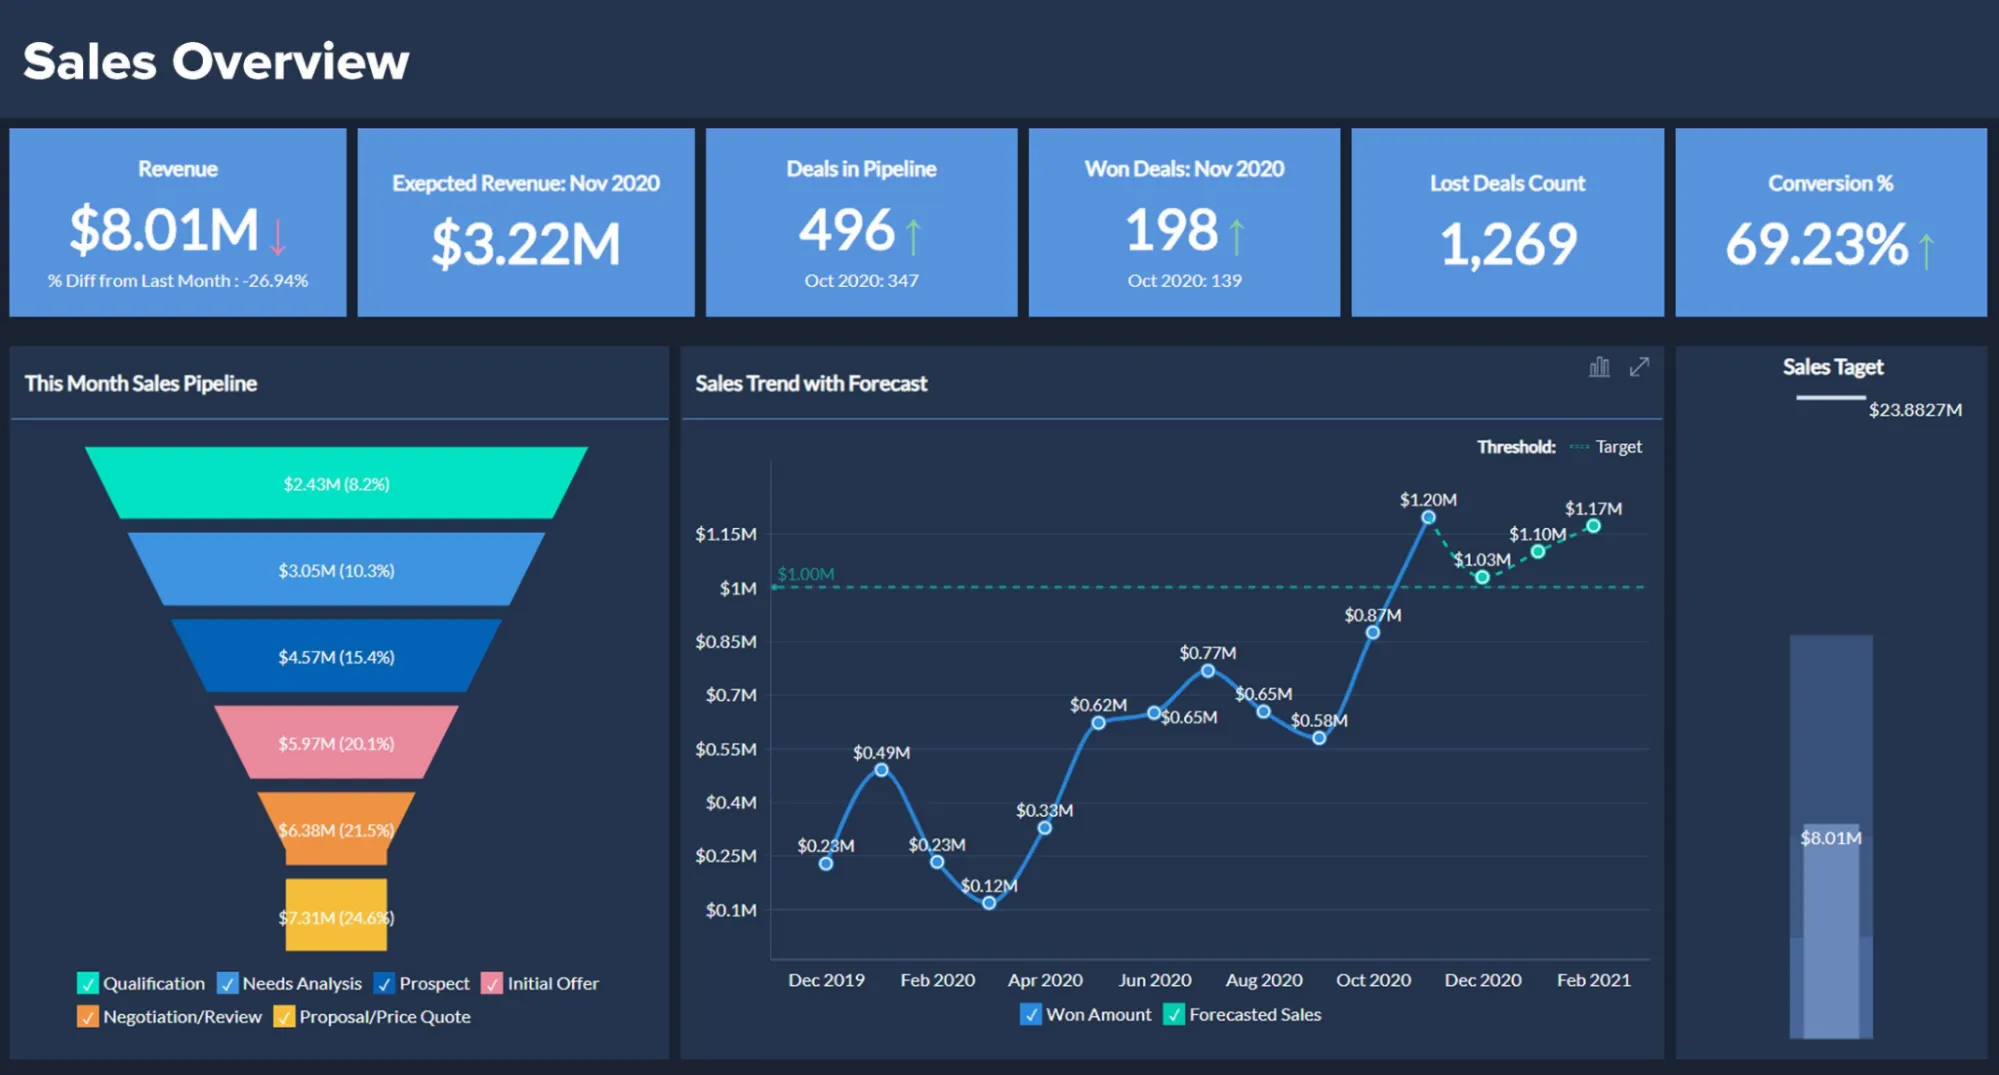
After compiling your data, create a sales analytics report. The above example shows one report that uses easy-to-understand charts and graphs.
Sales analytics software usually includes data visualization resources, allowing salespeople to make sense of sales data at any moment. Different sales reports include deal forecasting, sales activity, and deal pipeline analysis. HubSpot CRM gives you access to all these reports, custom reports, and more using the data collected in your CRM.
If you don’t have access to sales analytics reporting software or prefer to do it the old-fashioned way, you can create a sales analytics report using Excel or Google Sheets pivot tables.
Visualizing your sales data turns a complicated process into an easily digestible snapshot of the health of your sales. Incorporate visuals that allow anyone to make sense of what would otherwise be an imposing jumble of numbers.
What we like: Data visualization tools simplify sales data interpretation, enabling businesses to gain valuable insights and make informed decisions. Visual formats like charts and graphs enhance comprehension and promote effective organizational communication.
Best for: This step is ideal for businesses seeking to enhance their sales data analysis through visual representations. Data visualization tools are particularly beneficial for sales teams and individuals who prefer a visual approach to analyze deal forecasting, sales activity, and deal pipeline analysis.
Pro tip: Create visually appealing charts and graphs to communicate sales data effectively. Clear visuals help identify trends, patterns, and key insights, enhancing understanding of sales performance.
6. Analyze your data and look for trends.
Now, it’s time to analyze your findings. At this point, you will reference your measurable objectives to see how they held up against the metrics you tracked with your sales analytics software.
In our example, you would look for the specific sales by unit for each product during the campaign. Then, you would compare those figures to their counterparts in a similar, campaign-free time frame. After this comparison, you can draw conclusions about which products are most attractive to budget-conscious customers when placed on sale.
What we like: Analyzing sales data uncovers insights into customer preferences and product performance. By comparing campaign and non-campaign sales figures, businesses can identify budget-friendly products for optimized pricing and promotions, boosting sales and customer satisfaction.
Best for: This step is crucial for businesses seeking a deeper understanding of their sales performance and identifying key trends.
Pro tip: Focus on identifying trends that align with your measurable objectives. Look for patterns and insights to help you make informed decisions and optimize your sales strategies.
7. Apply your results.
Use your sales analytics data to shape your future sales efforts. Apply what you’ve learned to anticipate customer and prospect behavior better.
In our retail example, you might use the information about how your products fare with reduced pricing to selectively discount and promote the products that appeal most to deal-hungry prospects.
It might seem obvious, but it still warrants a spot on this list. Apply your analyses, and keep running them consistently to improve your sales efforts continually.
What we like: Applying the results of sales analytics enables businesses to take proactive steps to improve sales outcomes. Businesses can strategically discount and promote products by using data to inform decisions, maximizing their appeal to deal-seeking prospects.
Best for: This step is essential for businesses looking to leverage sales analytics to optimize their sales efforts. By applying the findings from data analysis, businesses can make informed decisions and tailor their approach to meet customer needs and preferences.
Pro tip: Apply your sales analytics data to drive future sales efforts. Utilize the insights gained to anticipate customer and prospect behavior more effectively, enabling targeted strategies and promotions.
8. Monitor and iterate based on your findings.
Based on your findings and analysis, make informed decisions and adjustments to your sales strategies, campaigns, pricing, product offerings, and more. Use the insights gained from your sales data analysis to optimize your sales efforts and drive better results.
Regularly revisit your objectives and metrics, and refine them if necessary. Adapt your analysis approach as your business evolves and new questions or challenges arise.
By constantly learning from your sales data and applying those learnings, you can continuously improve your sales performance and achieve your goals.
What we like: Monitoring and iterating based on your sales data analysis allows for ongoing improvement and optimization of your sales strategies. It ensures you stay aligned with your objectives and make data-driven decisions to drive better results.
Best for: This step is essential for businesses that want to improve their sales performance and stay competitive. It mainly benefits those who value data-driven decision-making and strive for continuous growth.
Pro tip: Establish a feedback loop between your sales analysis and team. Regularly communicate the insights gained from the analysis to your sales team and involve them in the process. Their frontline experience and feedback can provide valuable context and help refine your analysis approach.
Sales Analytics Software
Now that we’ve covered the steps of a sales analysis, let’s look at some of the best sales analytics software out there to help facilitate the process.
1. HubSpot Sales Hub
.webp)
Get Started with Sales Hub for Free
HubSpot Sales Hub contains a robust suite of sales analytics resources to create and maintain any kind of data report. The software has the tools to help you track deal forecasts, sales performance reports, and productivity logs — among several other key metrics.
One feature that sets HubSpot Sales Hub apart from other sales analytics platforms is its accessibility. It has a straightforward interface that reconciles powerful, practical functionality with ease of use. You can maintain multiple customizable dashboards that provide visibility into your sales analytics reports.
The platform's collaborative element makes it a solid fit for larger teams. Any dashboard you create contains customizable access privileges, so you can decide how many team members can view or rearrange your sales analytics reports.
What we love: With its tiered pricing structure and choices to suit companies of any size, HubSpot Sales Hub and its sales analytics features are worth considering — no matter the scale or nature of your business.
Pricing: HubSpot Sales Hub has a free option and paid plans starting as low as $45 per month — with higher-priced options to suit your business needs as they evolve and expand. It also features an enterprise-grade option for large businesses.
2. Power BI
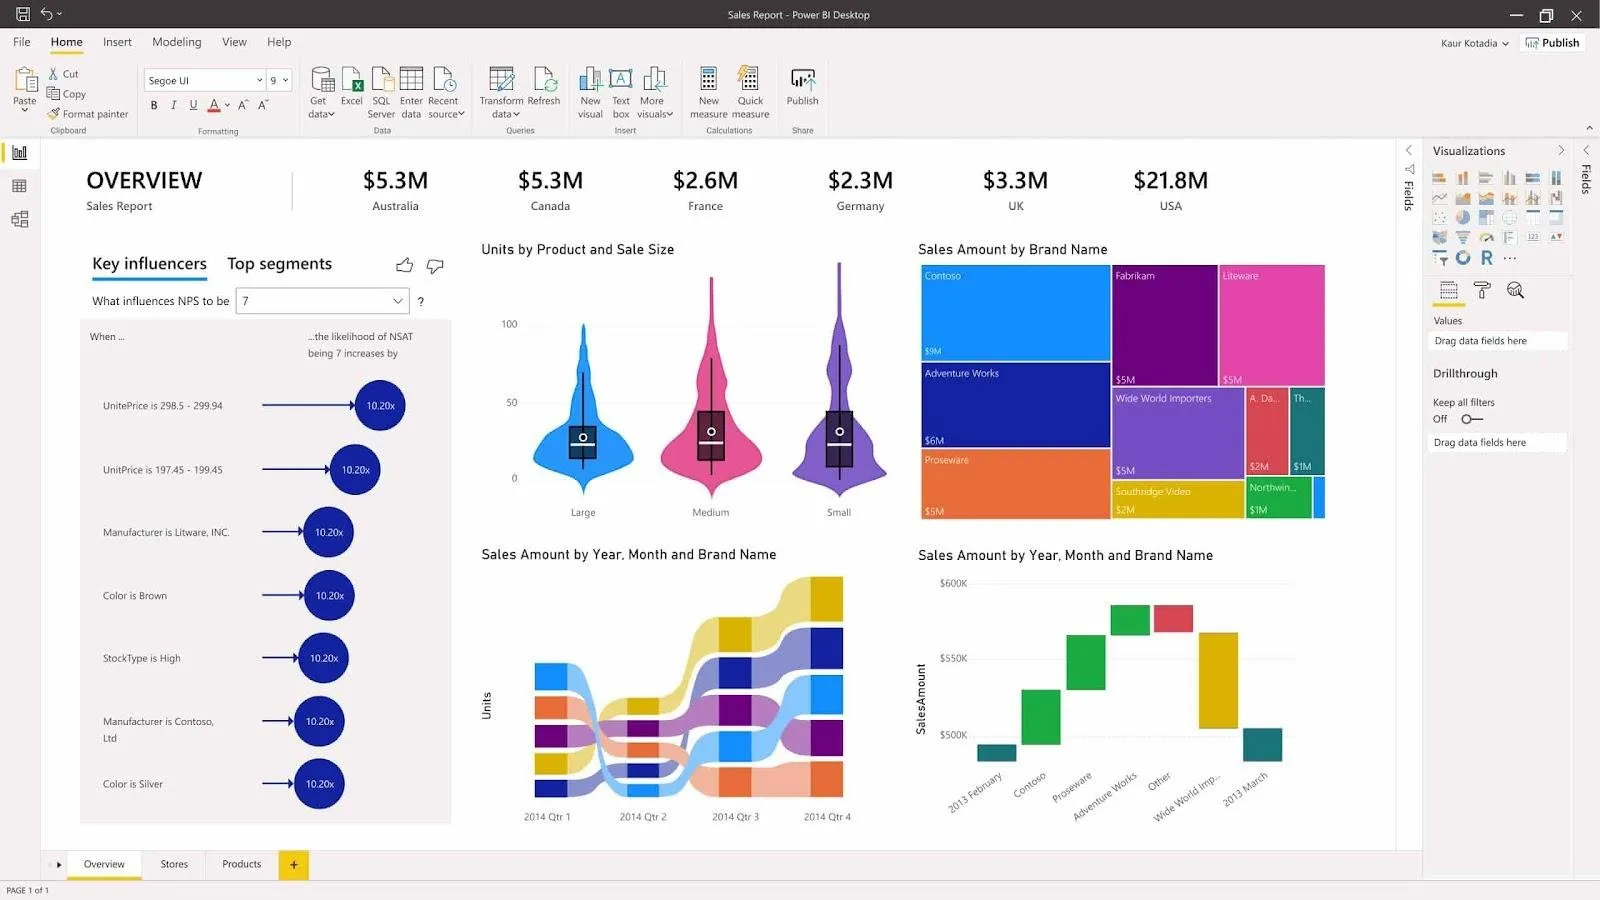
Power BI is a sales analytics software and data visualization resource from Microsoft. This comprehensive analytics solution scales from individual salespeople to your company. With this scope, you can use analytics data to inform smarter, more effective sales efforts from top to bottom.
What we love: The platform contains extensive, powerful analytics resources. Power BI provides hundreds of data visualization methods, built-in AI capabilities, well-structured Excel integration, and pre-built and custom data connectors. All features are backed and protected by an industry-leading security and data loss protection framework.
Pricing: The “Power BI Pro” plan starts at $9.99 per individual user, so it can suit the needs of smaller businesses as they expand. However, that plan is explicitly tailored for self-service business intelligence. More robust features come with its “Power BI Premium” plan — an enterprise-grade solution that starts at $4,995 per month.
3. MaxG
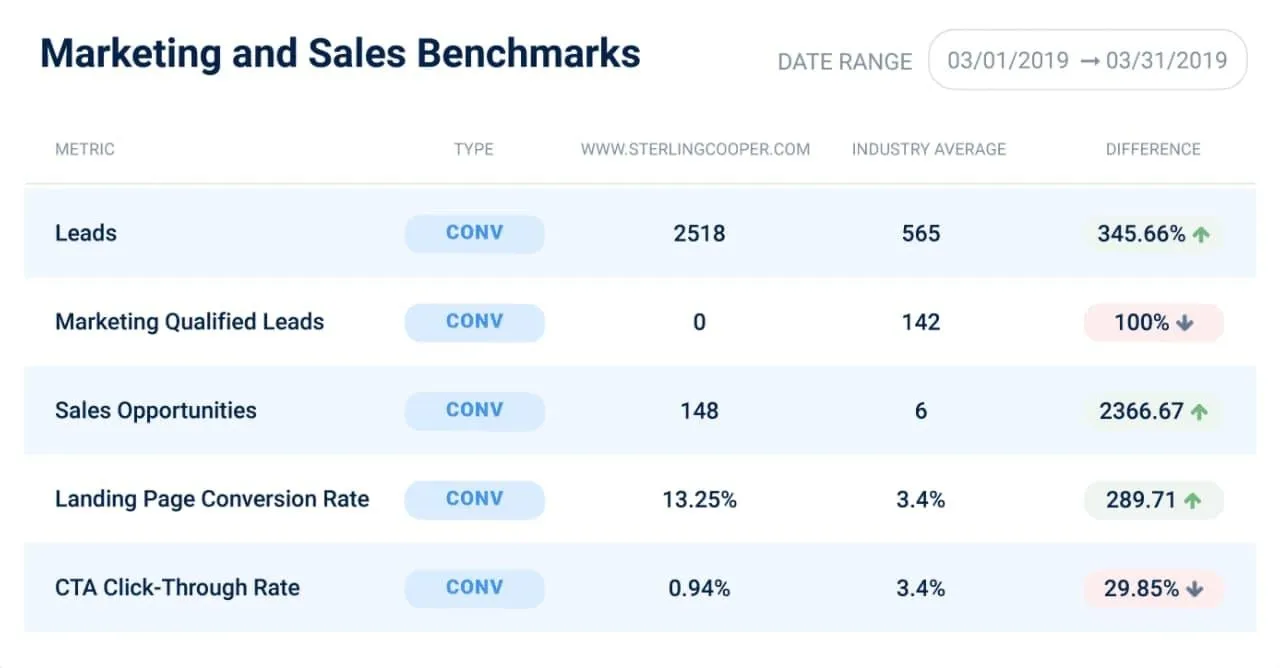
Image Source
MaxG is a product in a class of its own. This B2B sales and recommendation engine offers intelligent performance insights for your marketing efforts. With MaxG, you can see the efficacy of blogs and CTAs.
What we love: Via the power of AI, MaxG can translate general insights into actionable suggestions for improving your sales and marketing efforts. MaxG also contains an industry benchmarking feature that lets you compare your data to your competition.
Pricing: MaxG’s industry benchmarking tool is free, but access to the rest of its features starts at $49 per month. It also has an enterprise-level plan available for $499/month.
4. Zoho Analytics
.webp)
Zoho Analytics is a self-service business intelligence and data analytics software with extensive integrative capabilities. It is remarkably versatile and features attractive data visualization resources. The platform allows you to channel massive volumes of raw data into actionable, straightforward reports in an organized and sleek interface.
What we love: The platform is notable for its ability to blend vast amounts of data from various sources. If data is stored in multiple sources like HubSpot, Excel, and Google Cloud Storage, Zoho Analytics can easily combine them and translate that breadth of information into cross-functional reports.
Pricing: Zoho Analytics’ pricing structure features plans that suit businesses of any size. Its lowest-priced option costs $24 per month and comes with a comprehensive, dynamic range of features for up to two users. The remaining tiers are inexpensive and tailored to fit your business’s needs as it expands.
Several other sales analytics software are worth your consideration, including Databox, Grow.com, Plecto, Demand Sage, Domo, Dear Lucy, and Supermetrics. Finding the right tools for your business will hinge upon the resources you’re currently leveraging, the scale of your sales efforts, and which specific metrics and objectives you seek to measure.
Getting Started
Running a sales analysis can seem like an imposing, inaccessible undertaking, but it doesn’t have to be. With the right tools and a little guidance, the process can be simple, smooth, and incredibly useful when trying to improve your sales efforts.

Sales Metrics


![Sales metrics: What to track, how to track, & why [expert tips]](https://53.fs1.hubspotusercontent-na1.net/hubfs/53/Sales-metrics-1-20251030-6874232.webp)