.png?width=112&height=112&name=Image%20Hackathon%20%E2%80%93%20Vertical%20(85).png)
Introduction
At HubSpot we’ve made a few assumptions about our own data in the past, specifically, in regard to Net Promoter Score®, or NPS. NPS is a customer satisfaction benchmark that measures how likely your customers are to recommend you to a friend or colleague. Here’s what a typical NPS question might look like:
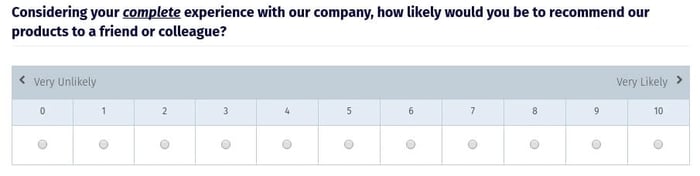 Image from QuestionPro.
If you are curious about NPS and would like to read more, check out this blog post.
At HubSpot, we use NPS to track customer satisfaction -- it is our North Star in ensuring we solve for the customer as a company. And we’ve discovered, along with many companies that operate globally and serve customers internationally, tracking NPS can get complicated. Customers in different countries seem to have strikingly different assessments of their experience. So, what in the world (literally) is going on here?
Assumptions HubSpot Made in the Past
When tackling the question of why there is a continual discrepancy between international and, in HubSpot’s case as a US-based company, US NPS, my peers and I have put together a few theories from our collective experience:
- Spanish and Brazilian Portuguese users are raising the overall average, as their survey participation rates are usually higher, and their scores tend to be much more enthusiastic than those of other languages.
- Many international customers are in markets where we’re new, and are thus “early adopters” of our technology category in general, and often highly enthusiastic about having it available compared to customers in the category of “mainstream” or “late adopters” would be
- Some markets, such as Japan, are notorious for having lower NPS scores no matter the company, in part due to the higher standard of customer service expected in the market
However, even the way the question is asked in certain markets, like Japan, might be leading people to answer differently than they otherwise would if the question were phrased differently. This led us to wonder, is it merely a matter of how we ask the question in each market?
We’ve also heard that in certain markets the likelihood of a literal interpretation can lead to a rating of “0” -- primarily because there is no “does not apply” option available to them. While this phenomenon might occur more often in other cultures, some Americans take this very literal approach to interpreting the question too. Other countries, like Germany, have the scale flipped, where the best possible score on a 1 to 10 scale is actually a 1.
What Others Say about Regional NPS Variance
I’m not the first to do some research on the topic, and the good news is… it’s not my imagination! There are quite a few cultural differences and other reasons that NPS scores tend to vary by region and language. Here are a few findings and references from some high-level research on the topic.
Satmetrix published a report showing that:
- Customers in Japan rate their customer satisfaction and loyalty lower than in most other countries.
- Customers in Latin American tend to rate their customer satisfaction and loyalty higher than in other regions.
- Customers in the Middle East tend to rate their customer satisfaction and loyalty higher than other European and Asian customers.
The advice of the lead author of the study is worth highlighting:
“Without a mechanism to distinguish true performance differences from cultural response bias, comparisons of survey results across countries or regions can lead to inaccurate results and compromise the ability of decision-makers to confidently act on the data,” said Dr. Laura Brooks, co-developer of Net Promoter and Vice President of research and consulting at Satmetrix.
“Companies that operate in multiple countries need to better understand how cultural factors influence customer survey responses, taking into account these differences when analyzing and acting on customer feedback.”
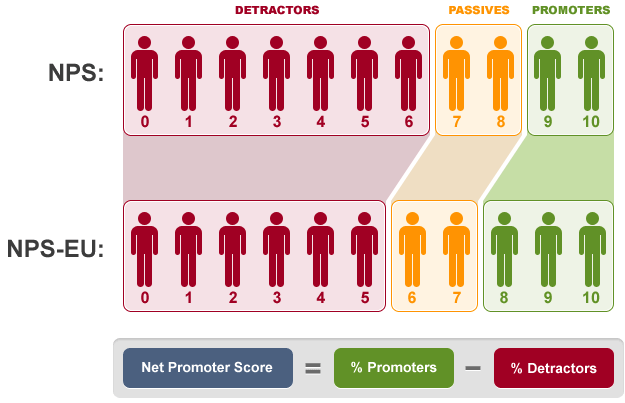
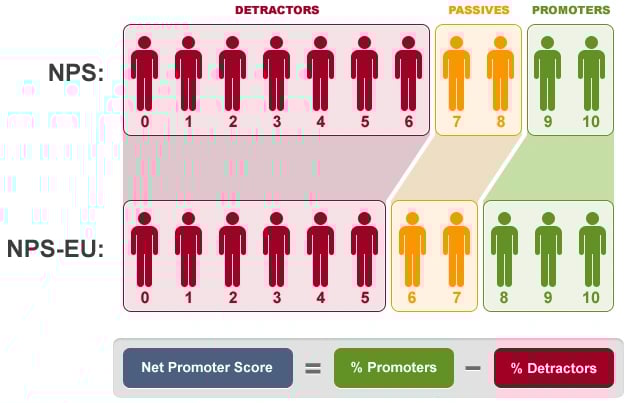
Here’s another interesting take, from an article with a Dutch perspective called, “Why There Needs to Be a European Variant of the Net Promoter Score”:
When Americans are asked to rate something on a scale of 0 to 10 they give more extreme responses as compared to their European counterparts. This scoring bias is deeply ingrained in the cultural differences between Europe and the US. American children are expected to get all A’s, even in high school. In Europe where tests are graded on a scale of 0 to 10, students can almost never get a ten. A teacher of my daughter once said that an 8 is great, a 9 is for geniuses and 10, well only God can get a 10.
When European respondents, growing up in such a school system, are confronted with a classic NPS scale of 0 to 10, they will – if extremely satisfied – give an 8 (a compliment in their mind). I see plenty of surveys conducted in Europe based on some American template where these respondents are then asked “What can we do to get a 9 or 10?” They inevitably respond with “Nothing, I love your company!” or “Nothing, it was the best service I ever had.”
In classic NPS scoring, the 8 from these respondents has no weight! They are ignored. That is why so many European companies have neutral NPS scores. What I propose is a European Net Promoter Score variant where an 8 also counts as a promoter and 6 as passive.
They even go so far as to show this visual as to how they might change it, by simply considering anyone with a score of “8” to the “promoters” bucket:
Another article showed how Typeform looked at not just the raw NPS, but also at “percentage of promoters” when reporting their regional variations.
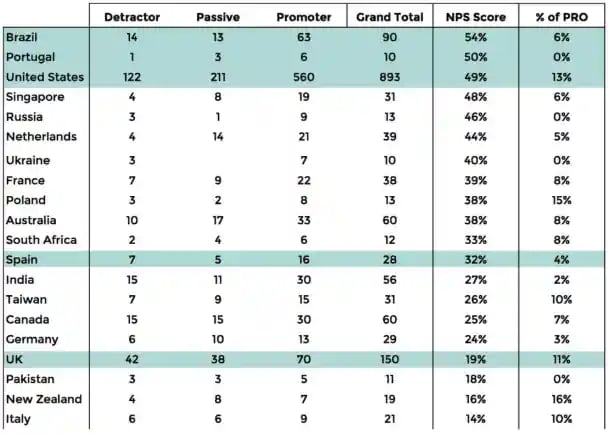
One could argue that metrics like “percentage of promoters” in each country (or even looking at the flip side, “percentage of detractors”) might be more valuable than looking at raw NPS scores in isolation, and perhaps less controversial than creating a “weighted” version of NPS or changing the actual NPS methodology by region as the prior article suggested.
And, one more snippet:
US customers tend to give higher ratings than just about anyone else. In Germany, customers tend to rate very conservatively, even if they are satisfied. In Japan, it is considered poor etiquette to rate any provider too highly or too poorly, regardless of their performance.
What can be done about it? The answer is straightforward: only compare scores within a country. Trying to compare across countries can be a frustrating and fruitless exercise. It is not likely to yield any useful insights. What does work is comparing results within a country and tracking how those results change over time. The only potential difficulty this poses is ensuring you have enough respondents in each country to provide robust insights.
Regional Differences Matter in the United States Too
When researching this topic, I came across this interesting NPS analysis across various regions of the United States.
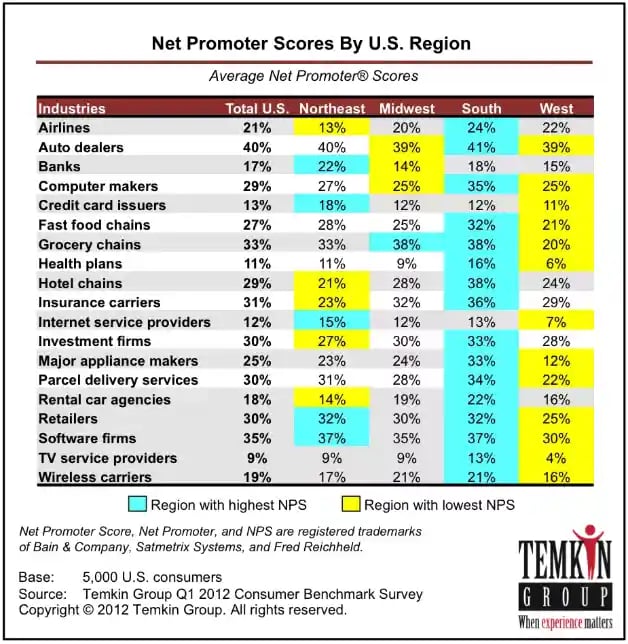 Source: Temkin Group
 Hailing from the Midwest, I nodded my head when I saw the “middle of the road” tendencies of the people from my native part of the country, as it tends to ring true to me culturally also. I also found it interesting that people in the South tended to rate companies higher in most industries, while folks out West seemed to rate companies less effusively. The Northeast is a mixed bag.
Takeaways: The Time is Now to Better Understand International Customers’ Needs
We certainly don’t have all the answers yet where NPS variations by region are concerned, but here are a few things to highlight for the time being:
- It’s good to be skeptical of data, especially local cuts of it. This is a good lesson to apply not just to NPS, but perhaps to other metrics too. There is often variance between regions and languages for a bunch of reasons. If you’re running any sort of global analysis and wondering why the data looks weird for some markets, there are likely good explanations behind it. Many of them are not cultural in nature, but might be more logistical in nature, such as “credit card decline rate is much higher in that country because we don’t accept their local currency,” and so on.
- You can still make good use of the NPS for international purposes. The guidance above about tracking variations within the same region or language is very helpful. For example, “Why the sudden dip in German NPS that month? Most likely concerns about GDPR.” It is also imperative to dive into the written responses to NPS questions with more rigor.
- What you learn here might tell you more about employee NPS variations too. Our own international employees at HubSpot are familiar with NPS and know how we use it for customers. It may be possible that cultural differences are tripping us up there as well, but we need to learn more before we can make any conclusions.
In 2019, the HubSpot team will continue to investigate the best ways to gather feedback from customers internationally. We'll publish our findings, so stay tuned!
--
® Net Promoter, Net Promoter System, Net Promoter Score, NPS and the NPS-related emoticons are registered trademarks of Bain & Company, Inc., Fred Reichheld and Satmetrix Systems, Inc.

![How I calculate net promoter score [formula & examples]](https://53.fs1.hubspotusercontent-na1.net/hubfs/53/%5BUse-Oct-14-2025-10-16-33-2257-PM.webp)


.jpg)