In a way, the job of web developers and designers is to convince users that a website is one singular entity, more than just a series of HTML elements formatted to look nice. With the right tools, however, even non-developers can peel back the curtain on any website to see what’s really happening behind the scenes.

![Streamline Your Coding: 25 HTML & CSS Hacks [Free Guide]](https://no-cache.hubspot.com/cta/default/53/848be230-f06a-420e-9a24-82b45fe61632.png)
You might be familiar with the classic “view page source” trick, which displays the raw HTML of a page in the browser window. But, there’s a better way to do your detective work: The inspect element feature lets us view and even modify any website’s front-end, which can be quite useful when building a website or learning how websites work.
In this post, we’ll discuss what it means to “inspect” page elements, and how to do so on three common web browsers. If you’re in a pinch, jump ahead to what you’re looking for.
- How to Inspect Elements in Chrome
- How to Inspect Elements in Safari
- How to Inspect Elements in Firefox
What does ‘inspect element’ mean?
Inspect element is a feature of modern web browsers that enables anyone to view and edit a website’s source code, including its HTML, CSS, JavaScript, and media files. When the source code is modified with the inspect tool, the changes are shown live inside the browser window.
Inspect is a web professional’s scout team. Developers, designers, and marketers frequently use it to peek inside any website (including their own) to preview content and style changes, fix bugs, or learn how a particular website is built. For instance, if you find an intriguing interface on a competing website, inspect element lets you see the HTML and CSS that make it up.
You can also think of your browser’s inspect feature as a “sandbox” of sorts: Play around with a web page as much as you want by changing content, colors, fonts, layouts, etc. When finished, just refresh the page to revert everything to normal. Inspect doesn’t change the website itself — only how it appears in your browser — so feel free to experiment!
Free Guide: 25 HTML & CSS Coding Hacks
Tangible tips and coding templates from experts to help you code better and faster.
- Coding to Convention
- Being Browser-Friendly
- Minimizing Bugs
- Optimizing Performance
Inspect is also an incredibly valuable tool for those learning web development. Instead of viewing plain source code, use inspect element to interact with the page and see how each line of code maps to an element or style. By better understanding what constitutes the typical web page, you can communicate effectively with developers in the case of an error, or if you want to make a change.
Inspect may be a “developer tool,” but you don’t need to write any code or install any additional software to use it. You can do everything I’ve described right inside your browser — let’s learn how.
How to Inspect Elements
To inspect elements you have to right-click any part of a webpage and click Inspect > Inspect Element. Alternatively, you can press Command+Option+i on your Mac or F12 on your PC to do the same.
Every modern web browser has a native tool for inspecting elements. It can be accessed in any browser, but some browsers like Chrome and Safari have slight differences. Let’s discuss how to use the inspect tool in three desktop web browsers: Google Chrome, Apple’s Safari, and Mozilla Firefox.
How To Inspect Elements in Chrome
Chrome comes with a handy developer tool that allows you to inspect individual elements. This allows you to see the code behind a webpage, and even edit it on your own browser. (Note that the changes are only visible to you, not to anyone else across the web.)
Here's how to get started:
1. Launch Chrome and navigate to the page you want to inspect.
To use the element inspector in Google Chrome, first navigate to any web page. In these examples, I’ll be using HubSpot.com.
2. Open up the Inspect panel.
Once you arrive at your desired page, you have several ways to open Chrome's Inspect tool.
- Option 1: Right-click any part of the page and choose Inspect. Right-clicking a specific page element will open that element in the inspector view.
- Option 2: In the top menu bar, select View > Developer > Developer Tools.
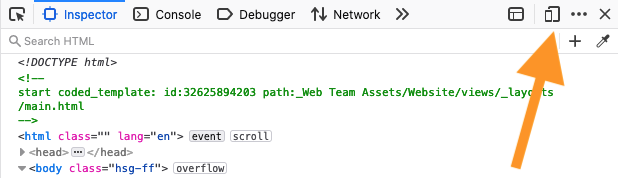
- Option 3: Click the three-dot icon in the top right corner of the browser window. From there, choose More Tools > Developer Tools. Then, click the Inspect tab in the popup.
- Option 4: Use the shortcut control-shift-C on Windows or command-option-C on macOS.
3. Change the location of the inspect panel.
To better view the code, you can change the position of the inspector window.
The Chrome Developer Tools panel will open at the bottom of the browser window, but sometimes it opens in a separate window altogether.
If you want to change the location of the panel, click the three-dots icon in the top right corner of the panel (next to the X icon), then choose your preferred dock position.
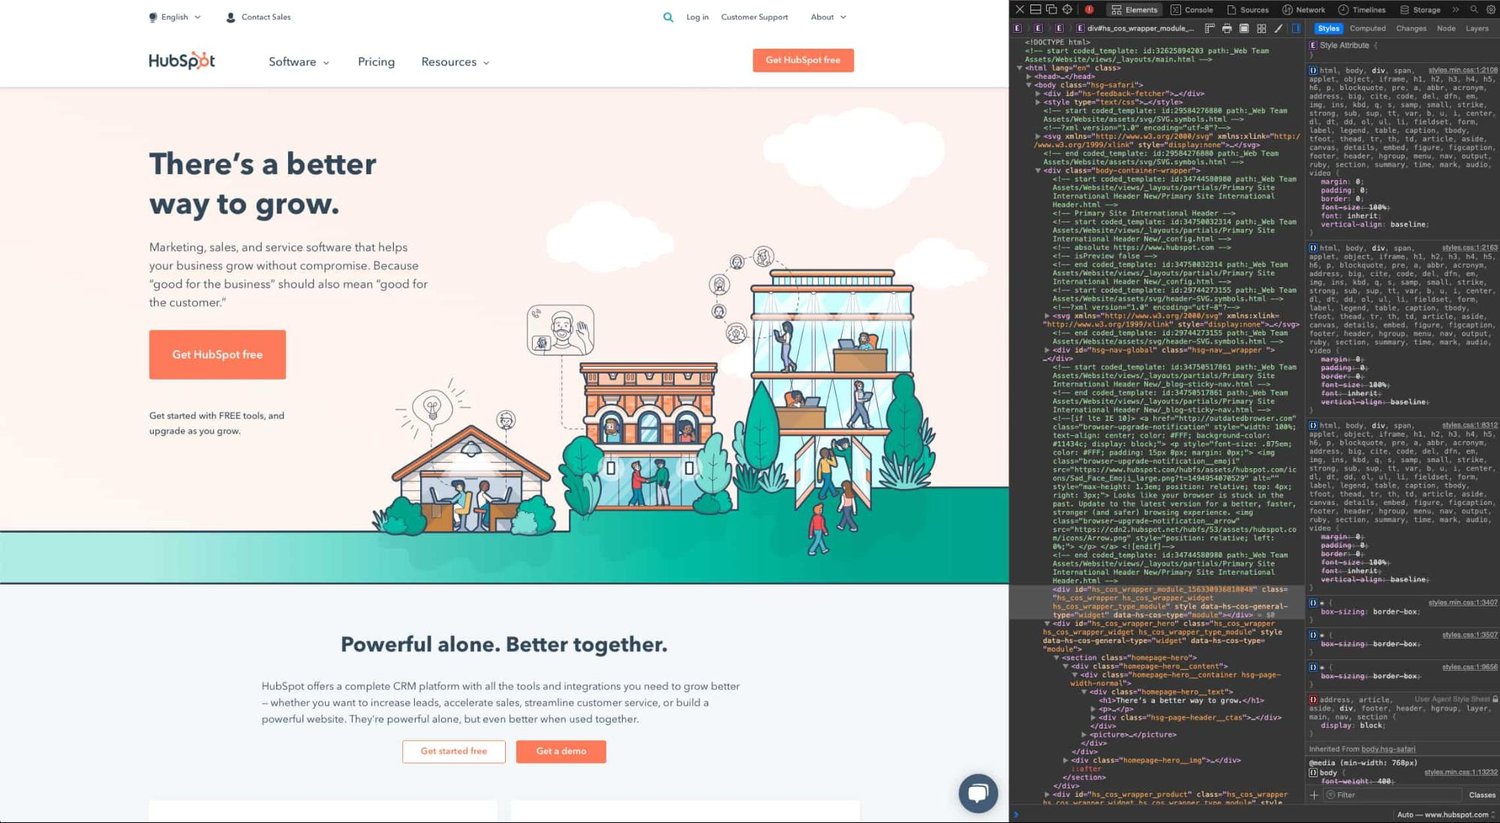
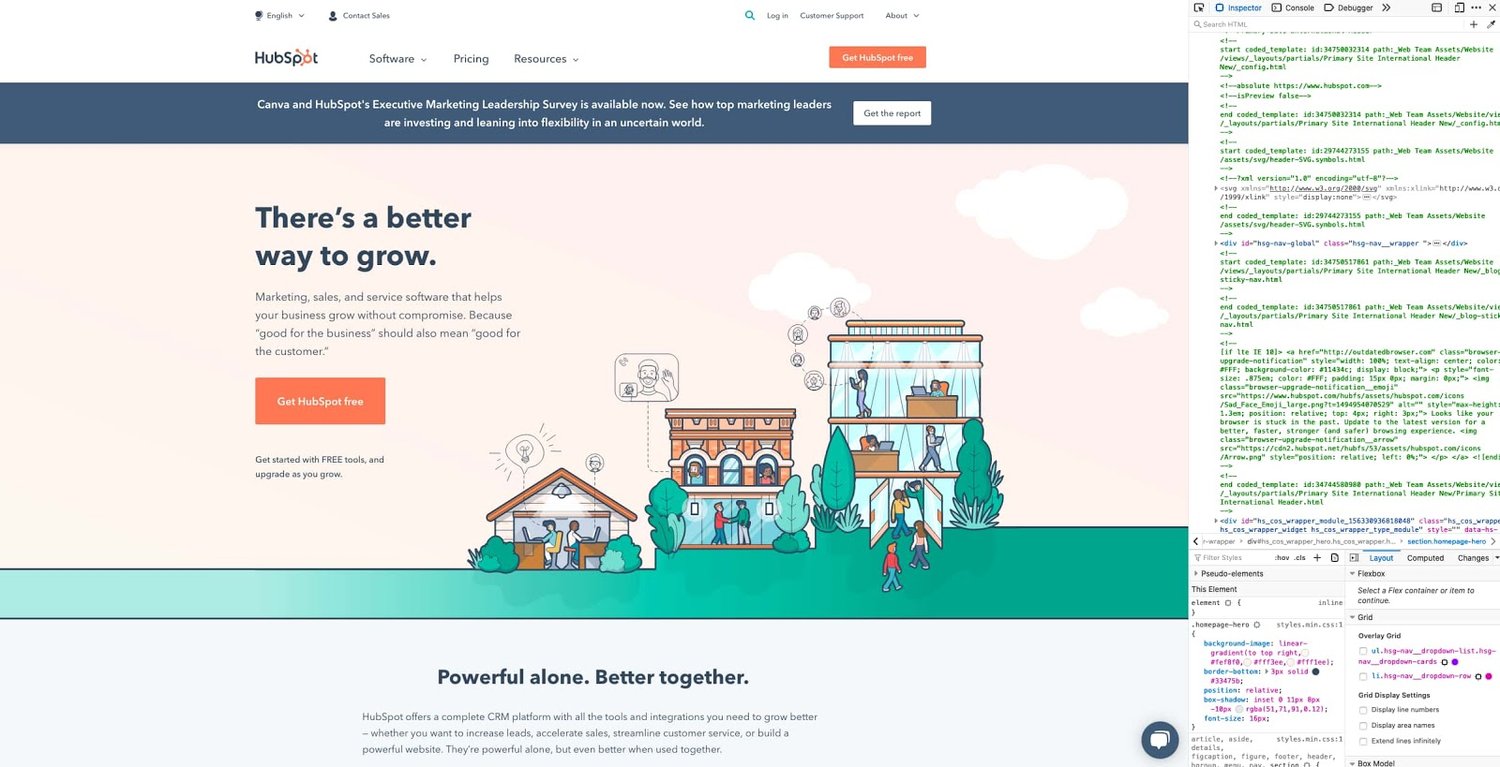
I’ll choose Dock to right — this makes it easier to view the rendered page and its source:
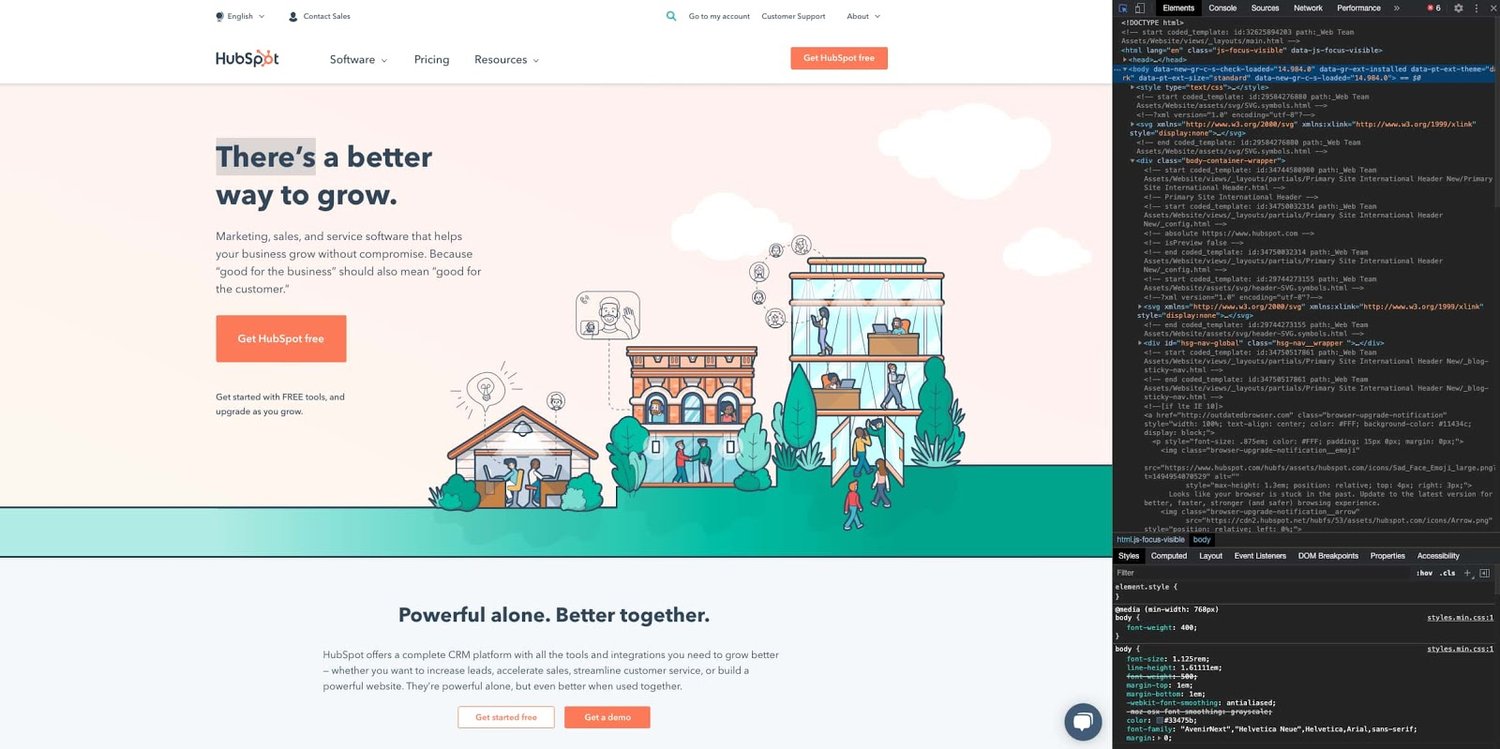
Along the top of the inspect panel, you’ll see tabs for Elements, Console, Sources, etc. These are all tools we can use to assess a page’s contents and performance. However, everything we need for inspecting is under the Elements tab.
4. Look at the source HTML code of the page.
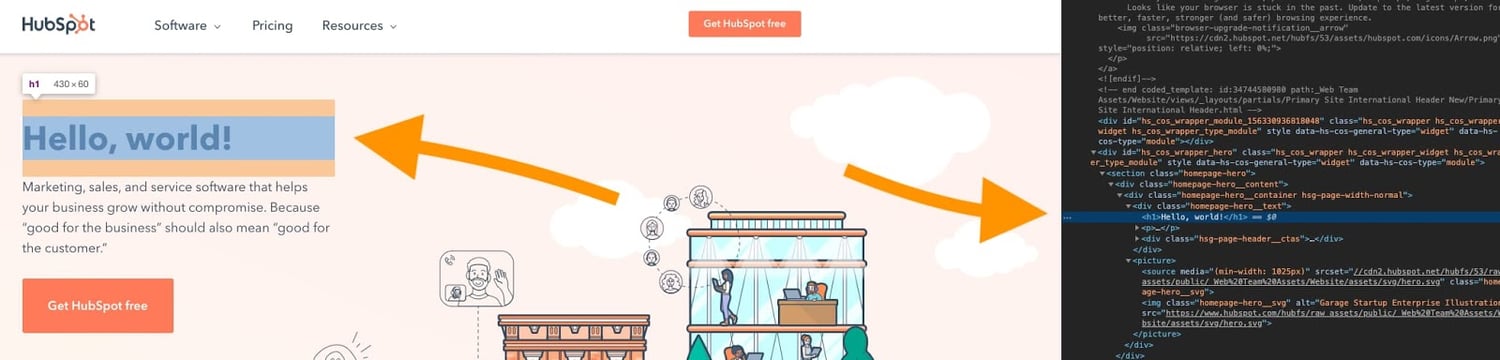
The biggest area of the panel will contain the source HTML of the current page. Take some time to explore this region, and notice how hovering the cursor over the piece of code highlights the corresponding element on the page.
Blue indicates the contents of an element, green corresponds to padding, and areas in orange are margins.
5. Select a specific element to inspect.
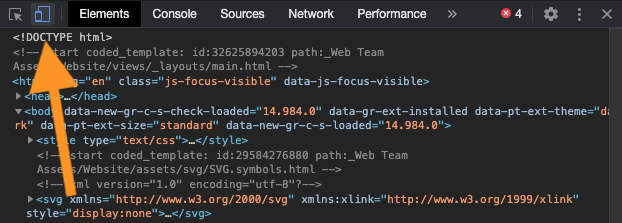
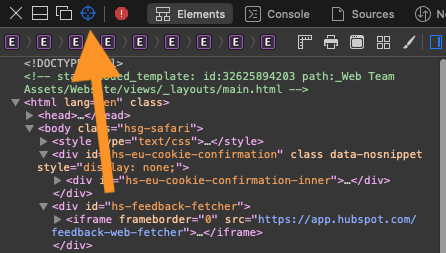
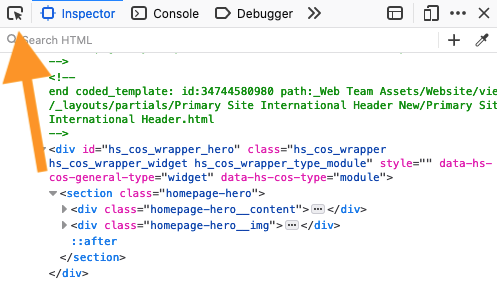
Rather than trying to read through the code to find an element, we can also do the opposite — we can locate a piece of code by hovering over the page element itself. To do this, click the Element select icon in the top left corner of the panel:
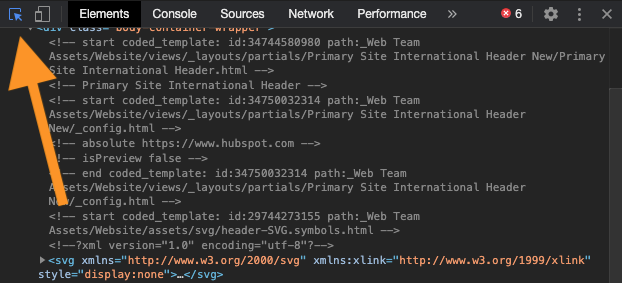
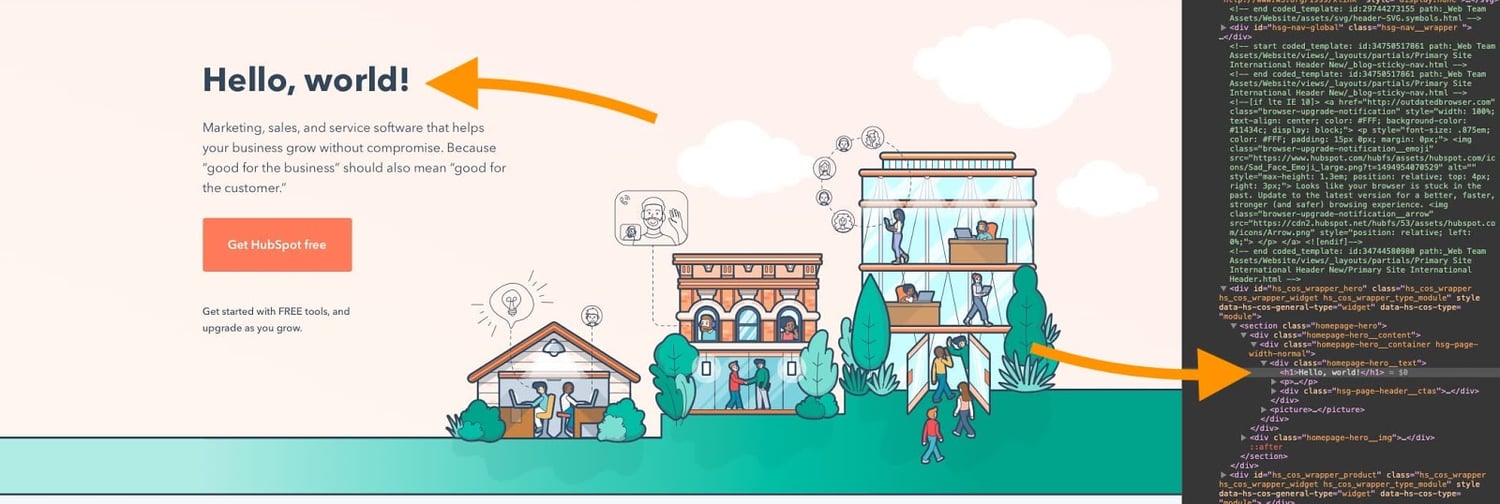
Next, click a page element. You’ll see the source code revealed in the inspect panel.
6. Edit the element's text, if desired.
Besides viewing, we can use the inspect tool to alter the page contents. Let’s start by swapping out some text.
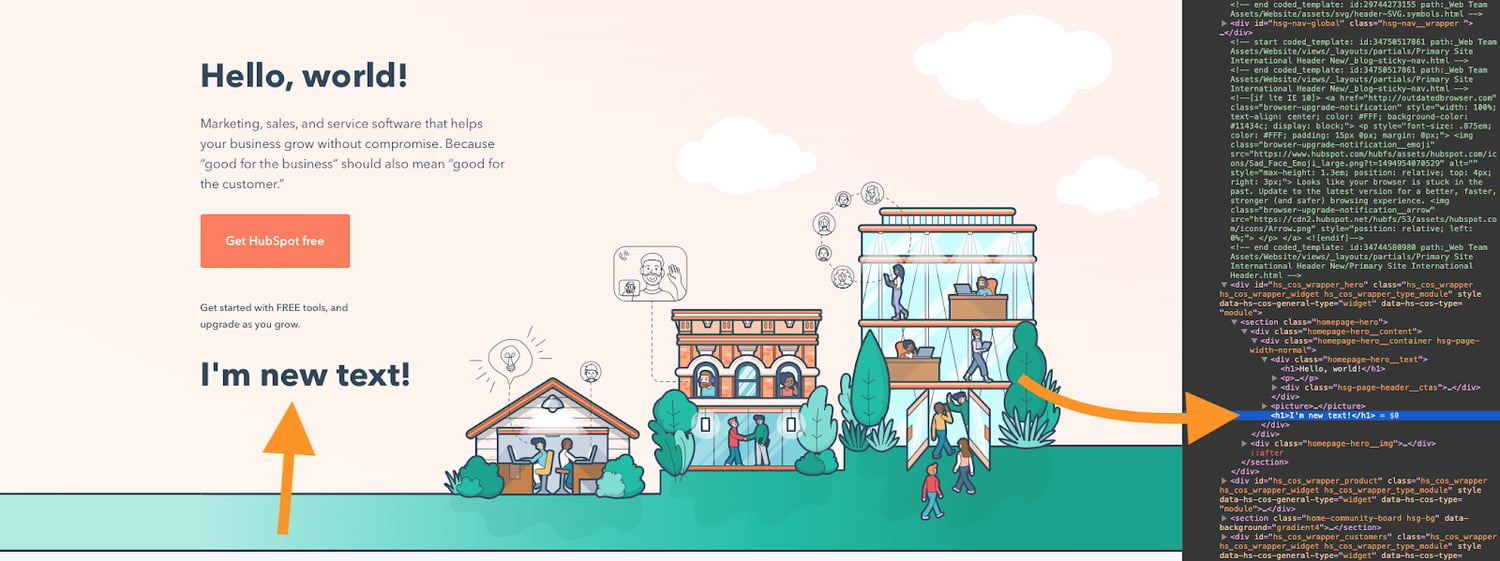
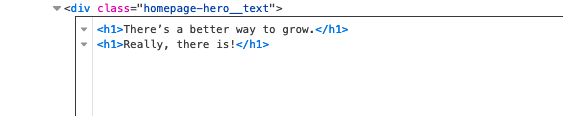
First, find some text content in the source code. Then, right-click the element and choose Edit Text — this opens an inline text input in which you can write whatever you want. When you deselect the text input, you’ll see the changes take effect:
Or, what about no text at all? Just select the element in the source code and delete it. The H1 will be gone from the page.

Don’t worry though — it will reappear when you refresh the page.
7. Hide and edit elements on the page.
You can also hide any element without deleting it by right-clicking the element in the source code and choosing Hide element.
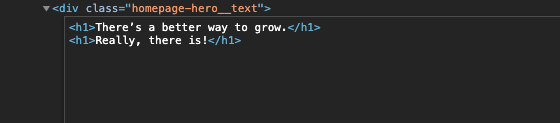
You can even add new page elements — right-click on an element in the source code and choose Edit as HTML. You’ll see a text field where you can paste HTML. For example:

8. Edit the page's CSS code.
Moving down the Chrome inspect panel, we see the Styles tab. This shows us what CSS styling has been applied to the selected element. Click on lines of code to rewrite them, or activate/deactivate certain declarations by checking/unchecking the boxes next to them. Let’s do this for our <h1> element’s font-weight property:
9. View the page's mobile version.
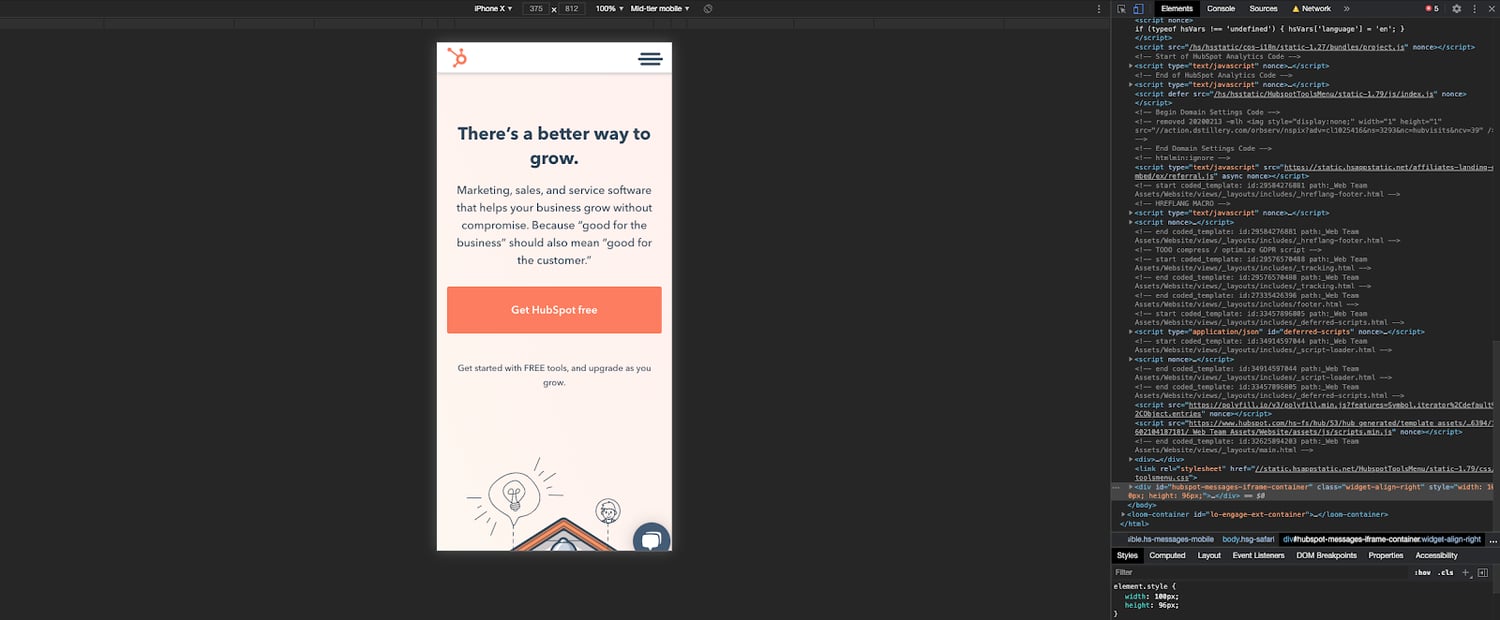
Finally, let’s cover one more feature of Chrome’s inspect feature, mobile view. When building a site, designers need to consider how its pages appear on desktop, mobile, and tablet screens alike.
Fortunately, Chrome lets you preview the same web page in multiple screen resolutions. Start by clicking the Toggle device icon in the top left corner of the panel:
From here, set the screen resolution manually or choose a device preset from the menu, then see how the page layout responds. You can also rotate the screen and even preview performance at “mid-tier mobile” and “low-tier mobile” speeds.
How to Inspect Element on Mac
To inspect an element on Mac, open up Safari. Select Safari > Settings > Advanced, then toggle the option that reads Show Develop menu in menu bar. Then, access your desired webpage, right-click, and tap Inspect Element.
Let's look at how to inspect a page on Mac in more detail below, including tips and tricks. We'll be using Safari, but technically you can also inspect a page on macOS by using Chrome or Firefox.
Free Guide: 25 HTML & CSS Coding Hacks
Tangible tips and coding templates from experts to help you code better and faster.
- Coding to Convention
- Being Browser-Friendly
- Minimizing Bugs
- Optimizing Performance
How To Inspect Elements in Safari
Safari includes a tool, just like Google Chrome, that allows you to inspect a web page. Here's how to use it.
1. Enable Safari's developer tools.
To use Safari’s inspect tool, Web Inspector, we first need to enable Safari's developer tools. Here's how:
- On the top menu, select Safari > Preferences.
- Tap Advanced.
- Check the box next to Show Develop menu in menu bar.
- You’ll see a Develop option added to the menu above.
2. Go to your desired web page.
Next, go to the web page you'd like to inspect. For this example, I'll be using HubSpot.com again.
3. Open up Web Inspector.
There are three ways to open Web Inspector in Safari:
- Option 1: Right-click any part of the page and choose Inspect Element. Right-clicking a specific page element will open that element in the inspector view.
- Option 2: Choose Develop > Show Web Inspector from the top menu bar.
- Option 3: Use the shortcut command-option-I.
3. Change the location of the inspect panel.
Safari’s inspector opens at the bottom of the window by default.
To change this configuration, click the icon to dock the display on the right side or pop out in a separate window.
Both are located next to the X icon in the top left corner of the display.
4. Look at the source HTML and CSS code of the page.
Safari’s inspector panel has two columns. The first shows the source HTML, and the second shows the page CSS.
Use your cursor to explore the source HTML and see which lines of code correspond to each page region. Blue highlights the contents, green highlights the padding, and orange highlights the margins.
5. Select a specific element to inspect.
We can also inspect the page directly. Click the element selection icon at the top of the panel:
Now, when you click a page element, Web Inspector reveals the corresponding source code.
6. Edit, add, or delete page elements.
Like Chrome’s inspector, Safari lets us modify, add, and remove page elements. To edit the page, right-click an HTML element in the inspect panel, then choose an option from the Edit menu. Web Inspector will prompt you for new text input, then display your changes in real-time:
Or, add a new element to the page by right-clicking a line of code and choosing an option from the Add menu. In this example, I’ve added a new <h1> child element to an existing <div>:
If you want to delete a page element, simply select some code and delete it. Or, right-click and choose Toggle Visibility to hide an element without deleting it.
7. Activate or deactivate the page's CSS code.
To the right we have the Styles column, where we can change or activate/deactivate CSS declarations for any element, like so:

When testing content and style changes, you’ll want to see the effect on mobile screens as well as desktops. We cover that next.
9. View the page's mobile version.
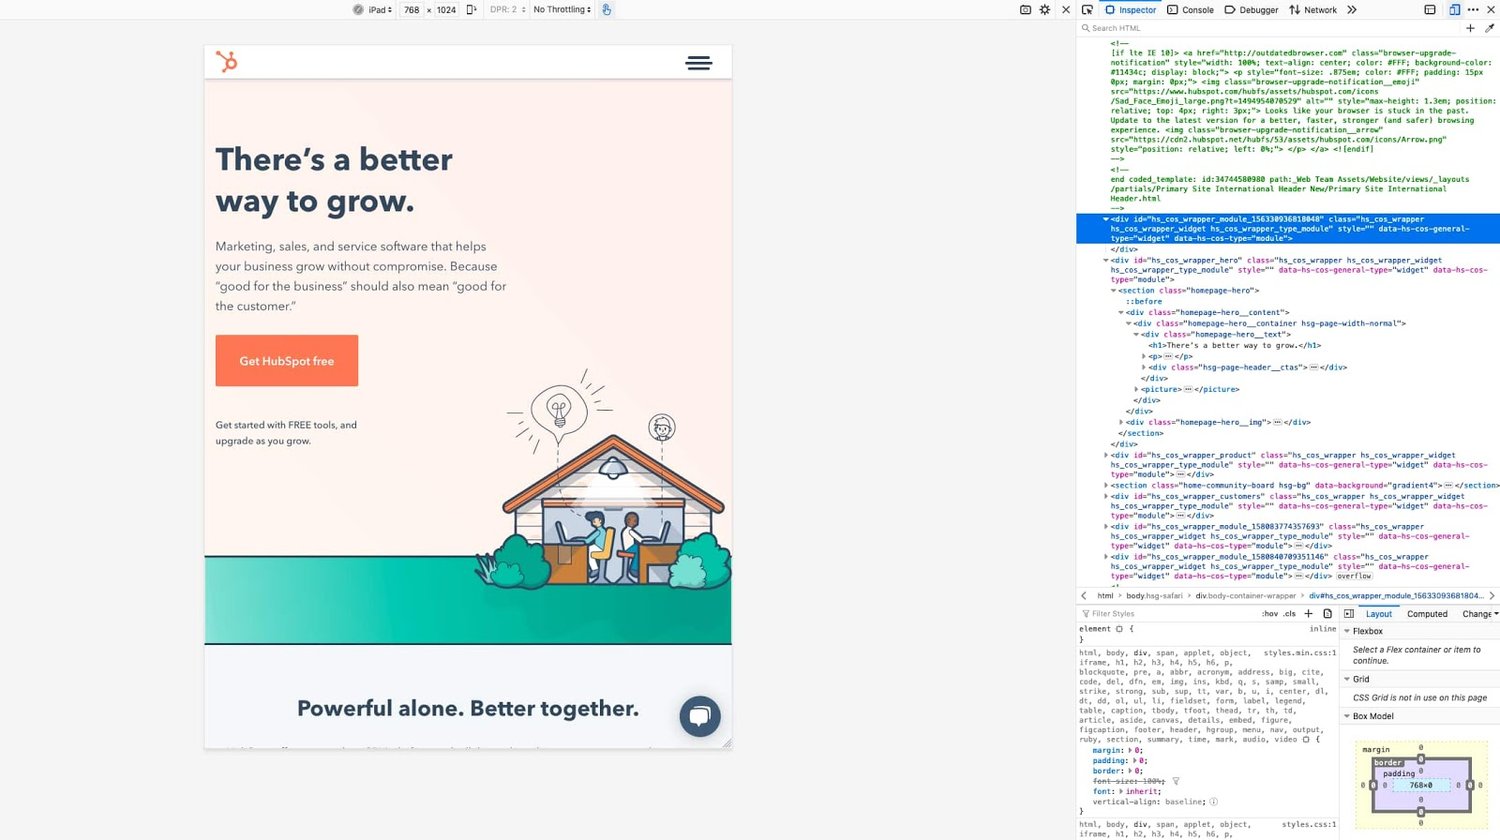
Safari’s Responsive Design Mode allows you to preview a website across common devices.
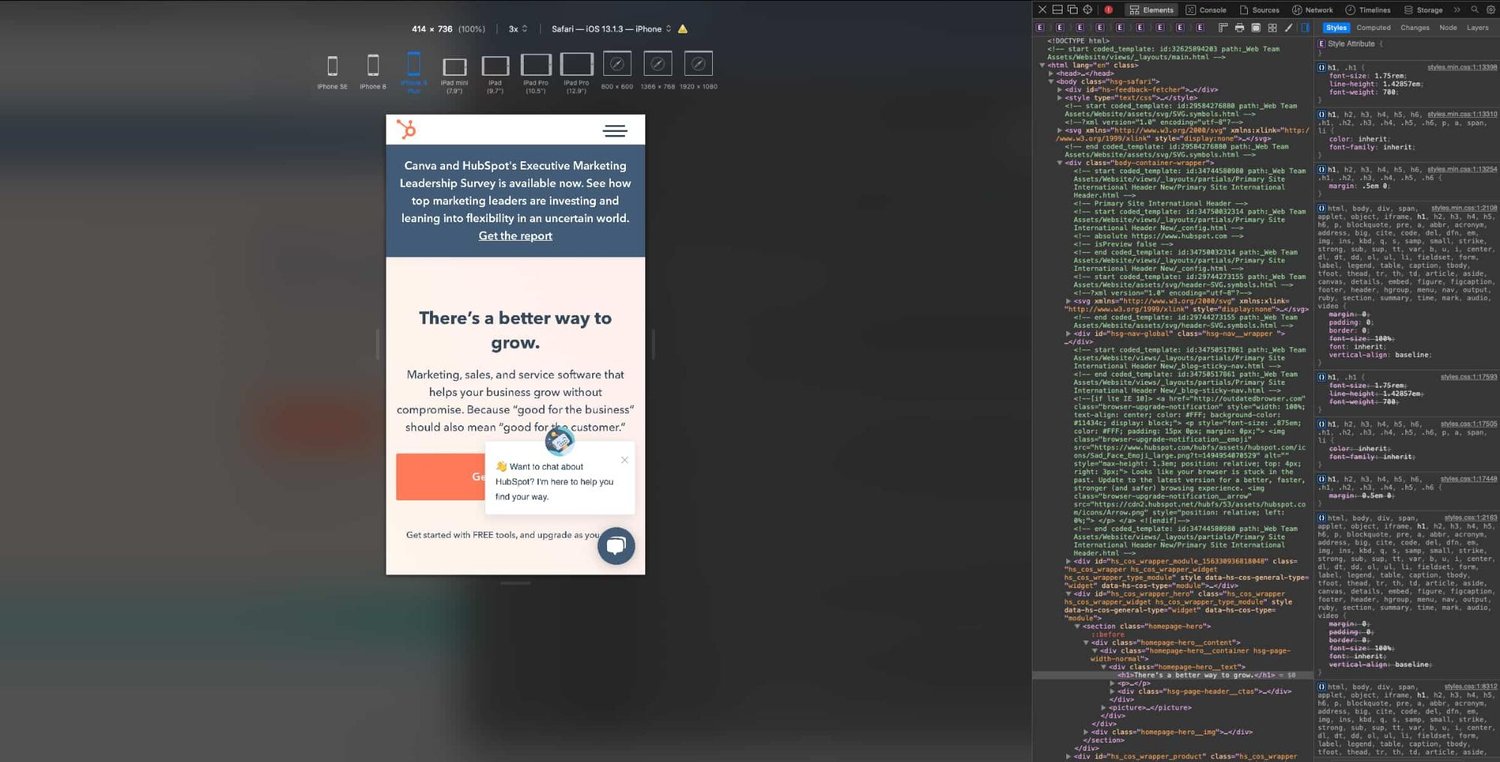
To view the page in a mobile viewport, choose Develop > Enter Responsive Design Mode. In this mode, you can use the same inspector tools on pages formatted for Apple devices, or set the dimensions yourself:
How To Inspect Elements in Firefox
Firefox is another great option for inspecting a web page in either macOS, Windows, or Linux. Here's how to get started:
1. Open Firefox's inspect element tool.
To open the Firefox Inspector, you have several options:
- Option 1: Right-click any part of the page and choose Inspect Element. Right-clicking a specific page element will open that element in the inspector view.
- Option 2: Select Tools > Web Developer > Inspector from the top menu bar.
- Option 3: Use the shortcut control-shift-C in Windows or command-option-C in macOS.
2. Go to your desired web page.
Next, go to the web page you'd like to inspect. I'll be using HubSpot.com again.
3. Change the location of the inspector panel.
The Firefox inspector appears along the bottom of the window by default. To change its position, select the three-dots icon in the top right corner of the inspector, then choose an alternative display option.
4. Look at the HTML code of the page.
Firefox’s inspector panel is comparable in features to Chrome’s and Safari’s. The HTML source code indicates the corresponding page element with color codes — content is blue, padding is purple, and margins are yellow:
5. Select a specific element to inspect.
You can also find code by selecting elements on the page. To enter selection mode, click the cursor icon in the top left corner:
Click any page element to reveal its source code in the inspect panel.
6. Modify or delete page elements.
To modify or delete a page element, select its code in the inspector. Then, either double-click to change the text, or right-click and choose Edit as HTML or Create New Node to add code. Or simply delete the code and see the resulting changes on the page.

7. Toggle the page's CSS styles.
To toggle the CSS styling of an element, use the Filter Styles region at the bottom of the inspect panel. Uncheck the box next to a CSS declaration to deactivate it (or write in new code yourself):
9. View the page's mobile version.
Finally, Firefox’s tools also come with a mobile preview option. To use it, click the Responsive Design Mode icon in the top right corner of the panel:
Responsive Design Mode lets you choose from several preset screen resolutions or set your own, and you can also toggle connection speed and device pixel ratio:
Get a Closer Look With Inspect
Once you learn the basics of your browser’s inspect tool, you might realize just how much information about your favorite websites is publicly available. With a few clicks, you can explore how exactly web pages are built, what styles they use, how they optimize for search engines, how they format on mobile screens, and a lot more.
Editor's note: This article was originally published in December 2020 and has been updated for comprehensiveness.
Free Guide: 25 HTML & CSS Coding Hacks
Tangible tips and coding templates from experts to help you code better and faster.
- Coding to Convention
- Being Browser-Friendly
- Minimizing Bugs
- Optimizing Performance


![How to Build & Run an Effective Website With a Small Team or Budget [Startup Tips]](https://blog.hubspot.com/hubfs/website-on-a-budget.jpg)


![How to Make a Website With User Accounts and Profiles [With WordPress, Wix, and More]](https://blog.hubspot.com/hubfs/how-to-create-user-accounts-and-profiles.jpeg)