
Reporting tools should also make your job as a marketer easier. Having the ability to efficiently create attractive, action-oriented, and readable reports is key to ensuring the results of your work are clear for your entire team. This is exactly where business intelligence (BI) reporting tools come in handy — below, we'll cover 17 options.
Best Business Intelligence Reporting Tools
As Zingale notes, "Data points such as age, ethnicity, gender, location, education, and employment have informed marketing teams and heightened the impact of campaigns across the board."
Solid reporting tools should give you the above metrics — but great tools should give you even more. And you'll need those metrics and data if you're part of the 75% of marketers who report ROI from marketing campaigns. Let's dive into 17 BI reporting tool options.
Best Business Intelligence (BI) Reporting Tools
- HubSpot Marketing Analytics & Dashboard Software
- Calendar
- DashThis
- RavenTools
- Megalytic
- Klipfolio
- Mixpanel
- Intercom
- G2
- Databox
- MaxG
- Microsoft Power BI
- Datapine
- Zoho Analytics
- Domo
- Proxycurl
- InsightSquared
- Grow.com
- Polymer
1. HubSpot Marketing Analytics & Dashboard Software
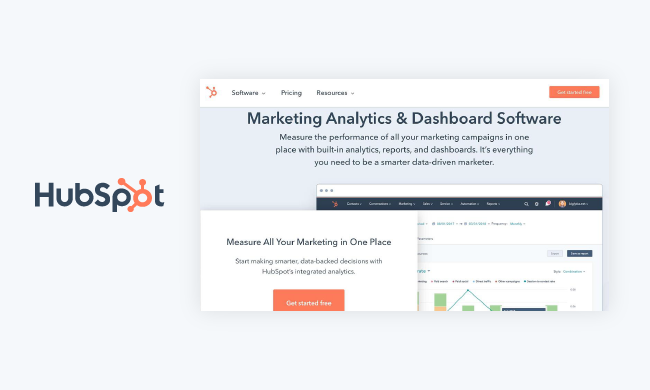
HubSpot's Marketing Analytics & Dashboard software is easy to use and helps you measure and analyze the performance of your campaigns and marketing efforts with built-in analytics, reports, and dashboards. With HubSpot, all of your marketing and CRM data will be located in one place and at your fingertips — no SQL or coding required.
Attribution reporting (both revenue and contact) connects each customer interaction — and any revenue generated — to that contact's record. Additionally, you can pinpoint the specific channels that are hitting or surpassing their goals — and which channels need improvement — so you can effectively focus your attention and budget where it makes sense to do so.
The Custom Report Builder brings together all of your data in a single location without the need for spreadsheets. Access contact, company, and deal data plus your landing page, blog, and email data with this feature. And with Custom Objects, you can get data that's unique to your business in order to create new segments and create custom reports, campaigns, and workflows.
Pre-built, customizable, and flexible dashboards can be shared with your team with ease from HubSpot or via email or Slack. If one of the many pre-built templates doesn't interest you, you can always create a custom dashboard with the no-code editor. The drag-and-drop interface makes it easy to personalize your dashboard's appearance, metrics, and data.
In addition to reporting, HubSpot comes with a Behavioral Events feature that tracks custom interactions that are unique to your business and indicates when a customer is ready to move to the next stage of the buyer's journey. The feature can then trigger or schedule your next touchpoint and notify you once that event is completed. Lastly, you can use the Account Based Marketing (ABM) feature to close the gap between Marketing and Sales so you're able to close more high-value target accounts.
2. Calendar
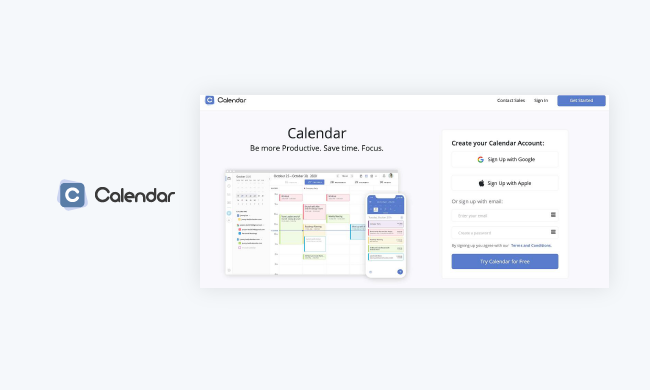
Calendar offers productivity analytics. It has a number of features designed to analyze how your team’s time is spent. By tracking your moment-to-moment activities on a daily basis, you can identify key areas in which your schedule could be improved.
As important as it is to have your marketing analytics at your fingertips, knowing how you use your time is just as important for maximizing marketing output. Calendar’s clear and simple reporting tools give you helpful reports on what your agenda looks like and what you can do to make it better.
3. DashThis
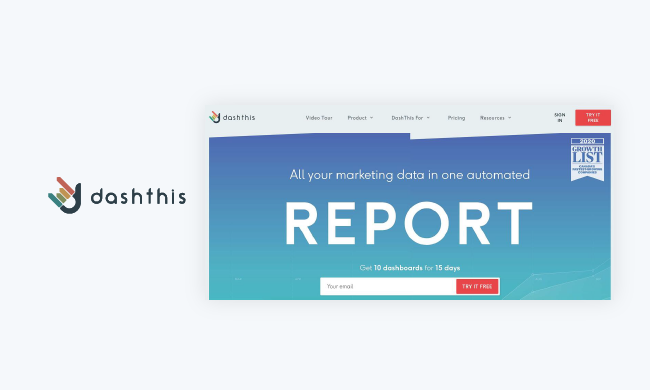
DashThis is an effective tool for keeping up with marketing analytics at a glance. It's a dashboard that provides a clear look at your campaign KPI data. You can access quick metrics and reports from your dashboard.
DashThis lets you select a template and then automatically fills that template with your data to streamline the reporting process. It also exports data into PDF files so you can share reports with your team.
4. Raven Tools
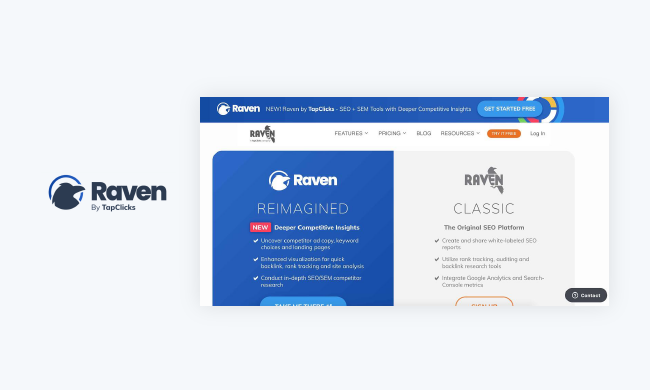
Raven Tools offers SEO analysis, social media engagement, funnel performance tracking, and competitor comparison. Whether it’s big-picture analyses, like domain authority, or small-scale comparisons of site functionality, Raven Tools lets you stay on top of how you’re faring in competitive spaces. Additionally, the drag-and-drop editor and report generator make creating custom, professional-grade marketing reports easier.
5. Megalytic
Megalytic eases the process of combining marketing data from many sources — Megalytic is specially designed to import data from a range of marketing software.
It takes only a couple of moments to access data from Google Analytics, Facebook Ads, Adwords, and more on Megalytic. The tool can also process and report data stored in CSV files. Lastly, if you’re looking to produce a comprehensive report that pulls together loads of disparate data into one place, Megalytic is a smart choice.
6. Klipfolio
As important as it is for reporting tools to effectively take in and analyze data, they also need to produce readable reports. Klipfolio is great for making sure your reports can be read and accessed with ease across various technologies as well as via the tool's dashboard that update in real-time.
Additionally, Klipfolio allows you to offer access to your reports through Slack, email, or custom links, and it enables you to sync your dashboards in real-time across multiple devices such as smartphones, web browsers, and TV screens. Having the ability to efficiently pull up your analytics dashboard at any time, via any device, makes actions like on-the-go reporting, team collaboration, and remote work simple.
7. Mixpanel
Mixpanel is a tracking and reporting tool with powerful analytics features that provide insight into trends like engagement and count. It tracks how people engage with certain products over time and how different features influence user behavior with graphs. If you’re interested in keeping track of how a certain site or product is performing, it can be a valuable tool for reporting on that kind of information, too.
8. Intercom

Although Intercom is a messaging platform first and foremost, it also delivers an in-depth view of a company’s customer base. Through integrations with over 100 marketing tools, Intercom lets marketers track, segment, and identify similarities between their customers. One of the best use cases for Intercom’s BI features is account-based marketing and messaging.
Intercom displays performance figures for each stage of your sales and marketing funnel, helping you see where the best opportunities are and how to tap into them. You can also break down metrics by individual representatives, teams, timeframes, and more.
9. G2
G2 is the go-to website for stacking up software tools against one another. G2 gives detailed analyses and charts for every category of marketing software and explains important factors such as strengths and weaknesses, features, pricing, customer reviews, and more. G2 will also often include screenshots and videos of the tools in use.
10. Databox
Through integrations with HubSpot, Google Analytics, Facebook, LinkedIn, Instagram, and more, Databox compiles popular marketing services and social media into one interface. It comes with pre-configured report templates, but users can also design custom reports.
The reporting tool lets you view campaign KPIs, check progress, calculate investment returns, and receive notifications when metrics fall outside of specified ranges. Databox has a desktop version, of course, but it also displays data on mobile and via apps like Slack.
11. MaxG
MaxG is a platform that leverages artificial intelligence (AI) to drive results. The software prioritizes recommendations when delivering insights to eliminate guesswork about how to improve content.
Reports are broken down into metrics and the tool tracks how many users interacted with the content across all of your web pages. It also provides insight into various metrics regarding your email campaigns, landing pages, and CTAs. In addition to giving performance recommendations, MaxG offers educational resources for users to learn from (e.g. how to create an informative blog post).
12. Microsoft Power BI
Microsoft Power BI integrates business intelligence data directly into reports for you. The tool can scale with your business as you grow and boasts a built-in AI feature that offers custom data metrics. You also have a display of visualizations you can choose from to pair with your insights. Lastly, use Power BI to query your data and edit it without affecting other programs you use.
13. Datapine
With Datapine, you have access to reporting tools that communicate KPIs on a single dashboard. Easy access to real-time, accurate metrics saves you time and keeps your team on the same page. If you don't have much technical experience, you won't have to worry — Datapine is easy to navigate and makes data analysis straightforward. The platform also integrates with a number of tools so you can customize your data from other sources, too.
Personalize the KPIs on your reports further with the drag-and-drop dashboard builder. Additionally, Datapine gives you access to a global performance filter and predictive analysis (since Datapine is AI-powered, it combs through data for you and suggests improvements). Datapine also lets you export dashboards by email, URL, or with an embed code.
14. Zoho Analytics
Zoho Analytics is a part of the larger Zoho Cloud software suite. With it, you can synchronize data that's spread across multiple sources. The data will sync on a periodic basis for you and you can customize your reports to get the information that matters most to you.
If you want to compare data from multiple sources, add lookup columns so they'll be included in your reports. With over 40 chart types, like geographical maps, funnels, tables, and heat maps, your reports can be anything you want them to be.
15. Domo
Domo is a cloud-based business intelligence platform that helps you create a data-focused culture across all of your teams. There are a number of BI data visualizations that you can choose from including interactive maps, graphs, and pie charts — and if you're unsure of which visualization would work best for your data, Domo will recommend a visualization for you.
Personalize your data and reports with the drag-and-drop dashboard builder and customizable, pre-made templates, which make the process of data visualization faster. Set alerts to track changes to your KPIs in real-time, annotate your data, and refine your data with filters, calculated fields, and by adding or removing certain data points. Lastly, get a quick view of your marketing and sales KPIs in your CRM with Domo's HubSpot integration.
16. Proxycurl
Source
Proxycurl is an intelligent search API that can help you find companies and people within companies using advanced search filters. With Proxycurl, you get an extensive database of companies and professionals with accurate data fetched from their LinkedIn profiles.
If you run a B2B business, you can use it to find companies that match your ideal customer profile. Not just that, you can find information on key decision-makers within your target companies to generate more leads for your business. Additionally, you can also use it to find top talent with specific skill sets.
17. InsightSquared
InsightSquared is a revenue operations and intelligence platform that's available for HubSpot, Salesforce, and Bullhorn CRMs. The tool offers seven main features: deal activity, conversational intelligence, guided selling, interactive reporting, forecasting, dashboards, and personas. The tool is unique because it brings together your marketing, sales, and customer service data to give you cross-team, real-time business and revenue intelligence.
Automate forecast submissions across your team and manage all of your marketing, sales, and service data and dashboards from a single location. It's also easy to share those reports and dashboards with team members to ensure everyone, from marketing to sales to service, is on the same page and has access to the information they need to succeed.
18. Grow.com
Grow.com is a business intelligence tool that brings together all of your data, from multiple sources, and compiles them into insights, reports, and dashboards. Rather than needing multiple tools to store your data, Grow.com removes the need for third-party data warehouses — it organizes data from disparate sources so your most important data is always easily accessible and you won't have to spend time sifting through your various tools and reports to surface the information you need.
Build your own metrics and display your data with beautiful and easy-to-understand visualizations. Grow.com makes the process of sharing these reports with your team simple over email, Slack, export, URL, email, and TV mode. You can also integrate Grow.com with HubSpot to help you make data-driven decisions from your CRM.
19. Polymer
Polymer is one of the most intuitive business intelligence tools on the market that let's you create custom dashboards and insightful visuals to present your data without writing a single line of code or doing any technical setup.
What sets Polymer apart is that it can be used across all teams in an organization. Your marketing teams can use Polymer to identify your top-performing channels, audiences, and marketing assets. Sales teams will gain faster access to accurate data for streamlined workflows. DevOps will be able to run complex analyses on the go.
Polymer connects with a wide range of data sources, including Google Analytics 4, Facebook, Google Ads, Google Sheets, Airtable, Shopify, Jira, and more. You can easily upload your data set with a CSV or XSL file.
Choose Your BI Reporting Tool
Marketers use data daily — that's why it's crucial you have data that's relevant, well-organized, and provides the information you need to hit your goals. Business intelligence reporting tools make this process easier and more effective. So, determine which features you need most out of your BI tool and get started analyzing, sharing, and applying your data.
Editor's note: This post was originally published in July 2020 and has been updated for comprehensiveness.


-Oct-10-2023-02-55-07-8252-AM.png)
-Apr-22-2023-12-26-04-1013-AM.png)
.png)
![How to Calculate Marketing ROI [+Free Excel Templates]](https://53.fs1.hubspotusercontent-na1.net/hubfs/53/Marketer%20calculating%20ROI%20in%20marketing%20from%20free%20Excel%20templates.jpg)

![How to Create a Funnel Report [Quick Guide]](https://53.fs1.hubspotusercontent-na1.net/hubfs/53/funnel-reporting_1.webp)