

It's the timeless question for corporate bloggers: How many leads did your blog post generate? It's much easier to see top-line metrics like how many visits each blog post gets, but measuring the impact further down the funnel is essential to growing your blog -- and your business.
But even more important than knowing the number of blog leads you have generated is being able to analyze those results and create an actionable plan for the future. After all, if you can't make changes based on your analytics, they won't really be that helpful.
Download our free marketing tool that alerts you the moment you get a new lead on your website.
Not sure how to run a blog lead analysis? In this post, we'll walk through an example report, analyze it, and outline the action items we can take from it. Let's start from the beginning: the report itself.
Running the Blog Leads Report
Marketers often can calculate the number of leads their blog generates as a whole, but they don't have insight into the number of leads each individual blog post generates. But the post-level information is important to help us figure out the best topics and formats for our posts.
To find this out, you should run an attribution report in your marketing software. To learn how to create this type of report in HubSpot, see this blog post.
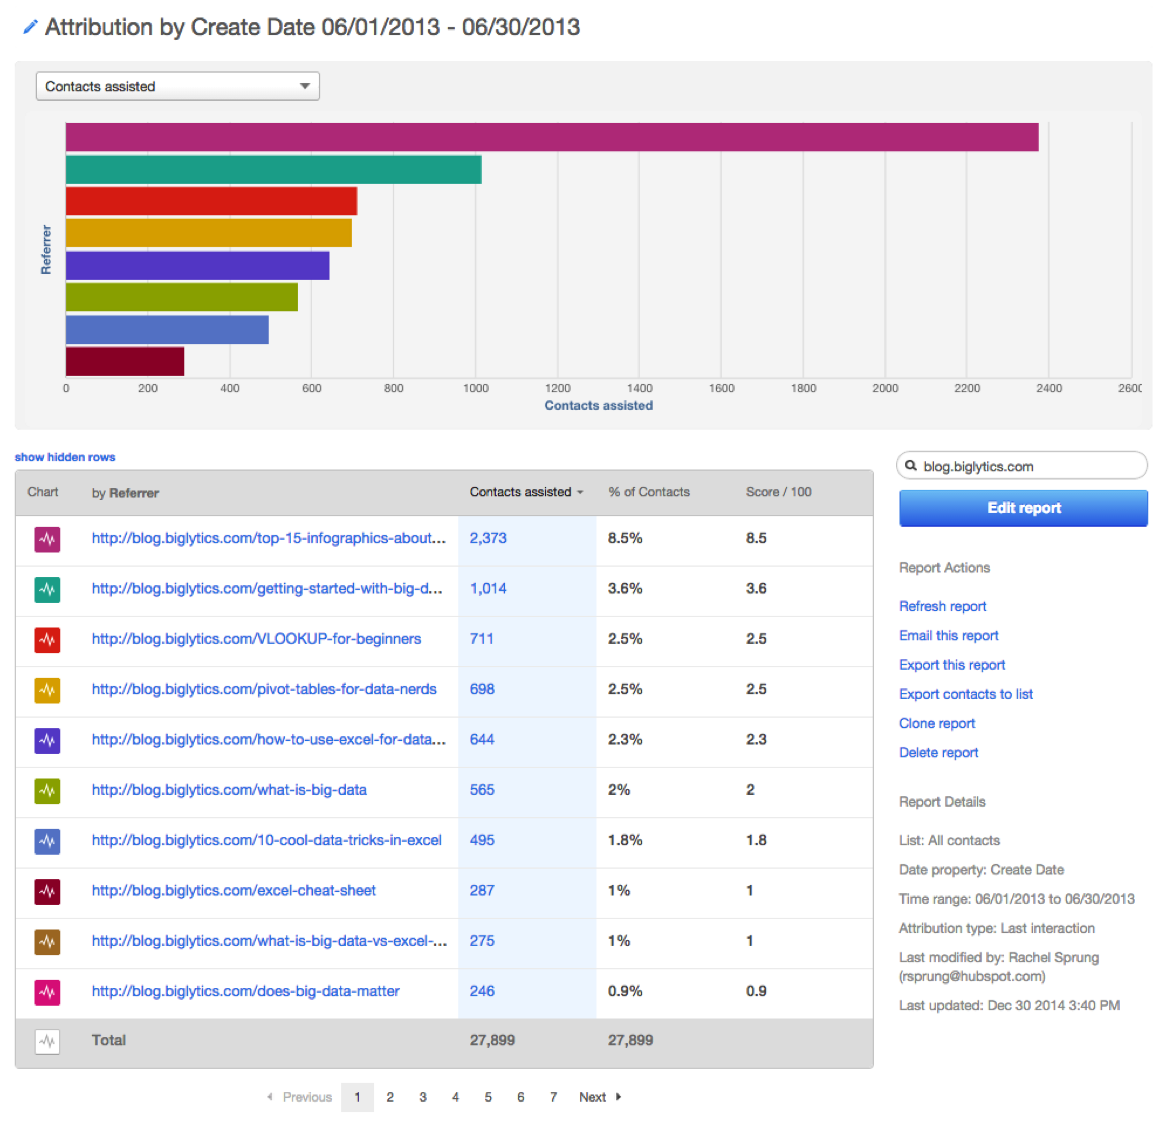
Let's take a look at an example report that shows us the number of leads generated from a company's blog posts. Next up: analyzing this report.
What should you look at in the report?
Depending on how many blog posts you write each month, you may be starring at a very large report. To begin your analysis, pick out your top five best-performing posts and your bottom five worst-performing posts.
For this post, we'll just address the top five posts -- but be sure to ask yourself all the same questions for the bottom five, too. The example attribution report above shows us that the top five performing blog posts are the following:
- Top 15 Infographics About Big Data
- Getting Started with Big Data
- VLOOKUP for Beginners
- Pivot Tables for Data Nerds
- How to Use Excel for Data Analysis
When you are done doing that, dive into the following questions. These questions are designed to help you take away actionable insights from the data.
Are there similar topics?
The first thing you should do is look at the top (or bottom) five posts, and see if you see any similarities. Begin with topic commonalities. Are there popular topics that seem to appear in all of the posts that are generating leads? Are you surprised to see that certain topics you thought would perform well aren't in the top five? Understanding what topics resonate with your audience will give you ideas for future post topics that have a high probability of doing well.
In the example situation above, we see that the top two blog posts are about big data, and the next three are about data analysis in Excel. This information can help me cater my future content toward the topics that drive lead generation.

Resources to Help
- Why Business Blogging Works
- 7 Quick Ways to Curate Industry Content for Your Blog
- How to Choose a Solid Topic for Your Next Blog Post
Are there similar formats?
The format of a blog post can also influence whether or not someone is going to convert on your post. Some people prefer list-based posts while others look for visual posts that include infographics or SlideShare presentations. Check your blog content to see if there is a certain format of your post that resonates well with your audience. This will help you understand how your audience consumes information.
In the example above, the top blog post is a visual piece. However, the remaining four posts are how-to pieces -- so it's probably a good idea to ramp up more how-to pieces in the future (and sprinkle in some visual content).
Resources to Help
- Which Format Is Right for Your Next Blog Post?
- How to Write Stellar How To Posts for Your Business Blog
- Want to Be a Better Blogger? Embrace Structure
Are they similar lengths?
There is an unlimited amount of information you can provide in a blog post. But how much is enough? Or what is too much? Analyze the lengths of your different blog posts to see if there are some that are driving more conversions than others. You may notice that in the longer posts, you aren't getting as many conversions. This may be a good indication that your readers aren't getting to the end of your posts where your calls-to-action are located.
Resources to Help
- How to Get People to Read Your Entire Blog Post
- Cut Your Content in Half: How to Write Less and Say More
Was there embedded media in the post?
Often, other forms of content are included in blog posts, such as social posts, videos, SlideShares, or infographics. This is a great way to share additional pieces of content in your blog without writing another full blog post. The media can serve as the bulk of the content for your post.
In the example above, the top-performing blog post was "Top 15 Infographics About Big Data." Even though there aren't other forms of media in the other top-performing posts, this may be an indication that your audience likes to see infographics.

Resources to Help
- 8 Data-Driven Tips for Using Images in Blog Posts
- How to Select the Perfect Image for Your Next Blog Post
Which CTAs did these posts use?
The most important element of your blog post to drive conversions is including a call-to-action for your readers to convert on. Look at the top five blog posts and see if you have used a certain CTA multiple times. Your CTAs should correlate with the blog content so if you are seeing similarities in your blog content, you may see similarities in the CTAs that are driving conversions. However, if you are testing out multiple CTAs on the same content, this can be a good indication to what is working.
In the example above, I may have a few CTAs that I use for big data posts. Big Data was the topic of my top two posts. At this point I would dig in to see which CTAs were on the posts that converted well. If it is the same CTA, I know that it performs well. If there are different CTAs, I can see if they have something in common like the colors or keywords.
If you want to test out varoius types of pop-up CTAs and learn more about who's visiting your blog, try HubSpot's free lead capture tool.
Resources to Help:
- Want to Improve Your Blog's Conversion Rates? 11 Tests to Try
- Which Works Better for Blog Conversion: A Standard CTA or a Full Form?
Where were the CTAs placed?
To continue the CTA analysis previously mentioned, I also need to see where the CTAs on my blog posts were placed. Are they at the bottom of the post? In the sidebar? Do they slide in? Are they in the middle of the blog post? This information will show me what type of CTA works. Dig into the performance of the different CTAs you have on your blog to figure out if one technique works over the other.
If you have more than one CTA on your blog post, see which one works better. You may be surprised at your results.

Resources to Help
- 4 Fresh Ways to Squeeze More Conversions Out of Your Blog
- How to Add Slide-In Calls-to-Action to Your Blog Posts [Tutorial]
Were there links to a landing page? Where were they placed?
In addition to your typical image CTAs, you may also have links to landing pages or other helpful pages on your site in the text of your blog post. Before you publish your blog post, it is important to set up tracking URLs for the most important links to help you understand if they are being clicked.
Take the analysis a step further and look at the location they were placed in your blog post. If the only links that are clicked are at the beginning of the blog post, that may tell you that your readers aren't getting as far through the post as you may have thought. It may also tell you that you should put the most important pages (such as your landing pages) toward the beginning of the post if they are more likely to be clicked on in that location.
If your links are clicked more at the end of the blog post, that may tell you that your readers are interested in getting more information by clicking links after they read the bulk of your content. Either way, the location of your links can tell an important part of the story.
Resources to Help
- 8 Quick Tips to Help Increase Your Landing Page Conversion Rate
- 9 Real-Life Conversion Rate Optimization Tests to Try Yourself
Were they promoted on certain channels?
We have talked a lot about on-page blog content analysis. But there are other factors that may influence how many leads are converting on your posts such as the channel they were promoted on. Before you publish your blog post links on social media or send them out in an email marketing campaign, make sure that you have the correct tracking URLs in place for each promotional channel. This will help you understand if your blog content is performing better on certain channels. It will also allow you to dig into whether or not certain topics or formats perform better on channels you are promoting them on.
For example, "Top 15 Infographics About Big Data" may perform well on social media but "Pivot Tables for Data Nerds" may perform well on email. The topic, format, and length of your post may influence how well it does when promoted on different channels, too.
Resources to Help
Next Step? Experiment.
There are a lot of insights you can gain from doing an analysis on these aspects of your blog posts. I even gave you some examples of what my thought process would be as I looked through the different numbers. However, the best way to figure out what will work and will not work is through running experiments. Experiment. Experiment. Experiment. I can't emphasize it enough.
Pull out the conclusions you drew through your analysis, and implement them in future content. Focus on the topics that work the most. Use the blog post formats that are generating the most leads. Adjust your length based on the posts that are performing the best. Use the CTAs that generate the most leads, and place them in the location in your blog post that works. Promote your posts on the channels that you think it will perform the best on. Optimize your blog posts based on your data, and then re-run the report to see if your results have improved. The only way you will learn if your conclusions are accurate is if you experiment with them.
So what are you waiting for?
If you are a HubSpot customer, read this post to find out how to do this type of analysis right in HubSpot!
What else do you look for when you are doing a blog analysis?

Lead Generation
![What is a lead magnet? 20 lead magnet ideas and examples [+ step-by-step]](https://53.fs1.hubspotusercontent-na1.net/hubfs/53/lead%20magnet%20represented%20by%20a%20magnet.webp)


![Gated Content: What Marketers Need to Know [+ Examples]](https://53.fs1.hubspotusercontent-na1.net/hubfs/53/UNGated%20Content.png)

![What is demand generation? Here’s how you can create buzz for your offering [FAQs]](https://53.fs1.hubspotusercontent-na1.net/hubfs/53/demand-generation-1-20251208-2900472.webp)