If that’s the gold standard, how can you make sure your customer experience lives up to it? In this article, I’ll share the top ways to measure — and improve — your customer experience. I’ll also share some of the latest data from our 2024 State of Service report to support these insights. Together, we’ll explore customer satisfaction, retention, resolution time, and more.
Table of Contents
.png)
Free Customer Service Metrics Calculator
Calculate your business's key metrics and KPIs for customer support, service, and success with this free template.
- Customer Acquisition Cost
- Customer Lifetime Value
- Customer Satisfaction Score
- And More!
Download Free
All fields are required.
Form not available
Top Customer Service Metrics Reps Track in 2024 [New Data]
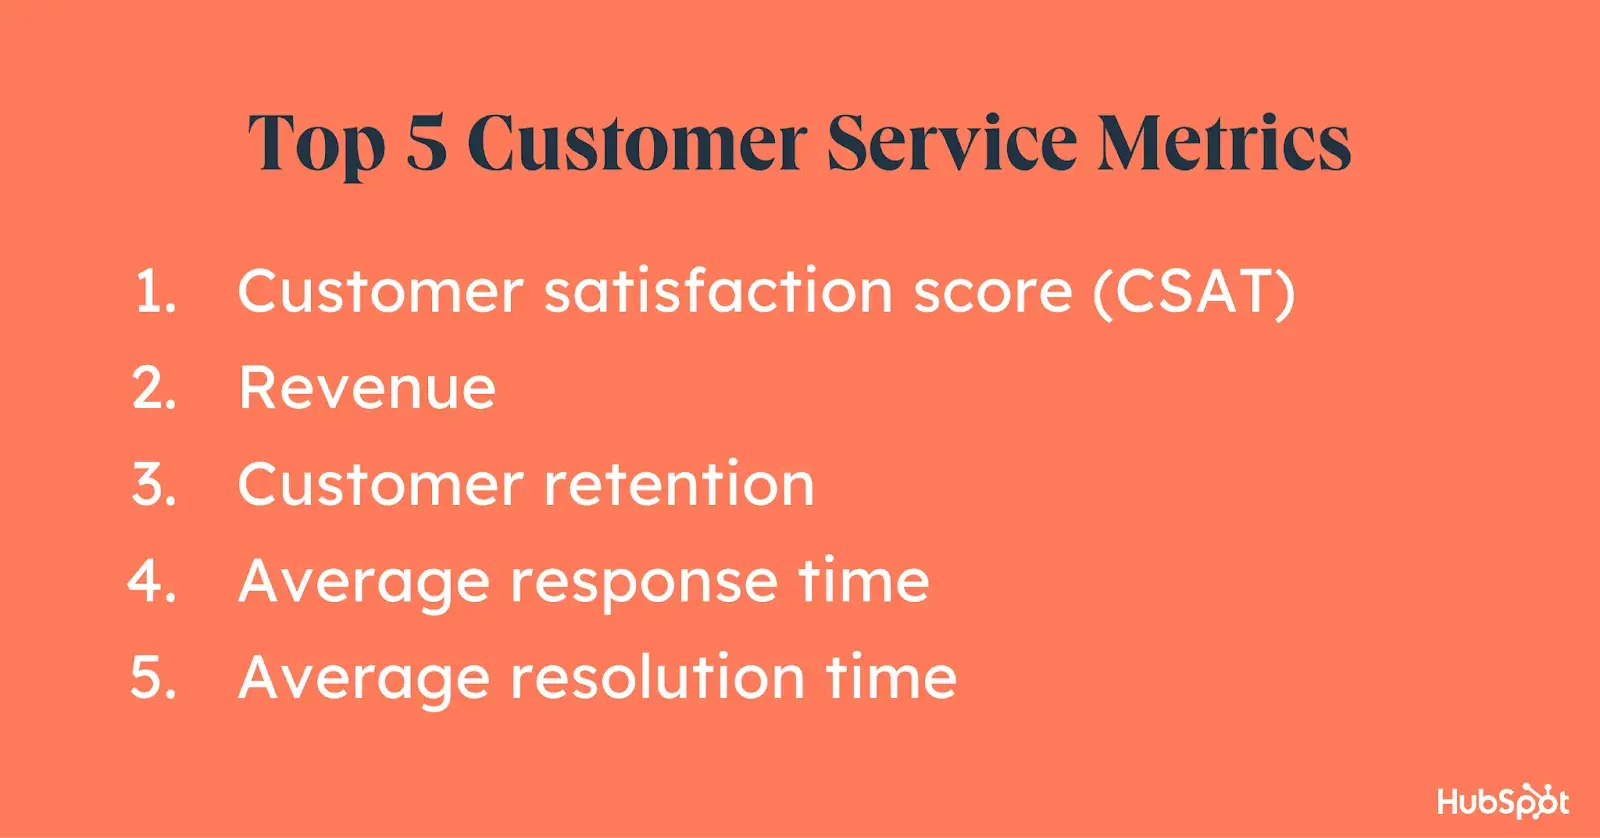
According to our State of Service report, the top KPIs service leaders track in 2024 are:
- Customer satisfaction score (CSAT).
- Revenue.
- Customer retention.
- Average response time.
- Average resolution time.
When choosing a list of five most important metrics, customer satisfaction and customer retention were selected by 31% of respondents. Followed closely behind are average response time (29%), average resolution time (26%) and customer lifetime value (26%).
Like my example with the airline, customers today are expecting swift action from your customer service teams. Tracking metrics can measure how satisfied your customers are and how quickly you serve their needs — because you can’t improve what you don’t measure.
Keep reading to see what top metrics you should track in 2024 to deliver exceptional customer experience.
11 Customer Service Performance Metrics You Must Track
1. Customer Satisfaction (CSAT)
Customer satisfaction measures how your customers feel about the customer service or support they received — and it’s the leading metric for CS teams to track, according to our State of Service report.
CSAT is typically measured by asking your customers to complete a quick survey post-service, whether by clicking a thumbs up or thumbs down or answering a few questions about their experience. How you collect this data is up to you.
What Customer Satisfaction Tells You
This crucial metric tells you how effective, helpful, and friendly your customer service team was and if your customer’s issue was fully resolved. It could also tell you whether or not they’d return with a question or concern based on your questions.
What to Look For When Measuring Customer Satisfaction
Look for positive responses, which means great customer experiences and a well-functioning customer service team. Negative responses can also help, as they tell you how to improve.
How to Improve Customer Satisfaction
Listen to what your customers are telling you. If your post-service survey doesn’t ask open-ended questions, consider following up with those who reported a negative (or thumbs down) experience and ask them for specific feedback.
Emily Stebbins, a contract manager at HubSpot, says, “I was always the most focused on customer satisfaction rate. If we were not solving the core issue(s) at hand, we were not satisfying our customers.”
Stebbins also stresses the importance of “asking the right questions, matching tone, and using comforting and helpful language … to assure movement and care.”
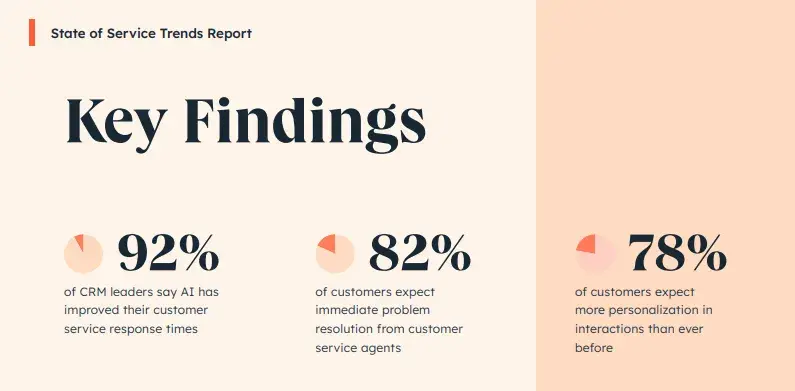
Pro tip: I recommend incorporating AI tools to improve customer satisfaction. Of the marketers surveyed in our report, 91% found that AI improved their customer service response time.
2. Average Ticket Count
Your average ticket count measures the average number of customer service or support tickets your team receives. You can measure these on a daily, weekly, monthly, quarterly, or yearly basis — or all of the above.
Navigating this can be extremely tricky when the number of tickets is higher than ever, and 82% of customers expect issues to be resolved immediately.
What Your Average Ticket Count Tells You
While more tickets can be a confirmation that your customer service system is accessible and working, it can also indicate customers are having frequent issues — and that your product or service may be falling short.
What to Look For When Measuring Your Average Ticket Count
Look for fewer tickets, which means fewer problems for your customers.
How to Improve Your Average Ticket Count
Communicate your customer feedback to your product and marketing teams so they can understand what your customers may be dealing with or asking questions about. Depending on the number of tickets you receive, ensure you have enough representatives on your customer service team to handle the ticket volume.
Pro tip: I recommend using HubSpot Service Hub to speed up ticket resolution time and reduce the amount of time customer service reps spend resolving tickets/issues — a win-win.
3. Average Response Time
Your average response time tracks how long your customer service team takes to respond to a conversation after opening a ticket.
This metric measures how quickly your customers are being helped, as well as how quickly each ticket can be resolved. As customers feel long holds and wait times are the most frustrating part of customer service, it’s important to factor this metric into your service practices.
With the vast majority of customers expecting their issues to be resolved immediately, reducing your average response time will ensure that you are responding promptly to their needs.
What Your Average Response Time Tells You
This metric tells you how quickly your customer service team solves issues and gets back to customers.
What to Look For When Measuring Your Average Response Time
Look for quick response times, which demonstrate to your customers that their issues are your priority… which can lead to positive customer satisfaction measures.
How to Improve Your Average Response Time
Make sure your team is equipped to solve issues and answer questions. If they’re dependent on a manager, trainer, or product specialist, it’ll likely take longer to get back to customers with answers and solutions. Also, ensure your team handles and resolves the proper number of tickets at once — whether that’s one, five, or ten. If they’re too overwhelmed, it could slow down your customer service process.
4. Average Ticket Resolution Time
Your average ticket resolution time measures how long your team takes to resolve each customer service or support ticket.
What Your Average Ticket Resolution Time Tells You
This metric tells you about the efficiency of your customer service team and, potentially, the complexity of issues from your customers.
What to Look For When Measuring Your Average Ticket Resolution Time
Look for short resolution times, which means that your customers’ issues are being solved quickly — and more customers are walking away satisfied.
How to Improve Your Average Ticket Resolution Time
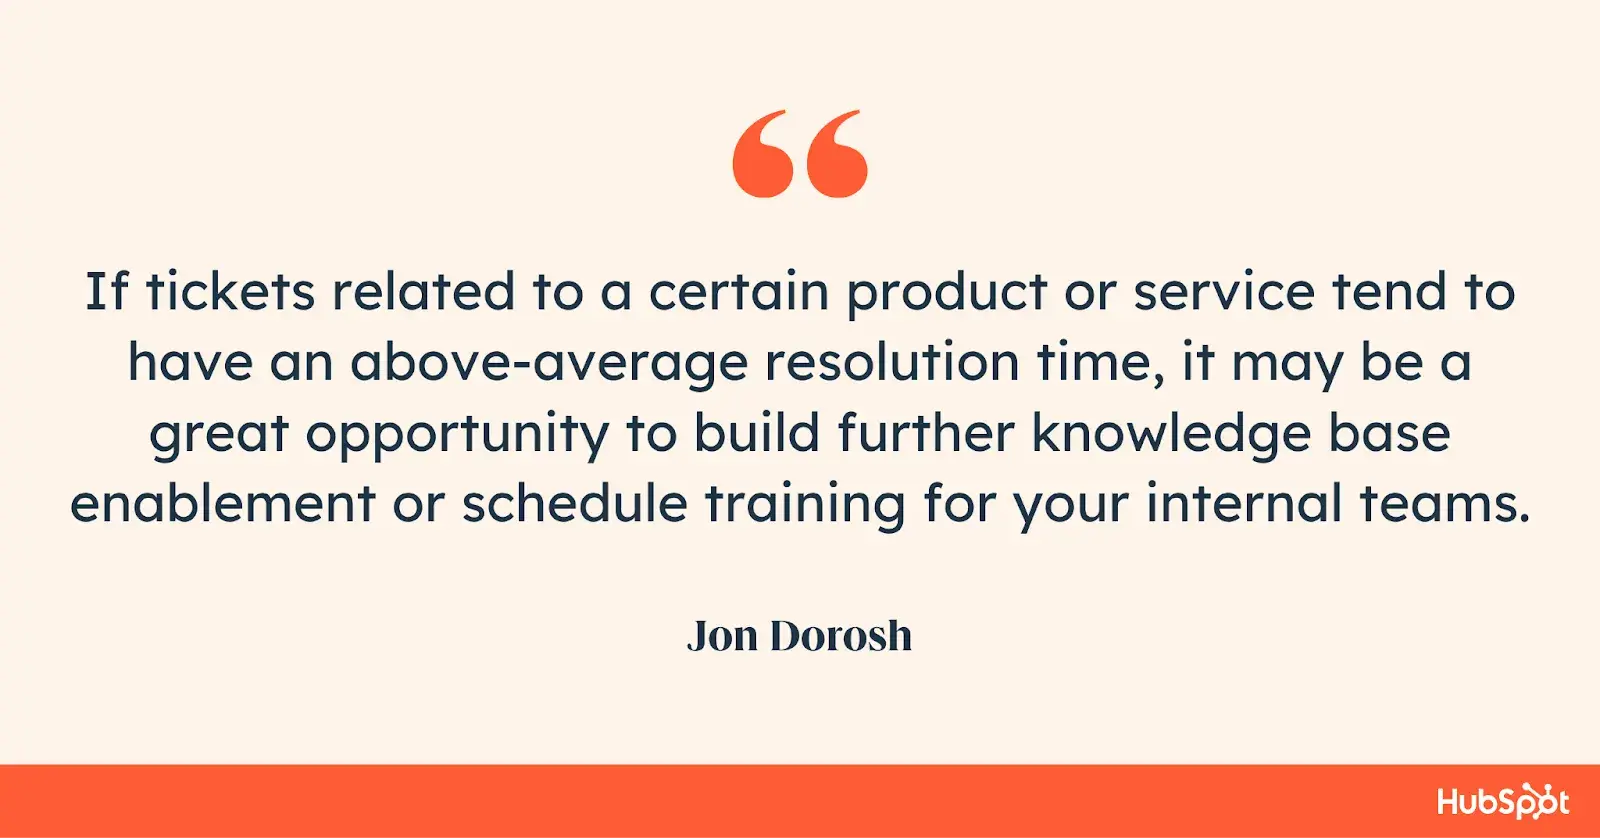
Take a look at the initial message your team sends to each customer. Make sure reps ask thoughtful questions and encourage the customer to explain their problem in detail. Also, ensure your team is well-versed in your products or services so they can respond and resolve issues quickly without having to reach out to other teams for help — thus lengthening the process. An internal knowledge base can also go a long way in giving reps the info they need to solve customer problems.
In addition, take note of tickets filed for the same issue. Jon Dorosh, a senior customer success manager at HubSpot, says, “If tickets related to a certain product or service tend to have an above-average resolution time, it may be a great opportunity to build further knowledge base enablement or schedule training for your internal teams.”
Pro tip: AI-powered reps will also be extremely useful in helping you efficiently meet the needs of modern customers.
5. Ticket Resolution Rate
Your ticket resolution rate measures how many issues are fully resolved in comparison to those that haven’t yet been resolved. This metric is also measured based on a period of time, like daily, weekly, or monthly.
You can also compare your ticket resolution rate to your ticket backlog to see how many tickets remain unresolved each day, week, or month. What constitutes a fast or slow ticket resolution rate will depend on other benchmarks you set for your team: ticket backlog amount, average response time, etc.
Calculate the ticket resolution rate using this formula:
Resolved Tickets / Total Tickets x 100 = Ticket Resolution Rate (%)
What Your Ticket Resolution Rate Tells You
This metric tells you how quickly and efficiently your customer service team is solving — and closing — tickets.
What to Look For When Measuring Your Ticket Resolution Rate
Look for a high rate, meaning fewer tickets are left unresolved.
How to Improve Your Ticket Resolution Rate
Be sure you have enough representatives to handle all of the tickets you receive. Are there other issues or distractions keeping your representatives from handling their assigned tickets and taking on new ones?
Free Customer Service Metrics Calculator
Calculate your business's key metrics and KPIs for customer support, service, and success with this free template.
- Customer Acquisition Cost
- Customer Lifetime Value
- Customer Satisfaction Score
- And More!
Download Free
All fields are required.
Form not available
6. Preferred Communication Channel
The preferred communication channel isn’t as much a metric as it is an observation of how your customers prefer to contact you. Whether through email, live chat, social media, web form, or phone calls, keep track of how your customers reach out to you.
Customers also now expect omnichannel support across platforms.
According to the State of Service report, marketing leaders say the most effective customer service channels are:
- AI chatbots.
- Online chat with a human rep.
- In-person.
- Social media.
- Over the phone.
- Messaging apps.
What Your Preferred Communication Channel Tells You
This information tells you how your customers prefer to communicate with your business and what channels you should focus on and improve.
What to Look For When Measuring Your Preferred Communication Channel
You’re not necessarily looking for one channel in particular, but take note of customer patterns. These can help guide your customer service and support analysis.
How to Improve Your Preferred Communication Channel
Considering that ticket volume has increased significantly across all channels, offering omnichannel support is crucial.
In fact, according to research by the HubSpot Blog, 70% of service leaders say customer service needs to be available across every channel customers use.
Luckily, offering omnichannel support is one of the highest ROI strategies you can use. And using AI chatbots to increase your omnichannel support is one of the leading trends among marketers today.
7. Service Level Agreement (SLA)
A service level agreement (SLA) helps teams prioritize incoming tickets based on their importance and any pressing time constraints. They’re typically made between a business and its customer to ensure agents deliver on expectations.
What Your SLA Rate Tells You
Your SLA rate tells you how well you meet customer expectations, whether you can meet expectations on time, deliver solutions, and follow through on what you say you’ll do.
What to Look For When Monitoring SLA
When monitoring your SLA, refer back to the initial agreements you set with the customer. If they wanted a solution in a specific time frame, did you meet it? Your SLAs should contain the information that helps you understand whether you’ve performed or not, and it should be your main point of reference.
How to Improve Your SLA
Rachel Ang, a senior customer support specialist at HubSpot, says that consistently achieving the SLA for first response time set with customers helps build trust.
“Workflow automation software can help you and your teams improve your SLA rate,” says Ang, “as you can set up tickets, prioritize tasks, and set up notifications for SLA expiry dates, which can help reduce the likelihood of late resolutions or missed follow-up.”
8. Ticket Backlog
Your ticket backlog is a measure of how many unresolved tickets are waiting to be handled by your customer service team. This metric can also be measured against daily, weekly, or monthly increments.
What constitutes a “backlog” is subjective. Once you decide on your response and resolution time goals, any unresolved tickets beyond these benchmarks could be considered backlogged.
While speed isn’t the most important metric in customer service, it’s still critical to providing a positive customer service experience.
What Your Ticket Backlog Tells You
This metric communicates how fast your team is reaching, responding to, and resolving your tickets and how quickly tickets are coming in from customers.
What to Look For When Measuring Your Ticket Backlog
Look for fewer tickets in your backlog, as it would mean your team has an efficient and effective response time.
How to Improve Your Ticket Backlog
Understand your customer service process from start to finish. Are there any kinks slowing your representatives and inhibiting them from working on a new ticket? Do you have enough representatives to cover the number of tickets you’re receiving?
9. First Response Time
Your first response time measures how long it takes for a member of your customer service team to first respond to a new ticket or inquiry — essentially, how long a customer has to wait before they are helped.
As I said above, speed isn’t everything in customer service, but it sure provides a positive, enjoyable experience. Nowadays, customers expect to engage with someone immediately.
What Your First Response Time Tells You
This metric tells you how efficient your customer service team is and how long it takes them to open new tickets and respond to customers.
What to Look For When Measuring Your First Response Time
Look for less wait time for customers, which means a positive customer experience.
How to Improve Your First Response Time
Ensure nothing is holding your team back from opening new tickets and sending an initial response. Encourage your team to juggle a few tickets at once so newer customers feel that their inquiries have been heard or seen. As always, make sure your team is well-staffed to handle all your tickets.
10. First Contact Resolution Rate
Your first contact resolution (FCR) rate measures the rate of tickets resolved by your team’s first response to a customer inquiry. This is an important metric as it indicates how clearly and efficiently your team communicates and how much information you ask your customers to share when they first reach out.
In case you’re wondering, the average FCR is around 70%, a “good” FCR is between 70% and 79%, and a “world-class” one is over 80%.
However, not every issue is eligible for an FCR, especially if the customer makes a mistake or your representative has to consult with the product or IT teams.
When calculating FCR rate, consider this formula (instead of including all tickets in your calculation):
FCR Tickets/Total FCR-Eligible Tickets X 100 = FCR Rate (%)
![] customer service metrics: an example of the first contact resolution rate formula](https://53.fs1.hubspotusercontent-na1.net/hubfs/53/measuring-customer-service-4-20241219-1147413.webp)
What Your FCR Rate Tells You
This metric tells you how efficient your customer service team is and how clearly they communicate and attempt to understand your customers’ problems. It also shows you how precise your customer support “instructions” are (i.e., how clearly you communicate the information you need from a customer to help them).
What to Look For When Measuring Your FCR Rate
Look for a high FCR rate, which means that your customer service team is communicating clearly and your customers understand what you need from them in order to help.
How to Improve Your FCR Rate
What do you tell customers you need from them to receive support? What form fields do you have in your customer support web form? The more information you request — and customers provide — upon initial contact, the quicker your customer service team can provide support.
11. Number of Interactions Per Ticket
The number of interactions per ticket measures how many times your customer service team interacts with the customer while their ticket is open and unresolved.
This metric can measure the number of interactions one service rep has with the ticket or the number of interactions that happen if the customer is passed around to different representatives before coming to a solution.
Considering that 92% of survey respondents say they’d spend more money with companies that ensure they won’t need to repeat information, the number of interactions per ticket is a critical metric.
What Your Number of Interactions Per Ticket Tells You
This metric shows you how effective each message or interaction from your customer service team is.
What to Look For When Measuring Your Number of Interactions Per Ticket
Look for fewer interactions per ticket, which means your team communicates clearly, asks the right questions, and works hard to solve each problem swiftly.
How to Improve Your Number of Interactions Per Ticket
Challenge your customer service and support teams to communicate clearly and reply with thoughtful questions. Ask them to encourage customers to explain their issues exhaustively, so your team can help them without so much back-and-forth. After all, 31% of consumers say that having to repeat themselves is their biggest frustration.
Exploring Additional Customer Service Metrics
In addition to the top 11 customer service metrics I’ve detailed here, many businesses include specific customer success and customer satisfaction metrics in their scoring. These metrics may include their Net Promoter Score (NPS) or customer retention and churn rates.
It’s up to you how you organize these metrics; we’ve detailed them in separate blog posts on customer success metrics and customer satisfaction metrics.
Track your customer service to create the best customer experience possible.
Customer service and support are multifaceted and multidisciplinary functions. These teams deal with countless customer issues, questions, and concerns regarding your products or services and their experience working with your business.
For this reason, customer experience doesn’t have the same cut-and-dried metrics as other business functions, but that doesn’t mean it's not important to measure. In fact, it’s arguably the most crucial factor to measure because it’s one of the most direct customer touchpoints in your business.
Well-performing customer service departments lead to happy customers, and happy customers are your best marketers. So, use these metrics to improve your customer service and support processes — and boost your business’s bottom line.
Editor's note: This article was originally published in June 2018 and has since been updated for comprehensiveness.
Free Customer Service Metrics Calculator
Calculate your business's key metrics and KPIs for customer support, service, and success with this free template.
- Customer Acquisition Cost
- Customer Lifetime Value
- Customer Satisfaction Score
- And More!
Download Free
All fields are required.
Form not available