
I’m not saying I’ve reached total mastery — there’s always something new to pick up — but I’m vastly more comfortable. And I want you to be, too. So, here’s the cheat sheet for Google Analytics/GA4. This extensive guide will take you from zero to hero in just over 2,000 words. And if you still have questions, let me know! I’m @ajavuu on Twitter.
Table of Contents
- What is Google Analytics?
- Is Google Analytics Free?
- Should you use Google Analytics?
- How to Set Up Google Analytics
- Understanding the Basics of Google Analytics
- Google Analytics Reports
- Now You’re Ready to Track
An Introduction to Data Analytics
Unlock the power of data and transform your business with HubSpot's comprehensive guide to data analytics.
- Fundamentals of data analytics
- Different types of data analytics
- Data visualization
- And more!
Download Free
All fields are required.
What is Google Analytics?
Google Analytics, or GA, is a free analytics tool that gives you an in-depth look at your website and/or app performance. It integrates with Google's marketing and advertising platforms and products (including Google Ads, Search Console, and Data Studio), making it a popular choice for anyone using multiple Google tools.
Is Google Analytics Free?
There's a free and a paid version of GA (the latter is called Analytics 360). Small and medium-sized businesses will likely get all the features you need from the free version. Analytics 360 begins at $150,000 annually (invoiced monthly) and increases after your site receives more than one billion monthly hits.
You may find it helpful to upgrade to Analytics 360 later down the line as your business grows and you need more sophisticated features to manage and track important metrics. However, you should be fine with the free version until then.
Should you use Google Analytics?
If you want a lot of data — and more importantly, have the time and ability to analyze and act on it — GA is a great fit. However, GA takes time to set up, learn, implement, maintain, and use.
Other marketing analytics options, such as HubSpot, can give you all the data you need with much less work.
Now, what steps will you need to follow when setting up GA? Good question.
How to Set Up Google Analytics
- Create a Google Analytics account.
- Add the name, URL, and industry of the website you want to track.
- Add a view to your property.
- Add your tracking code directly after the head tag of your site.
- Visit your GA portal and verify the code is working.
Before you can use Google Analytics, you must set up a Google account. This means you must have a registered Google Account email address and password.
Once you've created a Google account, that doesn‘t mean you automatically have access to GA — instead, you have to register for Analytics (which we’ll review how to do in the next section). However, the important thing to note as you go to set up GA is that you can only access the tool by using a valid Google account.
Here are the steps for using Google Analytics on your website. (I'm using my class reunion website as an example.)
Step 1: Create a Google Analytics account.
First, you'll have to create a Google Analytics account. Or, sign in to your current account.
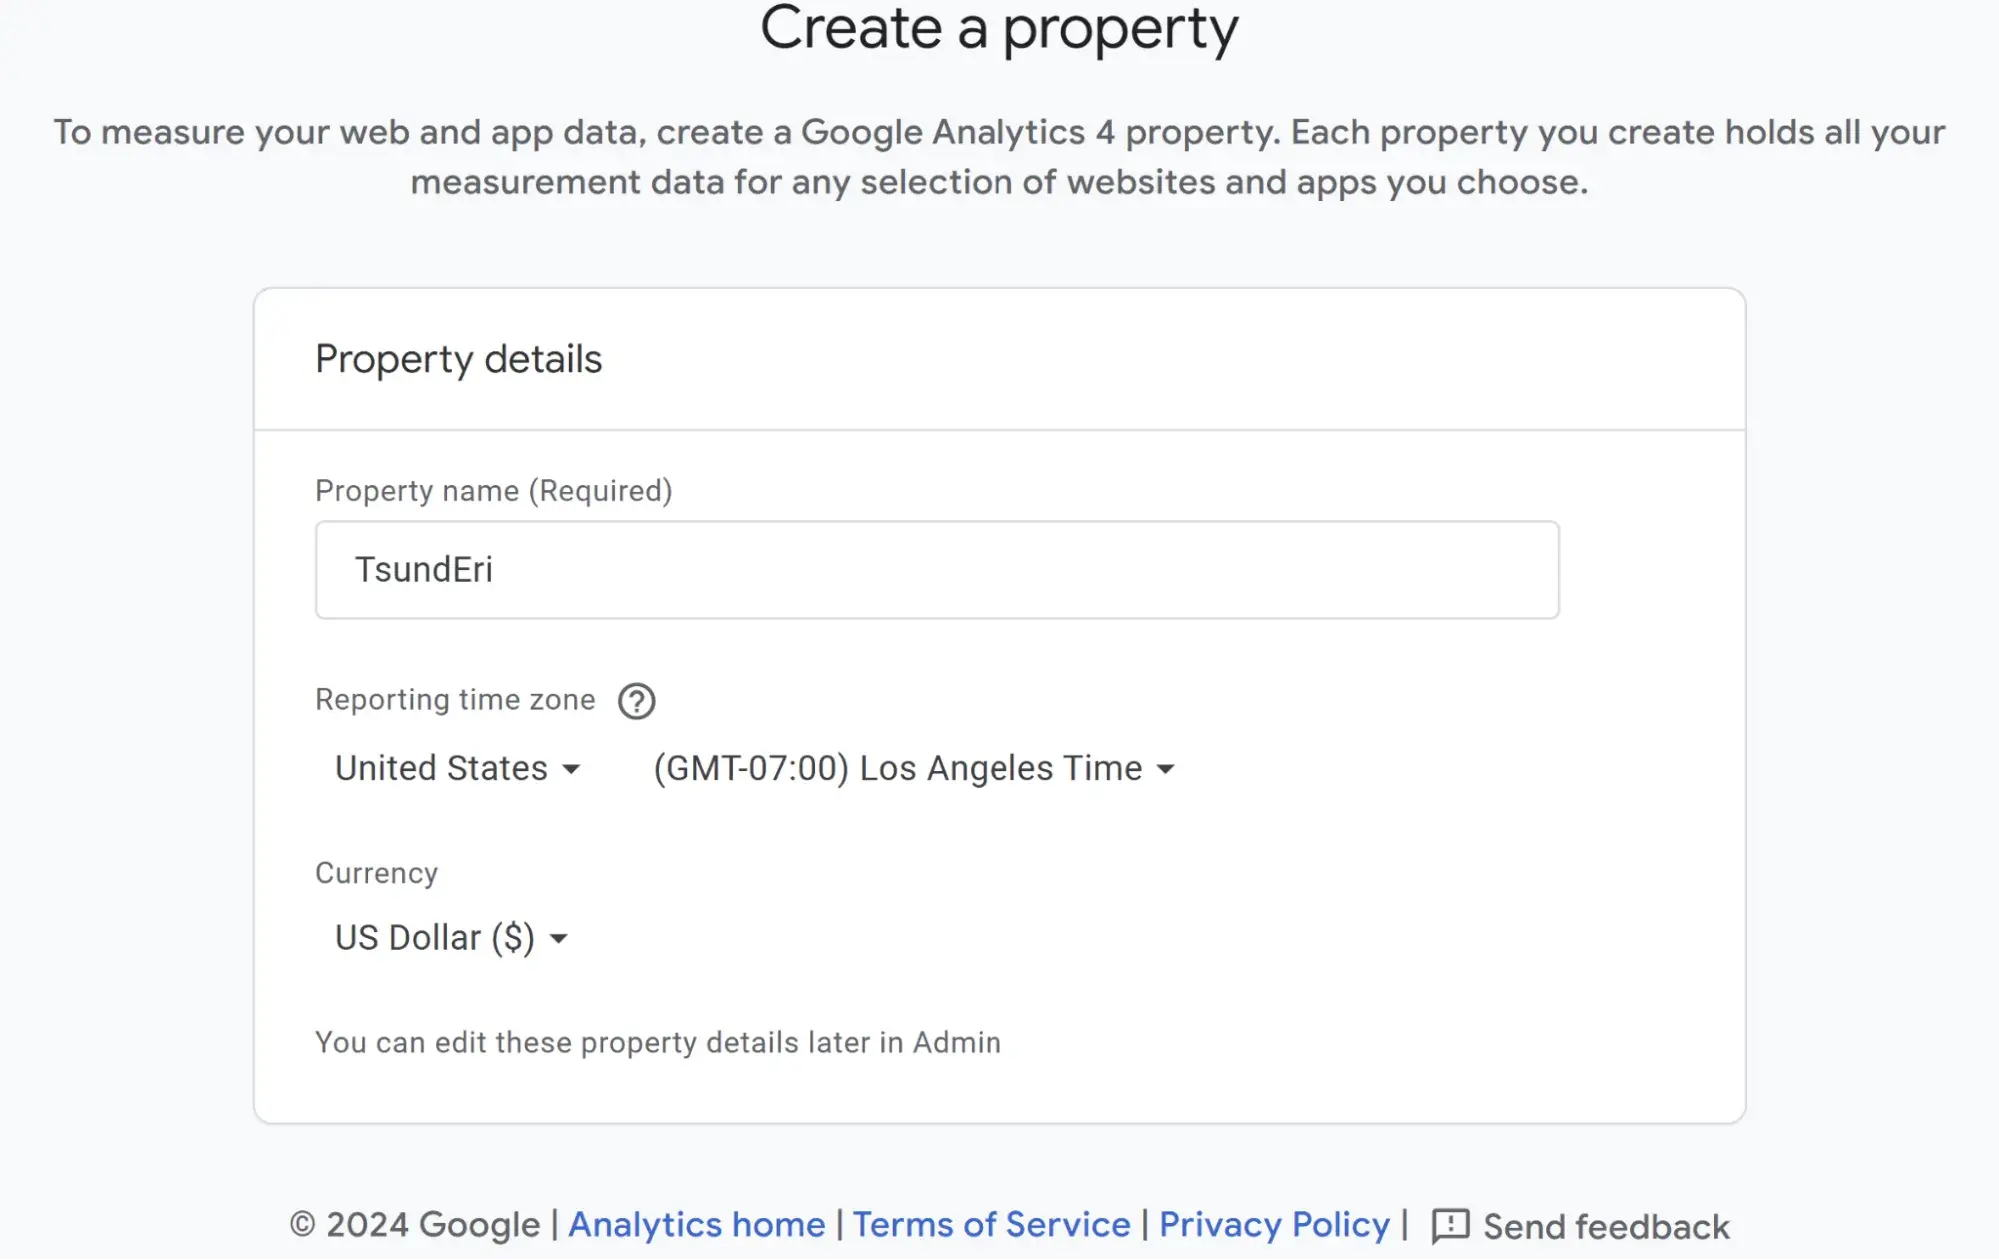
Step 2: Add the name, URL, and industry of the website you want to track.
Choose which account you want to add the property to. In my case, I chose to track this blog on my account.
At this point, you should create and name your Property and enter the website's URL, industry, and reporting time zone.
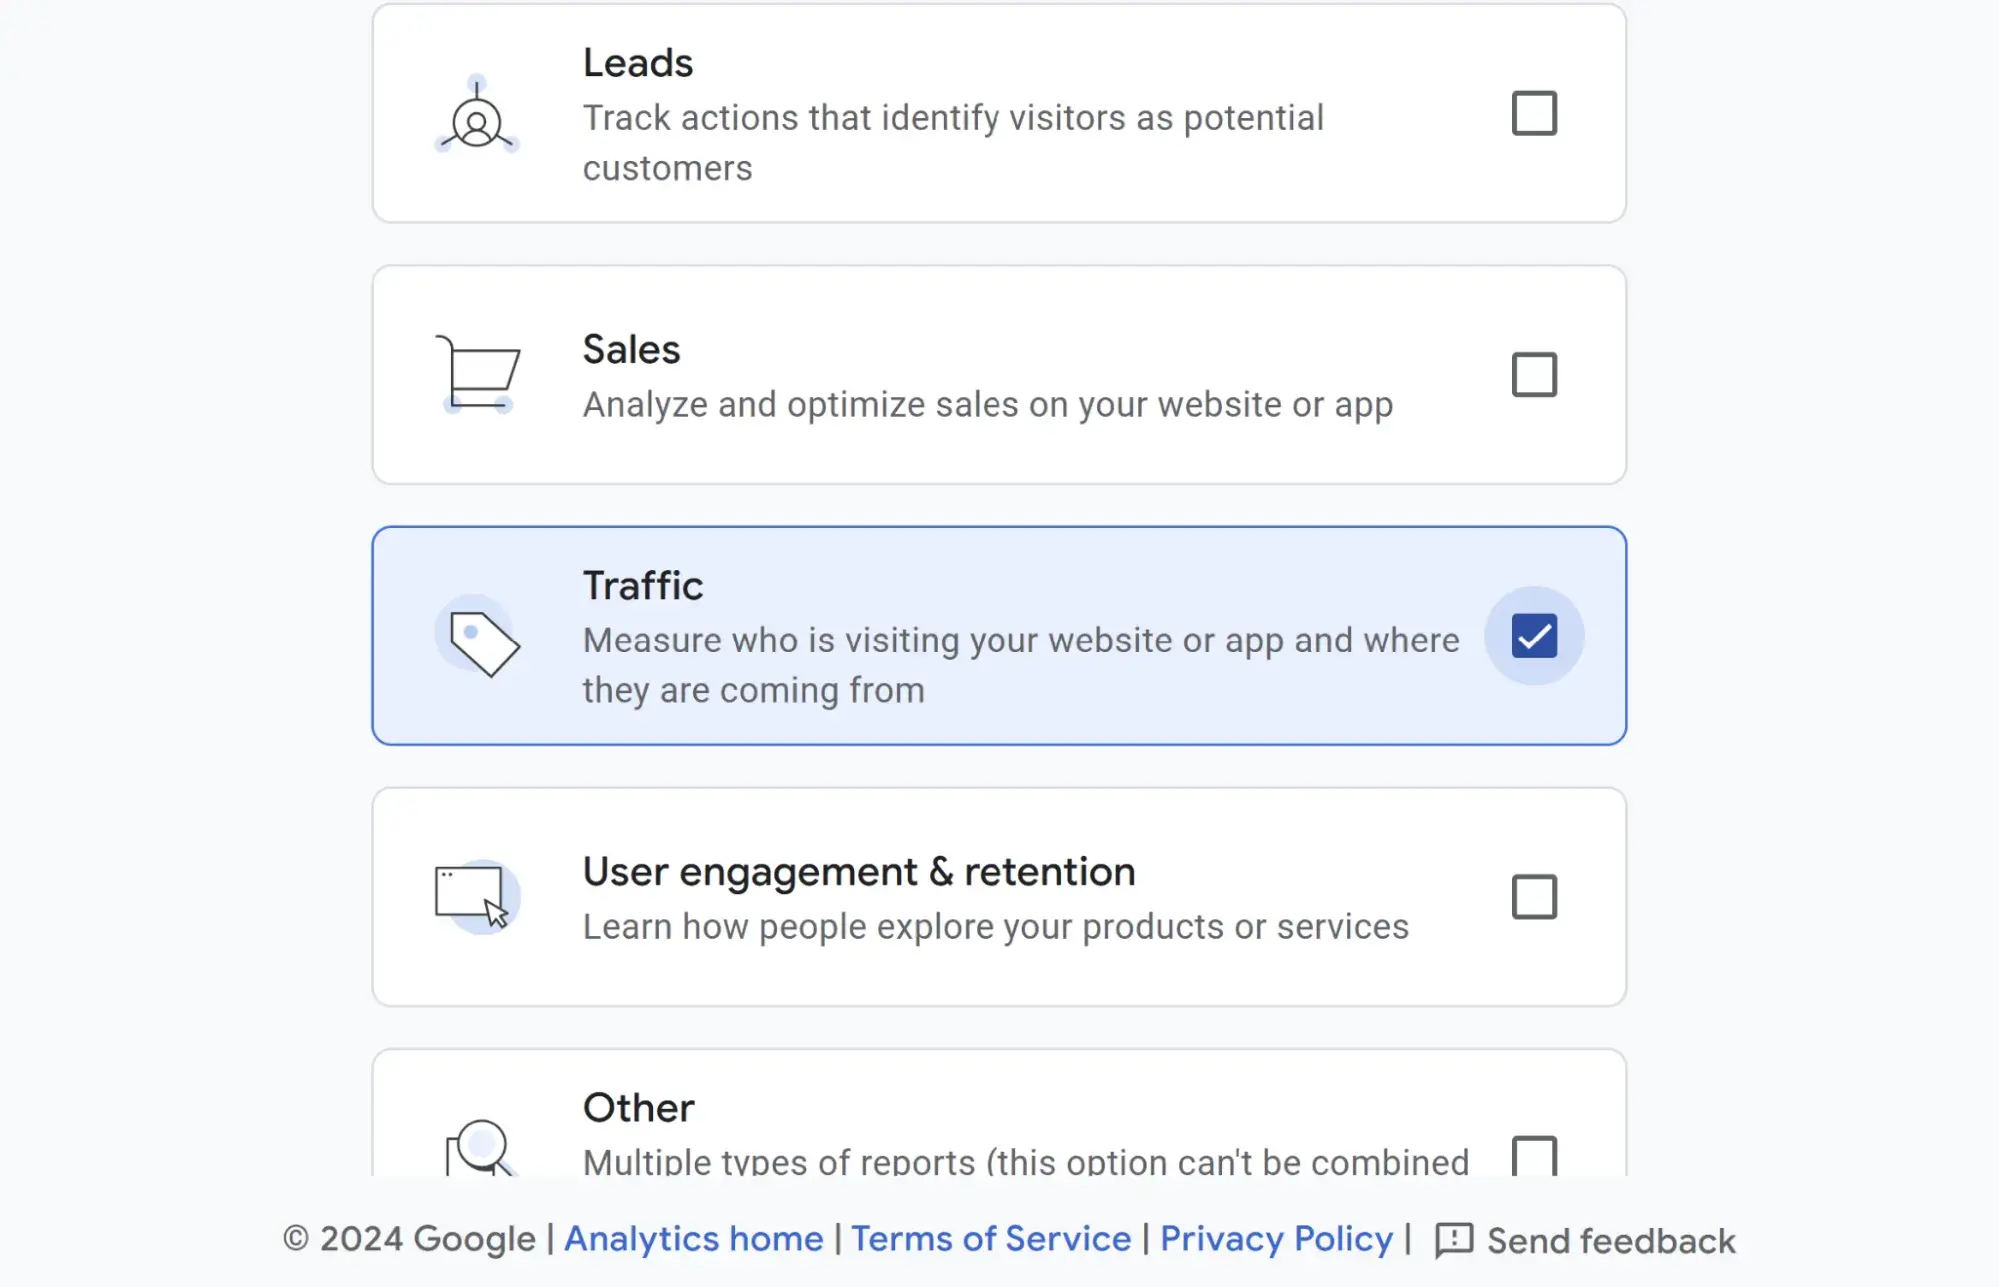
Step 3: Specify what you're trying to track.
Do you want to track leads, sales, traffic, or something else? Make sure to select what you're most interested in. I selected traffic for my website.
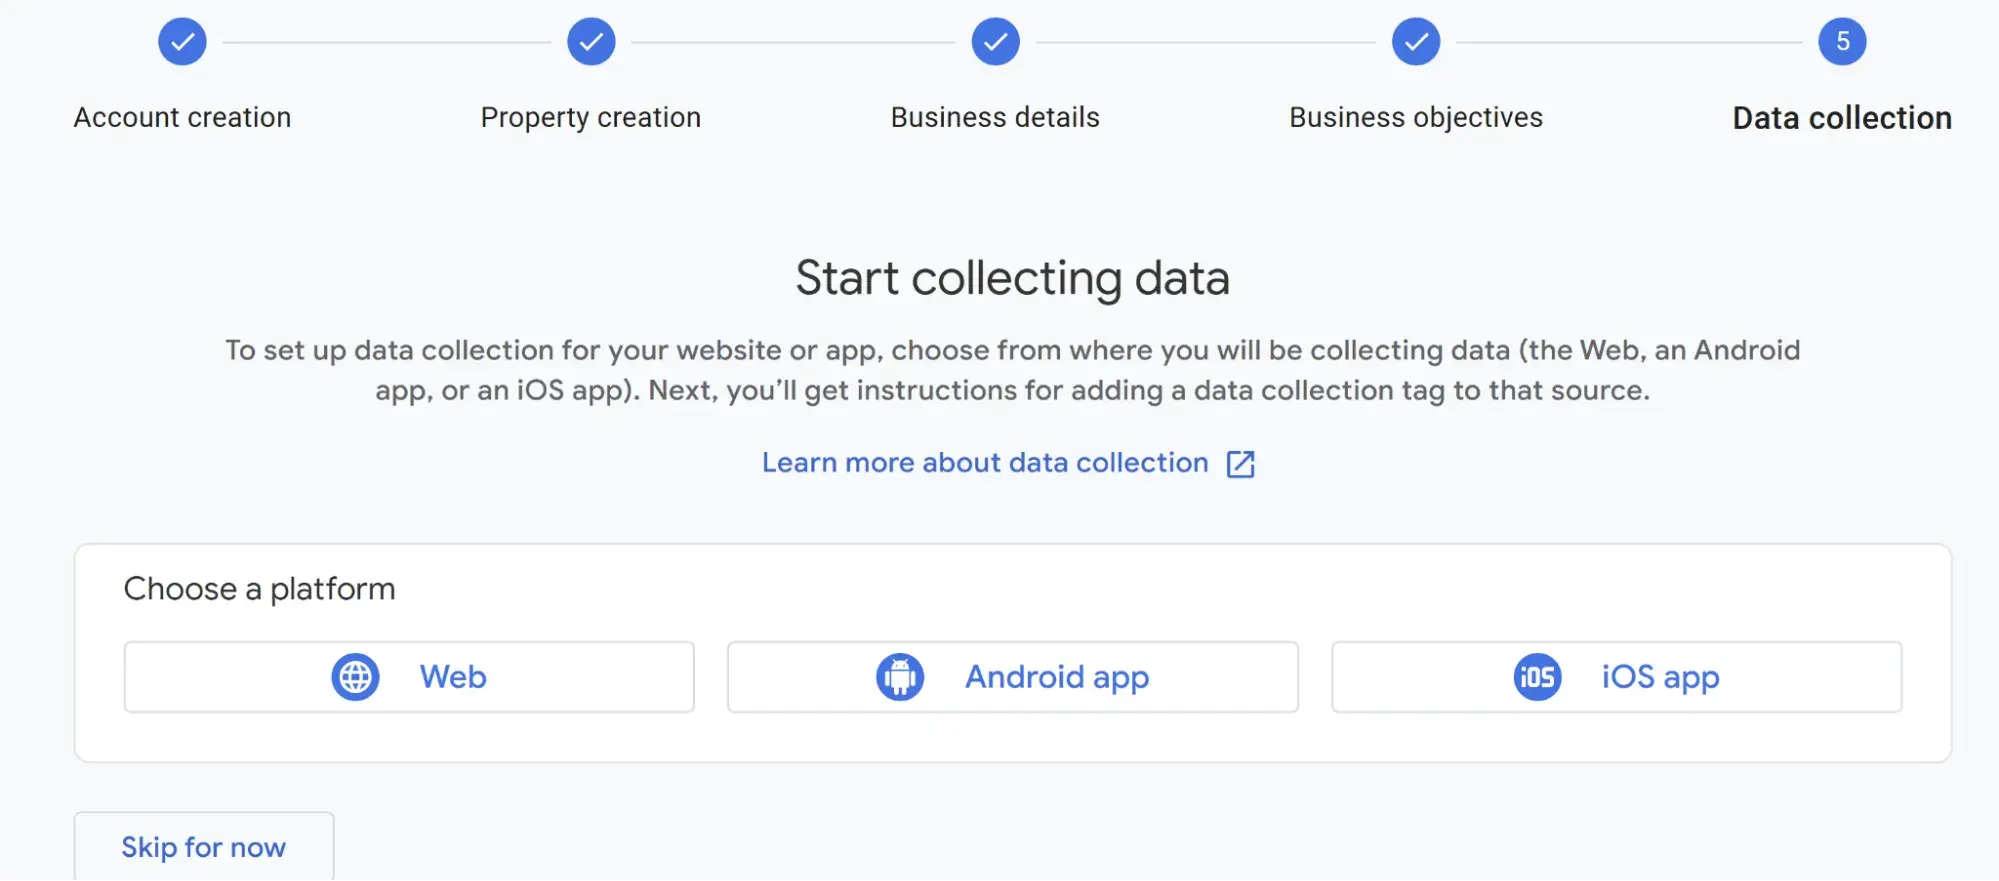
Step 4: Choose from where you'll be collecting data.
This part is super easy. Just choose the platform from which you want to collect your data. You can choose between a website, Android app, or iOS app. I chose a website.
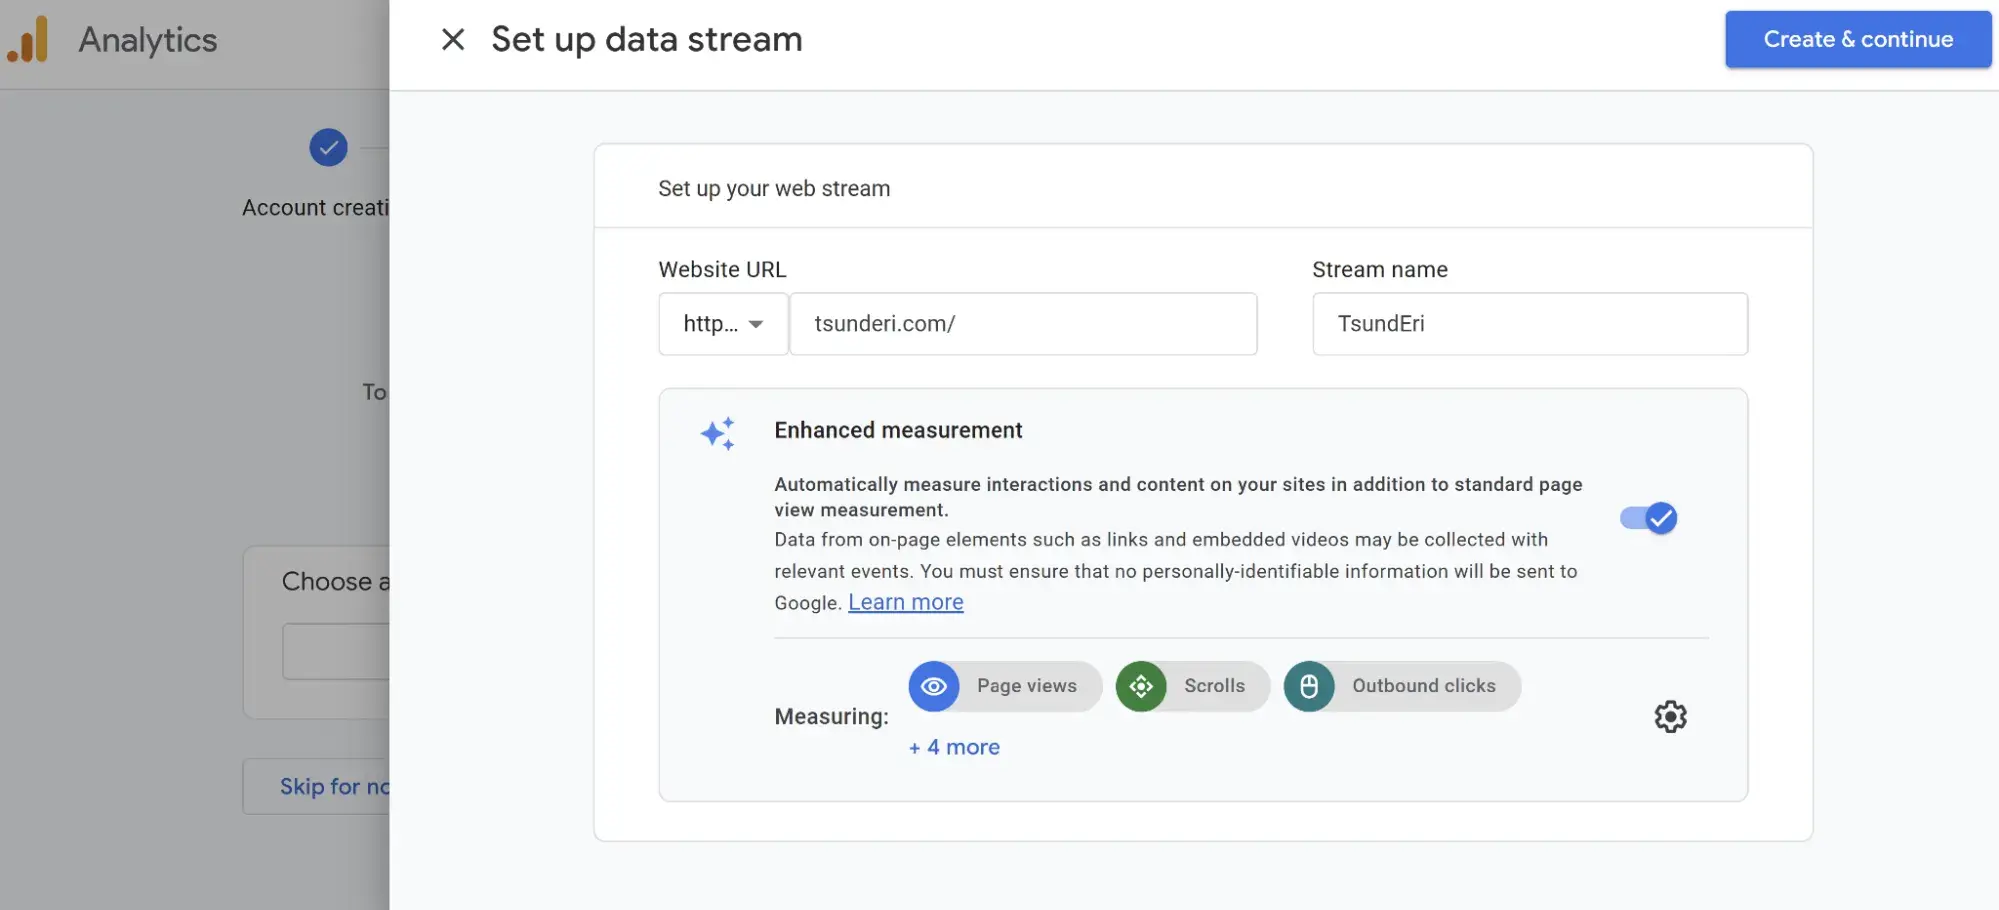
Step 5: Set up your data stream and set up your Google tag.
Enter the website URL you want to track and the stream's name. I just kept it simple and named the stream after my website.
You can also fiddle with enhanced measurements to get even more out of GA4.
From there, Google will give you a Google tag that you can either add manually or via a plugin, depending on the platform you use for your website. A Google tag is a code you need to add to each site page you want to measure. This is how you'll be able to collect data on your property.
Then, paste your global site tag right after the opening <head> tag on each site page you plan on measuring.
From there, GA4 will allow you to check if your tag is set up properly, and you can start tracking.
And that's pretty much it! After that review, you may be wondering the following:
Do you need to add the GA code to every page of your site?
That’s a lot of manual work — especially if your website has over 50 pages. Plus, what happens when you create new pages? Do you need to add the tag every time?!
The short answer is no.
The longer answer: you only need to add the tag to every page template. So, if you have a one-page type on your site (meaning every individual page uses the same header module), you only need to add it to that module — and it’ll be applied to every page.
If you have two-page types, you must paste the code into the two separate header modules. Three-page types? Three header modules.
If you use HubSpot's Content Hub, this task is even easier. These tools have a separate field where you paste your tracking code just once. HubSpot users can follow these simple instructions to add GA.
Additionally, to set up GA properly, you'll want to understand the various layers of the tool — specifically, the hierarchy.
HubSpot Marketing Analytics Software
Measure the performance of all your marketing campaigns in one place with built-in analytics, reports, and dashboards.
- Marketing Analytics
- Dashboard Software
- Website KPIs
- And More!
Understanding the Basics of Google Analytics
Google Analytics comprises many parts, so it's important to have a clear lay of the land as you begin learning. This section is dedicated to Google Analytics guidelines to help you master the basics of this powerful tool.
Google Analytics Hierarchy
1. Organization
The organization is at the highest level. It represents a company. For example, our organization is HubSpot, Inc. One organization can encompass multiple GA accounts.
Organizations are recommended for larger businesses but are not mandatory.
2. Account(s)
Accounts are not optional. Using Google Analytics requires at least one account.
An account doesn’t mean a user account. I can log into the HubSpot Google Analytics accounts using my Google email ID. HubSpot’s head of technical SEO can also log into the same account using his Google email ID. Our historical optimization specialist can also log into the same account using his Google email ID.
Important details:
- You can assign one property to each account or multiple properties to one account. Every account can hold up to 2,000 properties.
- You can give user permissions for an entire Analytics account, a property in an account, or a view in a property.
You might wonder, “What’s better: creating a new account for every property or adding every account to the same property?”
It depends on your use case and goals.
For example, suppose you have one website — the Stark Industries corporate site — and five subdirectories, including the Stark Industries blog, careers section, media resources, case studies, and investor relations information.
You want to create separate properties for each subdirectory so the people on each team can see how their portion of the site is performing relative to the larger site.
But maybe you have another site that discusses Tony Stark’s work with S.H.I.E.L.D. You want the S.H.I.E.L.D. team to see data for this subdirectory, but you don’t want them to see data for the rest of the website. You create a new account and property for the S.H.I.E.L.D. site.
3. Property
A property is a container for your reports based on the data you collect via your apps and sites. There are two kinds of properties— Google Analytics 4 properties and 360. A GA4 property represents an app or website.
Let's say your business has an app in the Google Play or App Store in addition to a website. GA4 allows you to create a property just for the app or the app and website.
360 is for Analytics 360 customers and allows them to create two additional types of properties: subproperties and roll-up properties.
A subproperty gets its data from another property, and roll-up property gets its data from multiple other properties to give users a broad view of their business across products, brands, and regions.
4. Data Stream
A data stream in GA4 is a flow of data from a customer touch point. You can choose from three preset data streams: web, iOS, and Andriod. You can also choose to create a custom data stream.
GA4 Tools
Okay, we've talked about hierarchy, lets get into tools.
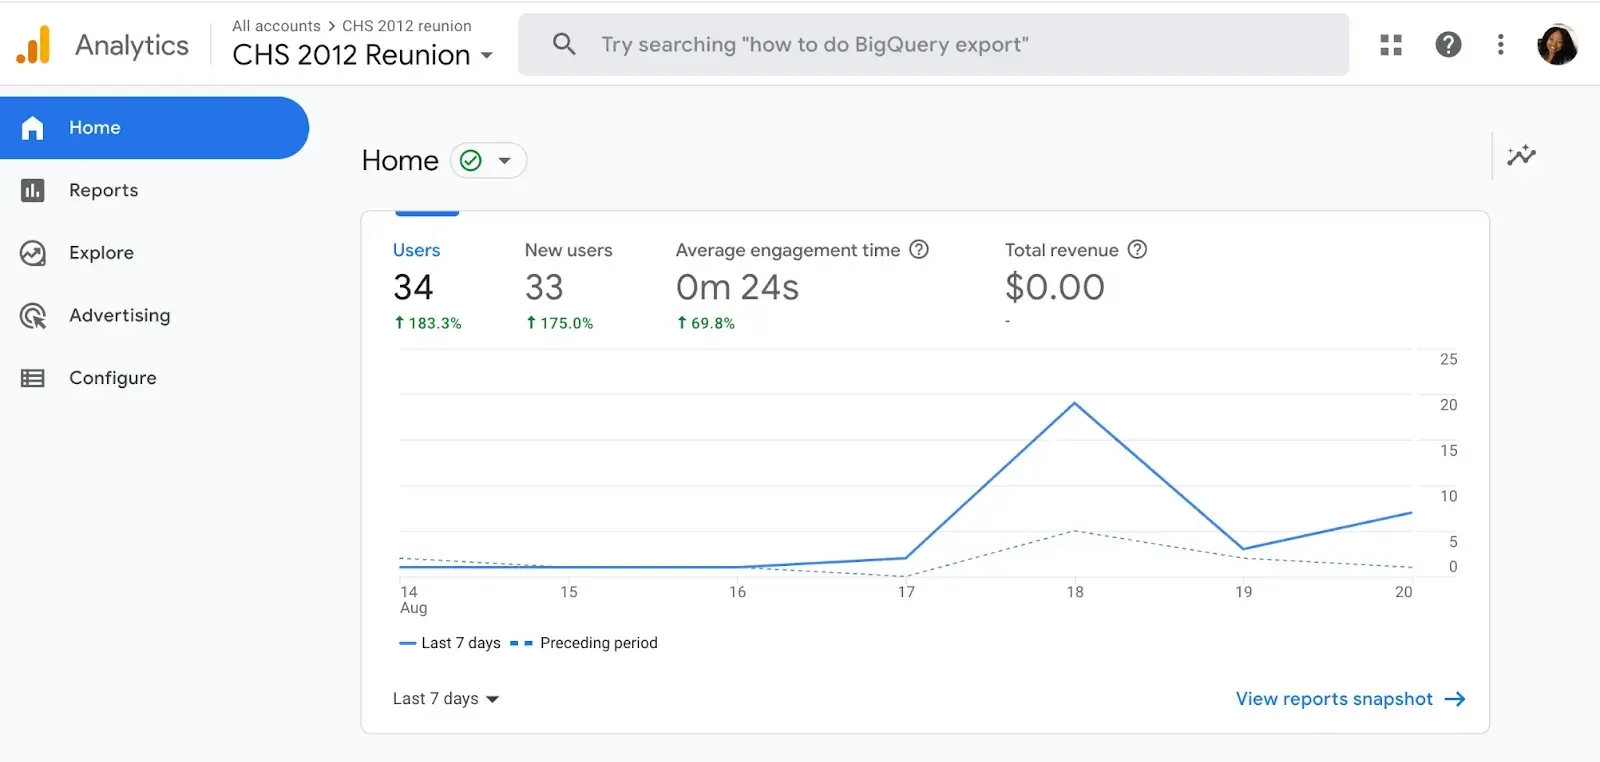
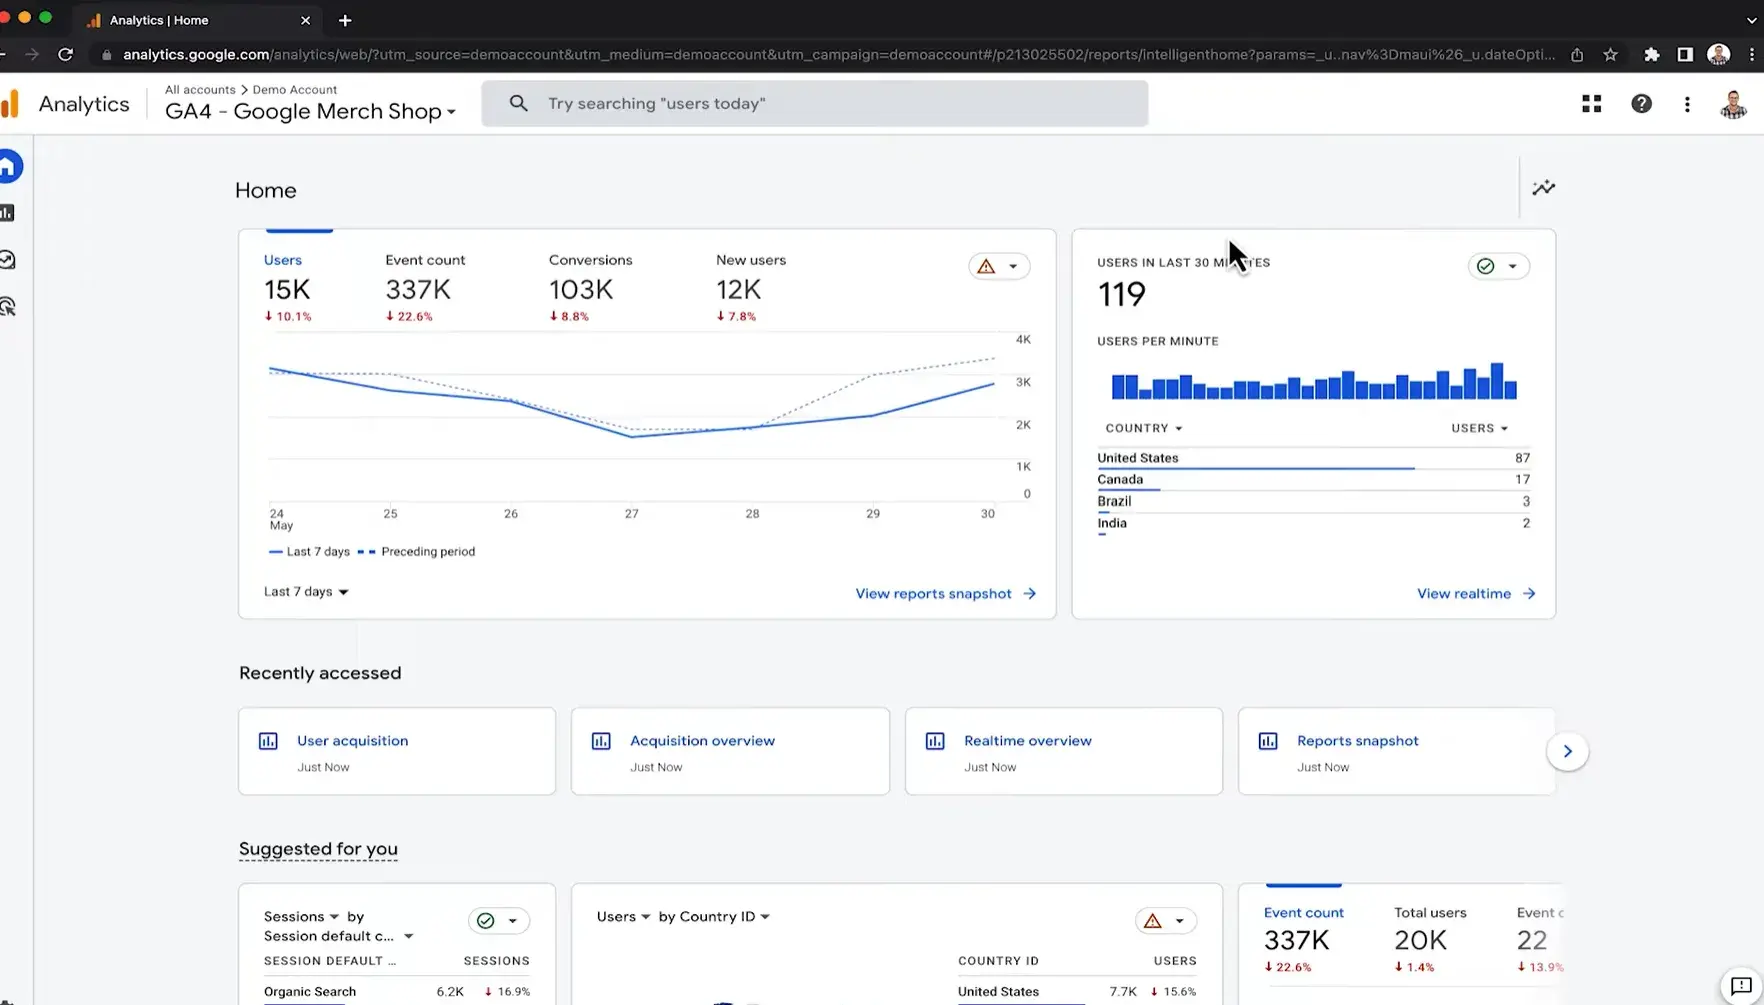
1. Home

The Home tab is a customizable dashboard of reports, stats, and other figures. You can adjust what you see in the Home tab so that you see a snapshot of the overall performance of your website.
In the example below, we can see users, new users, active engagement time, and total revenue because these metrics are most important for my site.
2. Reports
We‘ll dive deeper into reports later, but here’s a quick overview.
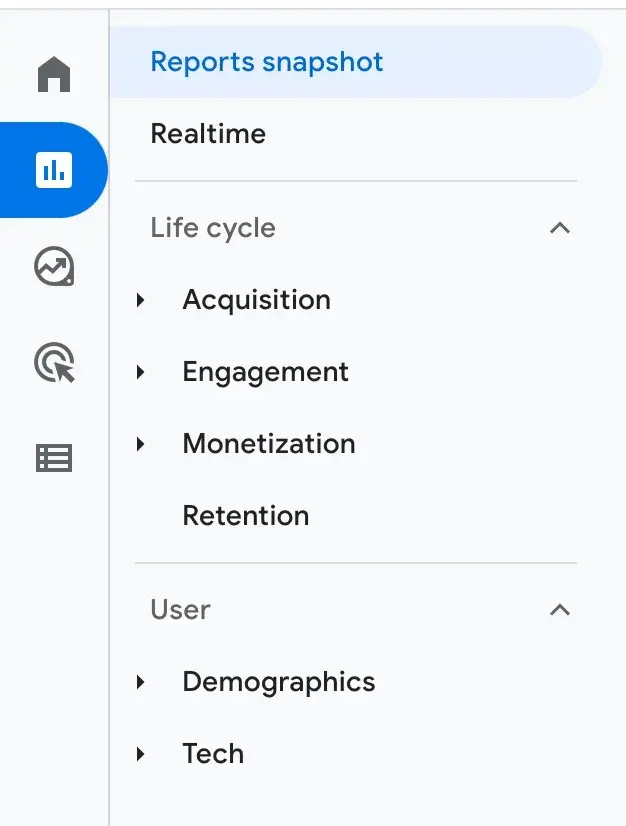
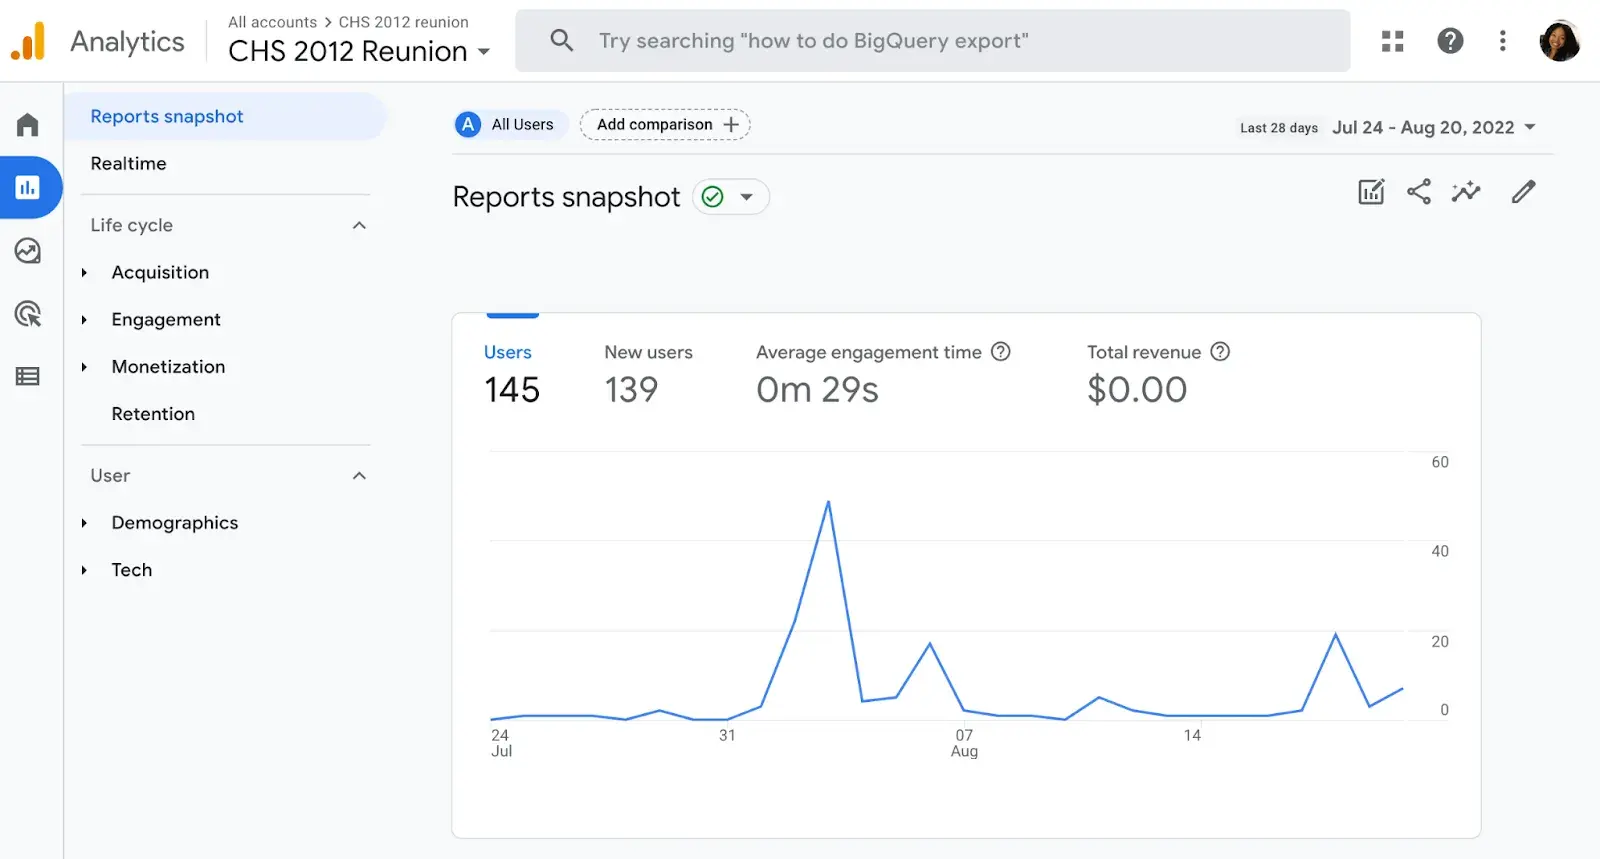
The Reports tab shows the Reports Snapshot first which includes the same information from the Home tab in this example.
You can also switch to other reports listed below:
- Reports Snapshot
- Realtime
- Life Cycle
- User
3. Explore

Explorations in Google Analytics let you look into the ways your visitors navigate your site to discover new pages and content. There are several preset explorations you can activate, or you can create a new one from scratch.
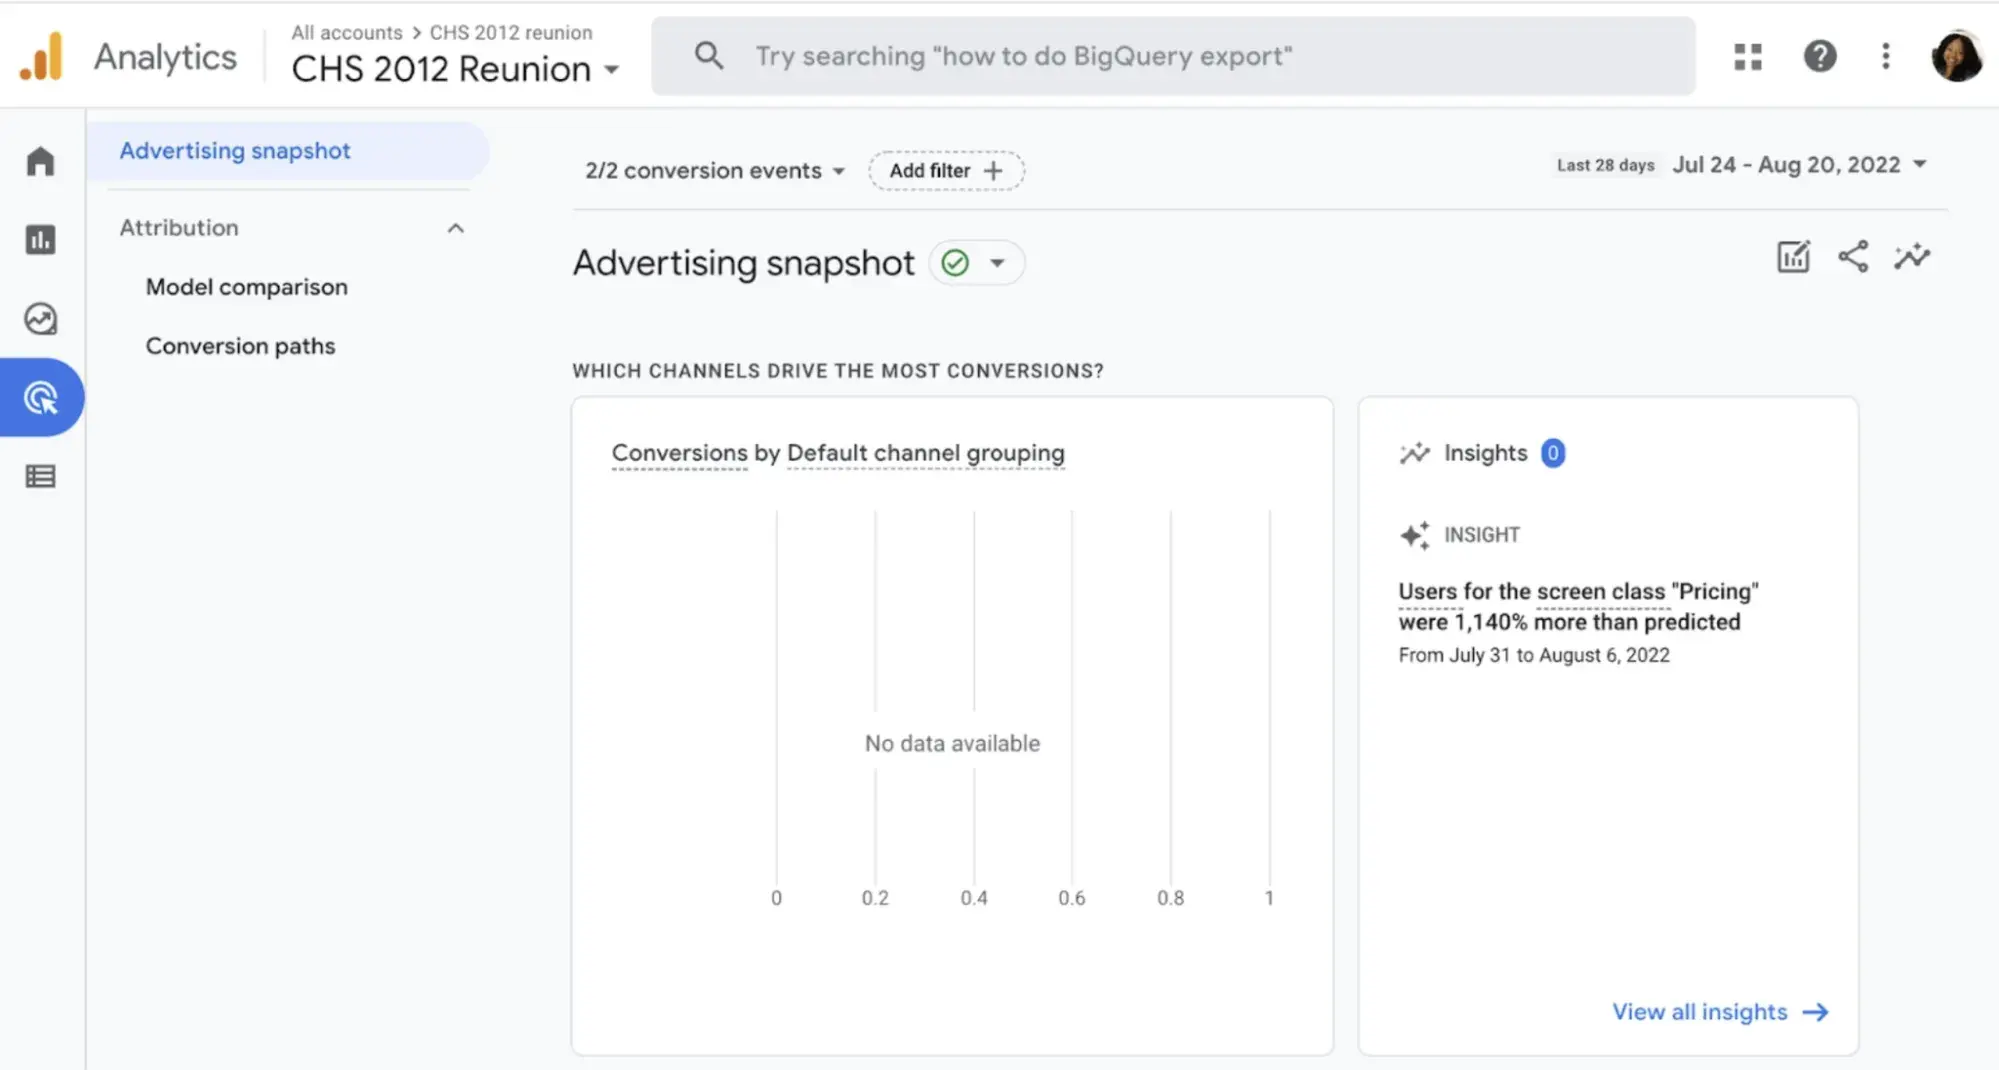
4. Advertising

When you click on the Advertising tab, you‘ll start on the Advertising snapshot screen. Here, you’ll see the channels and touchpoints that drive the most conversions on your site. In order for this tab to be most helpful, you'll need to set up goals and conversions in Google Analytics.
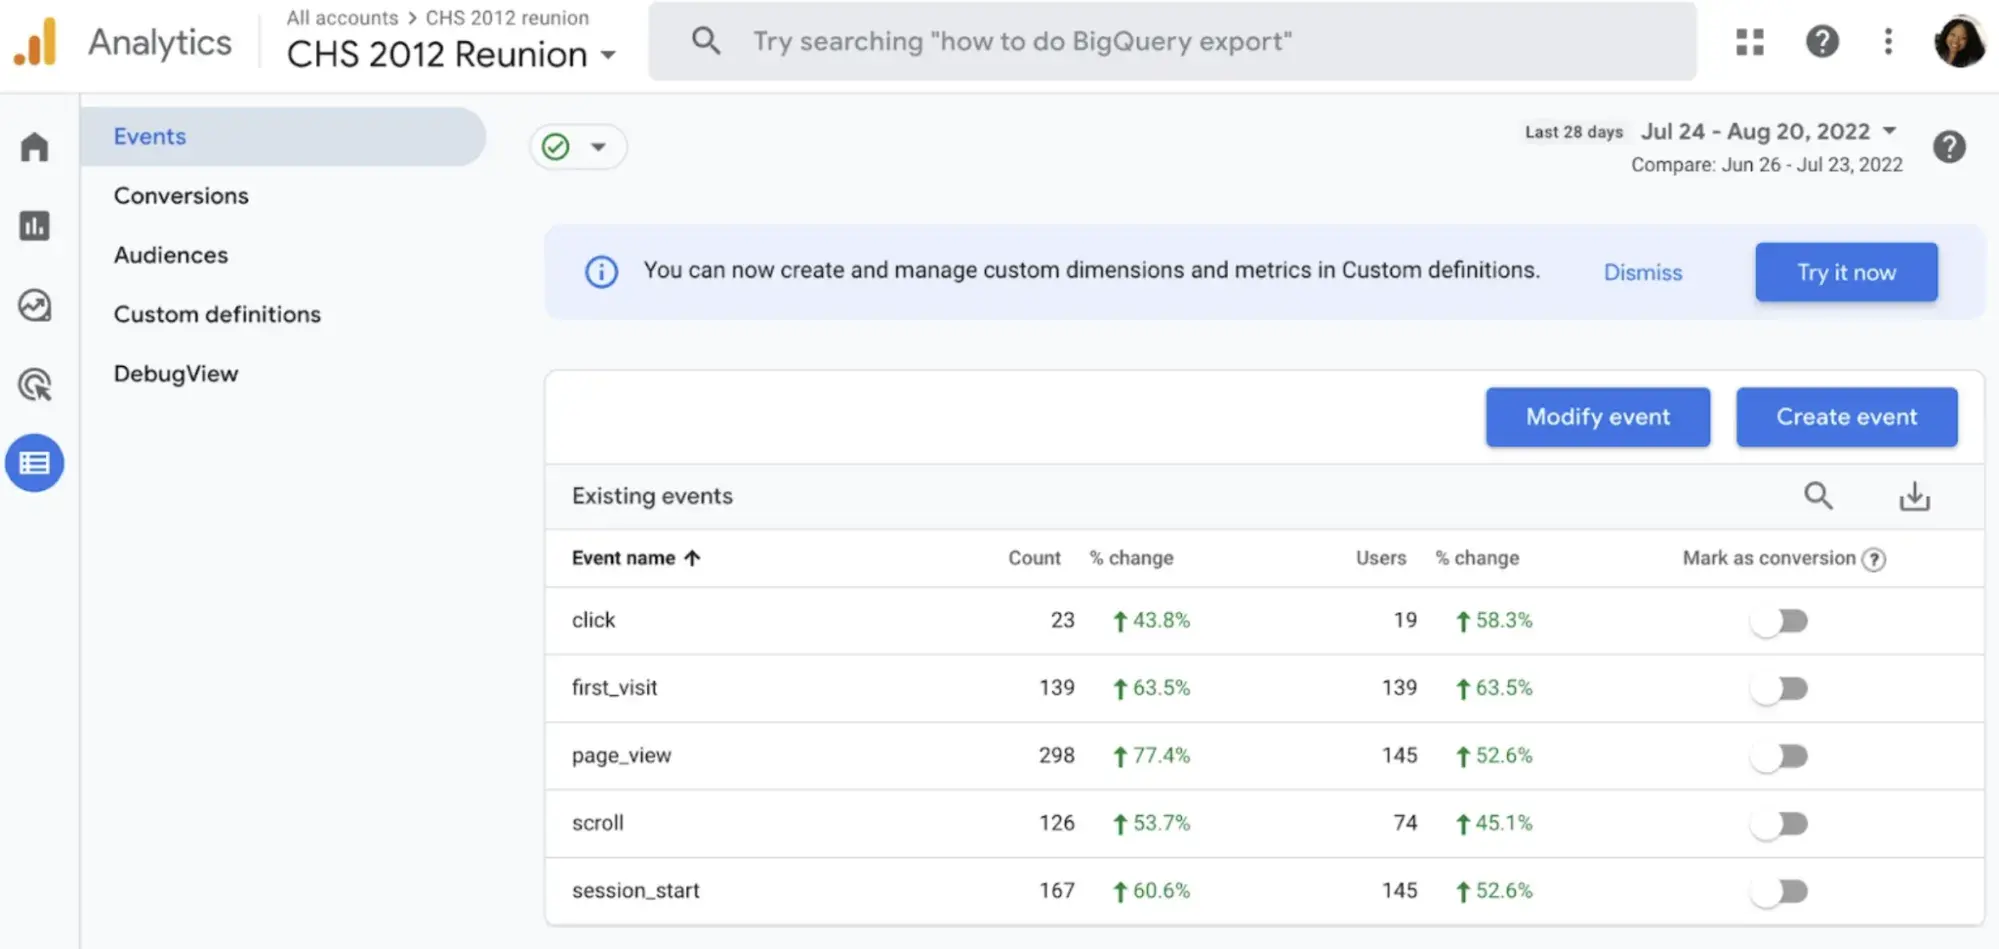
5. Configure

The Configure tab is where you'll set up key pieces of your reports including events, conversions, audiences, and other custom definitions.
As you get more familiar with your Google Analytics instance and the data you want to see, you can configure these settings to get a granular look into your data.
This will allow you to solve problems, answer questions, and make decisions that are specific to your site and the outcomes you want to achieve from it.
Google Analytics Reports
There are several reports available in Google Analytics that can give you insight into your website‘s performance. You’ll find these reports on the lefthand size of the screen.
All of these options can be a bit overwhelming. Let’s walk through the main reports together.
1. Real-Time Report
As the name suggests, the Real-Time report gives you insight into what’s happening on your site now. You can see how many visitors are on your site, which pages they’re visiting, which social platforms they’re coming from, where they’re located, and more.
While this report is fun to look at occasionally, it’s probably the least valuable. Here are some ways to use Real-Time:
- See how much traffic you’re getting from a new social or blog post
- Know immediately if a one-day sale or event is driving views and/or conversions
- Make sure tracking URLs and custom events that you’ve just set up are working as they should
These are useful, but as you’ll see, the other reports pack a far greater punch.
2. Audience Report
The GA Audience report gives you a high-level overview of the property you’re currently looking at. Check this report once a day to get a sense of how you’re trending overall.
The following metrics can be found in the Audience Report
- Active users
- Average session duration
- New users
- Sessions
- Views per session
- Total revenue
3. Google Analytics Acquisition Reports
To find these reports, click Reports, then Acquisition. You'll find three options:
- Overview
- User Acquisition
- Traffic Acquisition
Overview is an overall dashboard of your website's traffic that contains links to more detailed reports. User and Traffic Acquisitions focus on the sources of your traffic.
Now You’re Ready to Track
Google Analytics is a highly valuable tool for any business as it gives you tangible data to apply to grow your business. Bookmark this guide and return to it as your data tracking becomes more sophisticated.
Good luck on your Google Analytics journey.
Marketing Reporting Templates
Excel, PowerPoint, and Google Drive Templates to Make Your Monthly Reporting Faster and Easier
- Track leads.
- Measure CVR.
- Track channel performance.
- And more!
Download Free
All fields are required.
Google Analytics


![Which Mobile Devices Do Your Visitors Use? [Google Analytics Quick Tip]](https://53.fs1.hubspotusercontent-na1.net/hub/53/file-437901773.jpg)