Have you ever presented results from a marketing campaign and been asked, “But are these results statistically significant?” As data-driven marketers, we’re not only asked to measure the results of our marketing campaigns but also to demonstrate the validity of the data — exactly what statistical significance is.

While there are several free tools out there to calculate statistical significance for you (HubSpot even has one here), it’s helpful to understand what they’re calculating and what it all means. Below, we’ll geek out on the numbers using a specific example of statistical significance to help you understand why it’s crucial for marketing success.
![New Data: Instagram Engagement Report [Free Download]](https://no-cache.hubspot.com/cta/default/53/9294dd33-9827-4b39-8fc2-b7fbece7fdb9.png)
What is statistical significance?
In marketing, statistical significance is when the results of your research show that the relationships between the variables you're testing (like conversion rate and landing page type) aren't random; they influence each other.
In marketing, you want your results to be statistically significant because it means that you’re not wasting money on campaigns that won’t bring desired results. Marketers often run statistical significance tests before launching campaigns to test if specific variables are more successful at bringing results than others.
Statistical Significance Example
Say you’re going to be running an ad campaign on Facebook, but you want to ensure you use an ad that’s most likely to bring desired results. So, you run an A/B test for 48 hours with ad A as the control variable, and B as the variation. These are the results I get:
|
Ad |
Impressions |
Conversions |
|
Ad A |
6,000 |
430 |
|
Ad B |
5869 |
560 |
Even though we can see based on the numbers that ad B received more conversions, you want to be confident that the difference in conversions is significant, and not due to random chance. If I plug these numbers into a chi-squared test calculator (more on that later), my p-value is 0.0, meaning that my results are significant, and there is a difference in performance between ad A and ad B that is not due to chance.
When I run my actual campaign, I would want to use ad B.
If you’re anything like me, you need more explanation as to what p-value and 0.0 mean, so we’ll go through an in-depth example below.
How to Calculate Statistical Significance
- Determine what you'd like to test.
- Determine your hypothesis.
- Start collecting data.
- Calculate Chi-Squared results.
- Calculate your expected results.
- See how your results differ from what you expected.
- Find your sum.
- Report on statistical significance to your teams.
1. Determine what you'd like to test.
First, decide what you’d like to test. This could be comparing conversion rates on two landing pages with different images, click-through rates on emails with different subject lines, or conversion rates on different call-to-action buttons at the end of a blog post. The choices are endless.
My advice would be to keep it simple; pick a piece of content that you want to create two different variations of and decide your goal — a better conversion rate or more views are good places to start.
You can certainly test additional variations or even create a multivariate test, but, for this example, we’ll stick to two variations of a landing page with the goal being increasing conversion rates. If you’d like to learn more about A/B testing and multivariate tests, check out "The Critical Difference Between A/B and Multivariate Tests."
2. Determine your hypothesis.
Before I start collecting data, I find it helpful to state my hypothesis at the beginning of the test and determine the degree of confidence I want to test. Since I’m testing out a landing page and want to see if one performs better, I hypothesize that there is a relationship between the landing page the visitors receive and their conversion rate.
3. Start collecting your data.
Now that you’ve determined what you’d like to test, it’s time to start collecting your data. Since you’re likely running this test to determine what piece of content is best to use in the future, you’ll want to pull a sample size. For a landing page, that might mean picking a set amount of time to run your test (e.g., make your page live for three days).
For something like an email, you might pick a random sample of your list to randomly send variations of your emails to. Determining the right sample size can be tricky, and the right sample size will vary between each test. As a general rule of thumb, you want the expected value for each variation to be greater than 5. (We’ll cover expected values further down.)
4. Calculate Chi-Squared results.
There are several different statistical tests that you can run to measure the significance of your data, and picking one depends on what you’re trying to test and the type of data you’ll collect. In most cases, you’ll use a Chi-Squared test since the data is discrete.
Discrete is a fancy way of saying that your experiment can produce a finite number of results. For example, a visitor will either convert or not convert; there aren’t varying degrees of conversion for a single visitor.
You can test based on varying degrees of confidence (sometimes referred to as the alpha of the test). If you want the requirement for reaching statistical significance to be high, your alpha will be lower. You may have seen statistical significance reported in terms of confidence.
For example, "The results are statistically significant with 95% confidence." In this scenario, the alpha was .05 (confidence is calculated as one minus the alpha), meaning there's a one in 20 chance of making an error in the stated relationship.
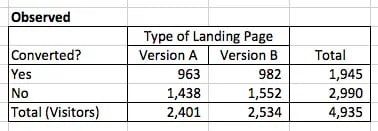
After I’ve collected the data, I put it in a chart to make it easy to organize. Since I’m testing out two different variations (A and B) and there are two possible outcomes (converted, did not convert), I’ll have a 2x2 chart. I’ll total each column and row so I can easily see the results in aggregate.
Once I’ve created my chart, the next step is to run the equation using the chi-squared formula.
Statistical Significance Formula
The image below is the chi-squared formula for statistical significance:

In the equation,
- Σ means sum,
- O = observed, actual values,
- E = expected values.
When running the equation, you calculate everything after the Σ for each pair of values and then sum (add) them all up.
5. Calculate your expected values.
Now, I’ll calculate what the expected values are. If there were no relationship between what landing page visitors saw and their conversion rate in the example above, we would expect to see the same conversion rates with versions A and B. From the totals, we can see that 1,945 people converted out of the 4,935 total visitors, or roughly 39% of visitors.
To calculate the expected frequencies (E in the chi-squared formula) for each version of the landing page, we can multiply the row total for that cell by the column total and divide it by the total number of visitors. In this example, to find the expected value of conversion on version A, I would use the following equation:
(1945*2401)/4935 = 946

6. See how your results differ from what you expected.
To calculate Chi-Square, I compare the observed frequencies (O in the chi-squared equation) to the expected frequencies (E in the chi-squared equation). This comparison is done by subtracting the observed from the expected value, squaring the result, and dividing it by the expected frequency value.
Essentially, I’m trying to see how different my actual results are from what we might expect. Squaring the difference amplifies the effects of the difference, and dividing by what’s expected normalizes the results. As a refresher, The equation looks like this: (observed - expected)*2)/expected
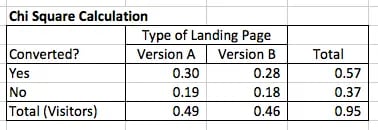
7. Find your sum.
I then sum the four results to get my Chi-Square number. In this case, it’s .95. To see whether or not the conversion rates for my landing pages are different with statistical significance, I compare this with the value from a Chi-Squared distribution table based on my alpha (in this case, .05) and the degrees of freedom.
Degrees of freedom are based on how many variables you have. With a 2x2 table like in this example, the degree of freedom is 1.
In this case, the Chi-Square value would need to be equal to or exceed 3.84 for the results to be statistically significant. Since .95 is less than 3.84, my results are not statistically different. This means that there is no relationship between what version of landing page a visitor receives and the conversion rate with statistical significance.
8. Report on statistical significance to your teams.
After running your experiment, the next step is to report your results to your teams to ensure everyone is on the same page about next steps. So, continuing with the previous example, I would need to let my teams know that the type of landing page we use in our upcoming campaign will not impact our conversion rate because our test results were not significant.
If results were significant, I would inform my teams that landing page version A performed better than the others, and we should opt to use that one in our upcoming campaign.
Why Statistical Significance Is Significant
You may be asking yourself why this is important if you can just use a free tool to run the calculation. Understanding how statistical significance is calculated can help you determine how to best test results from your own experiments.
Many tools use a 95% confidence rate, but for your experiments, it might make sense to use a lower confidence rate if you don’t need the test to be as stringent.
Understanding the underlying calculations also helps you explain why your results might be significant to people who aren't already familiar with statistics.
If you’d like to download the spreadsheet I used in this example so you can see the calculations on your own, click here.
Editor's Note: This blog post was originally published in April 2013, but was updated in September 2021 for freshness and comprehensiveness.