.png?width=112&height=112&name=Growth%20Strategy%20Template%20(18).png)
.jpg)
5 Strategies for Selling to Multiple Decision-Makers
1. Make sharing information easy.
Providing key information about your product in a clear, digestible, easily shareable way is central to effectively dealing with multiple stakeholders. Give your potential customers the ability to quickly share your pricing model and platform details with their colleagues — that will make it simpler for them to come to a final determination.
Start by creating straightforward, transparent pricing models with no hidden fees or complex up-charges.
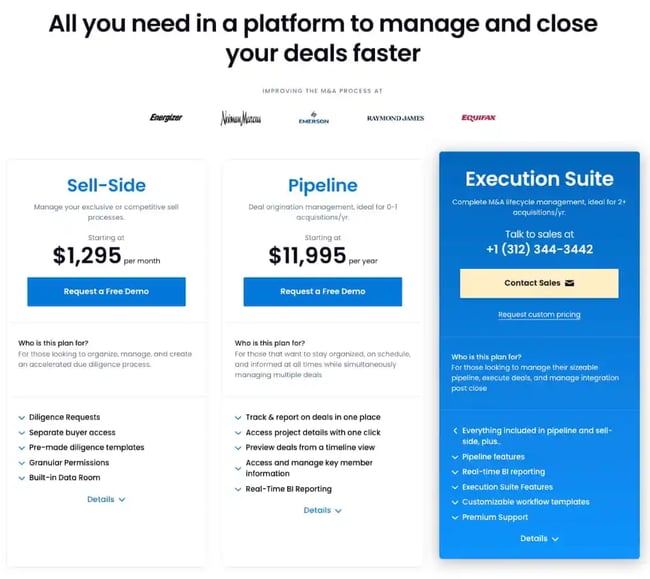
Prospects are naturally going to compare you to your competitors, so when they do, make sure you stand out with clear, honest pricing. Having concise-yet-thorough marketing collateral and one-pagers that outline how your product benefits your customers' processes can also go a long way.
.webp?width=650&height=490&name=salesconversation_2%20(1).webp)
Shareable content like this can give multiple decision-makers a clear picture of your product and value proposition quicker — offering them a deeper understanding of how your platform will suit their needs within your window of opportunity and facilitating a smoother multi-stakeholder sale.
At the end of the day, businesses want to make quick and informed decisions about which software to implement. Make the decision-making process easier for them by being transparent, genuine, and straightforward.
2. Verbalize key differentiators and benefits.
Continuously verbalizing your product's key benefits and differentiators with prospects will ultimately allow those stakeholders to more thoroughly, effectively, and accurately describe your solution to their fellow decision-makers.
Concisely explain what makes your product unique — in a way sophisticated enough to convey legitimacy but digestible enough to be easily repeated. Know your elevator pitch, and be able to seamlessly work it into your demos and conversations with prospects.
The software I developed allows teams to close complex financial transactions faster because we provide a project management solution — and our ability to clearly and accessibly verbalize how our software helps M&A teams manage deals more efficiently usually determines whether we're ultimately able to close.
For example, when my team is conducting demos or corresponding with potential clients, they clearly state that we, unlike other virtual data rooms, have project management capabilities to help close deals faster.
"Close deals faster" is a phrase we use repeatedly — because that's our software's mission, our most crucial benefit, and the ultimate basis of our value proposition. We want our prospects to walk away from every conversation they have with us understanding that that is what we will do for them.
Decide what you want your key takeaways from each conversation to be and verbalize them consistently. If you do this correctly, the stakeholders you speak with will repeat those key points to their fellow decision-makers and do a little selling for you.
3. Be willing to conduct multiple demos.
Having multiple decision-makers involved in the sales process means having more people to impress — more eyes that will want to be on your product. So when you're dealing with multiple stakeholders, you're going to need to conduct as many demos as necessary to close.
Frustrating as this may be, giving all the decision-makers involved in the process the chance to look your product over will greatly increase the likelihood of them ultimately choosing your solution.
Express the willingness and availability to demo your product — even if it's not asked of you. In doing so, you're presenting openness and approachability that your competitors might not be offering.
Additional content about your platform, like pre-recorded demo videos, can also go a long way. Those recordings offer an easy way to give stakeholders with tighter schedules or less availability the opportunity to see your product.
Another great type of content to have available is customer-led demos. Decision makers can see first hand how your customers in similar roles utilize your offering.
If decision-makers feel comfortable with your product and believe implementation will be smooth and simple, they'll feel more confident that your solution is right for them — creating that kind of familiarity is only possible if you've shown them how it works.
4. Answer questions effectively and directly.
Prospects want to be heard. So, naturally, you need to be willing to actually hear them. That starts with actively listening and paying attention to them during conversations and demos — positioning yourself to answer their questions directly, thoroughly, and helpfully.
We've all been there — looking to buy a product and asking questions about its functionality, only to get inadequate or indirect answers. That kind of situation is frustrating, and confuses or delays the decision-making process, and in most cases, the average person faced with it will explore other options.
After conducting a demo, your goal is to eliminate any lingering questions or concerns your potential customers might have. Be an active and perceptive listener, and genuinely prioritize their questions over perceived agendas.
For instance, if your prospects have a lot of questions surrounding a certain area of your product, make sure you revisit that subject before ending the conversation. Once you circle back to the area of concern, ask if they have any further questions.
Simple as that sounds, it can do a lot for you. It demonstrates that you don't mind answering questions again or providing additional detail. It also gives your prospects the space to bring up any unresolved doubts or concerns.
Noticing and analyzing frequently asked questions also helps you target questions they might not even know they have. It can also help to keep a log of questions asked during product demos.
Many of the same questions will be raised consistently — and documenting them can help you structure a page of frequently asked questions that can easily put recurring concerns at bay and expedite multiple prospects' decision-making processes.
5. Have empathy and be patient.
Empathy is by far the greatest tool I've used in my career. Empathizing with your prospects and taking the time to sincerely understand their motivations, pain points, and hesitations will make the sales process better and more equitable for all parties.
Practicing empathy also allows you to preemptively address potential customers' concerns before they become legitimate issues or roadblocks. Decision-makers are bound to worry about whether any solution they're considering will produce return on investment, make their businesses more efficient, and deliver results.
Leveling with those stakeholders around their uncertainties will foster trust and help you consistently close.
Empathy has been central to virtually every deal my teams have closed — but when I think about how important it is, one experience comes to mind. My team was working with a man trying to sell his large, multi-regional organization without the help of bankers. He was clearly overwhelmed and needed direction about how to best approach the deal.
After listening to him and understanding his situation, instead of simply trying to sell him a deal platform, my team and I provided him with free resources and project management tips. That helped take some of the stress out of his upcoming deal.
That demonstration of empathy was big for everyone involved. For us, we were able to stand out from other M&A tools and close the deal. For him, he was able to sell his company and retire.
At the end of the day, we all want to be successful and thrive in our fields.
These techniques have worked well for me as I've grown my business and will continue to be central to how I sell going forward. If you're selling a product you truly believe in, these five tips on selling to organizations with multiple decision-makers will improve your sales process and enable stakeholders to make better, more informed decisions for their businesses.

Sales Process

![Want to create a sales plan? Let me show you how [+8 sales plan examples]](https://53.fs1.hubspotusercontent-na1.net/hubfs/53/sales-plan-1-20260323-5097831.webp)


![How to Run Sales Demos That Close Prospects [+ Expert Tips]](https://53.fs1.hubspotusercontent-na1.net/hubfs/53/Pitch%20Sales%20Demo.webp)
![The Ultimate Sales Cheat Sheet Template to Help Boost Rep Success [New Data + Templates]](https://53.fs1.hubspotusercontent-na1.net/hubfs/53/ft-cheat.webp)
![How to use battle cards in your sales process [+ templates]](https://53.fs1.hubspotusercontent-na1.net/hubfs/53/%5BUse-Oct-08-2025-10-11-09-0787-PM.webp)