.png?width=112&height=112&name=Image%20Hackathon%20%E2%80%93%20Horizontal%20(22).png)

Data-Driven Marketing
Data-driven marketing uses data to inform all marketing decisions, from creative assets to campaigns. It places customer data front and center to ensure all marketing efforts are relevant to customer interests and behaviors.
Data-driven marketing is one way to ensure your customer is the focus of your marketing and your flywheel. While it's easy to prioritize thoughts from creative, finance, or product teams, none of them matter more than actual customers.
With the right data-driven strategies, you'll launch marketing campaigns that speak directly to your audience, building valuable trust and loyalty.
Data-Driven Marketing Best Practices
Know your audience.
The success of your data-driven marketing depends on the accuracy of your customer data. You could have the most seamless data collection process in place, but that data would be useless if it didn’t correctly reflect your customers and target market.
If you don't make an effort to understand and adapt to your customers, "[they] will leave to find someone who will. In fact, after more than one bad experience, around 76% of consumers say they would rather do business with a competitor. And that’s during the best of times," says Nicholas L. Holland, HubSpot's VP of Marketing Hub.
Before you work to apply data-driven marketing strategies to your business, make sure you’re intimately familiar with your audience.
Conduct research on your ideal customers, build your buyer personas, and educate your teams on these profiles. Reach out to current customers to better understand who’s shopping for and buying your products. Hold focus groups to ask questions to a live audience and receive unedited feedback.
Once you know your customer, you can trust your customer data.
Manage your data.
Data-driven marketing is constantly evolving and expanding. This requires not only high-quality data collection but also data management.
Data management is critical to the success of your data-driven marketing efforts — it helps you better understand your customers, routinely analyze your customer data, evaluate new marketing and acquisition opportunities, and save your team time and resources.
One vital part of good data management, which ultimately leads to great customer experience, is picking and using the right tools -- like analytics and automation software.
"Connecting with customers continues to be top of mind at HubSpot, and investing in more robust ways to leverage reporting and automation is our latest approach," says Holland. "Traditional marketing automation and reporting tools give marketers a siloed view into their customers’ journeys. I like to think about it like standing nose to nose with a massive painting — you see only a small piece of a larger vision."
"Now, imagine taking ten steps back from that painting, and the entirely new perspective that would be uncovered,"Holland adds.
To make the most of your company's endless pool of data, you need to invest in the right technology and stay up to date on all the great tools out there.
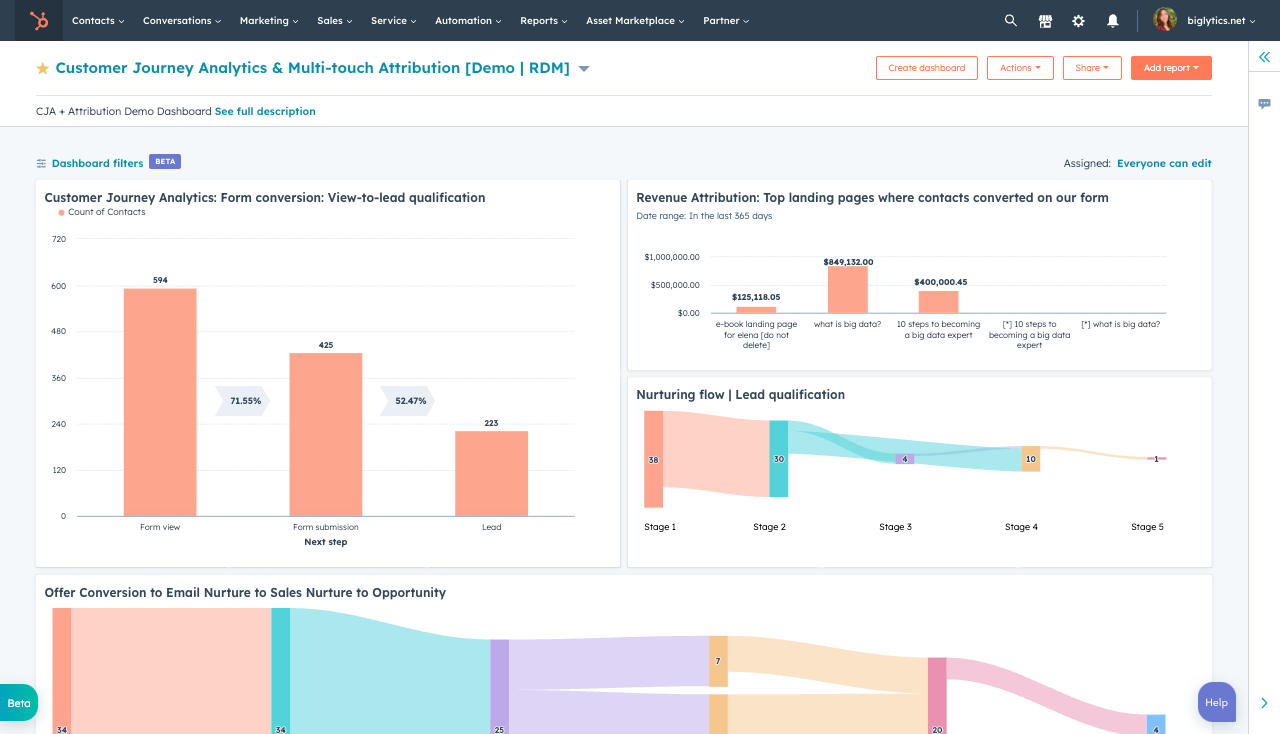
For example, HubSpot Marketing Hub's new Customer Journey Analytics feature enables marketers to see how landing-page visitors flow from forms to submissions to leads. It also gives you insights related to marketing content revenue attribution and lead-nurturing flows.
Want more options? View more data collection and management tools below.
Stay compliant.
All the data in the world is worthless if you don’t follow the law, keep up with changing data privacy trends, stay compliant, or respect customer information.
In recent years, countries and organizations have cracked down on how businesses leverage their customer data. You’ve likely seen these ordinances reflected in laws like General Data Protection Regulation (GDPR) and the California Consumer Privacy Act (CCPA).
Aside from government rulings, companies like Google and Apple have stepped in to protect customer and user data on their platforms — which required some advertisers and email marketers to pivot strategies.
These changes aren’t the enemy — they’re designed to protect your consumers and hold organizations accountable for how that data's used. If anything, these pivots make your marketing more transparent, trustworthy, and effective.
To ensure the success of your data-driven marketing, research these laws to better understand how your business must comply.
Data-Driven Marketing Strategies
Today, personalized marketing goes way beyond first-name email greetings. It’s about delivering the right message on the right medium at the right time — and data-driven marketing is the key.
Unsure of how data-driven marketing fits into your broader marketing efforts? The strategies listed below are different ways to leverage your customer data while engaging your audience. Consider combining a few to strengthen and personalize your marketing efforts.
1. Segment your audience.
Not every member of your target audience is equal — and they shouldn’t be treated as such. Different customer groups exist within your wider target audience, and it’s up to you to define those segments.
Targeted, personalized messages go farther than general broadcasts, and segmentation can help you reach the right people at the right time. For example, if your store sells men's and women's apparel, you'd need two marketing messages to reach those segments. Similarly, if your store has multiple locations, tactics you use for locations in Nevada will vary from those in New York.
There are virtually endless ways to divide your audience. Not only does your target audience differ by demographic — by gender, age, and location, for example — but they have different preferences and pain points. They’re also in different stages of the buyer journey.

Data-driven marketing equips you to accurately segment your audience (and automate segmentation -- particularly important with email marketing, social media marketing, and retargeting.
2. Retarget your advertising.
Retargeting (also called remarketing) is a critical strategy for all marketers, especially cross-channel marketers. Retargeting enables you to keep your brand top-of-mind among users who’ve expressed interest in your products or services.

For example, if someone browses specific products on your website, customer data allows you to resurface those products to that consumer through strategies like social media advertising or abandoned cart email marketing.
Not sure where to start? Download our free Beginner’s Guide to Retargeting to learn about leads and awareness with successful retargeting campaigns.
3. Optimize your content.
Your website copy, blog content, social media content, advertising … you create these with who in mind? Your customers. Without customer data, your content creation process would be a shot in the dark.
Data-driven marketing provides context for your content. It allows you to understand and serve your audience through the content you publish online and through your advertising. Whether demographic or psychographic, customer data provides insight into how to craft your content to address customer questions, pain points, curiosities, and desires.
For example, you might start with keyword research. Don’t simply guess what words and phrases are searched by your audience. Use your customer data as insight for your keyword research and content optimization.
And if you want to make content that reflects what your audience wants to see, in a fraction of the time, you can leverage HubSpot's content assistant tool.

This free, AI-powered feature can help you ideate, create, and share remarkable content that can capture your audience's attention — and clicks.
4. Align your teams.
Customer data isn’t only to be used by Marketing; it can be leveraged by Sales and Support, too. The versatility of big data allows you to bring these teams together to ensure their efforts and strategies are aligned.
One way to do this is with a customer data platform (CDP). A CDP aggregates customer data to create individual customer profiles that can be used across your organization. It helps your teams avoid working with siloed customer information.
By centering your efforts around a CDP, you can ensure your entire company is working with the same data and presenting a cohesive customer experience.
5. Delight your customers.
Today’s consumers are browsing and shopping on multiple devices and platforms. Do you think they want to be treated as multiple customers based on these behaviors? Absolutely not.
Data-driven marketing allows you to accurately identify these customers across multiple devices and provide a fantastic omnichannel experience. Not only does this save you time and resources, but it refines the customer experience and tells your audience that you’re paying attention to their behaviors and needs.
Data-Driven Marketing Tools
Wondering how to get started with data-driven marketing? Try these tools to track, manage, and apply your customer data.
1. HubSpot Marketing Hub

Marketing Hub is a fantastic tool for businesses of all kinds looking to dive into data-driven marketing. It connects to Hubspot CRM so you can track, analyze, and deploy your customer data from one place.
From Marketing Hub, you can create optimized content, launch segmented email campaigns, view customer journey analytics, monitor social media activity, and run retargeting ad campaigns.
2. Google Analytics

Google Analytics is a leading tool for tracking and reporting on website user behavior. It allows you to better understand your website traffic, bounce rates, visitor sessions, customer demographics, and more.
You can run reports on your acquisitions, conversions, user behavior flows, and more. Google Analytics also connects to your Google Ads account to track and report on your ad performance.
3. Buzzsumo

Buzzsumo helps you optimize your web content, track your digital brand performance and better understand your competitors. With your customer data in mind, use Buzzsumo to research leading keywords, content types, and published content to discover trends that can inform your own content strategy.
Additionally, track key metrics around your competitor’s content to learn how your content compares.
Put Data in the Driver’s Seat
Customer data has the power to turn general broadcast-based marketing into poignant, personalized messaging.
Knowing your customers not only allows you to grab their attention and solve for their needs but also boost your revenue and bring together your teams. Apply these strategies to get started with data-driven marketing today.
Editor's note: This post was originally published in May 2015 and has been updated for comprehensiveness.

Data-driven Marketing