Your HubSpot Dashboard just got a bit smarter. Based on customer feedback and one excellent idea posted on ideas.hubspot.com, we have updated your HubSpot Dashboard to allow you to track your marketing performance against the numbers that matter most to your business.

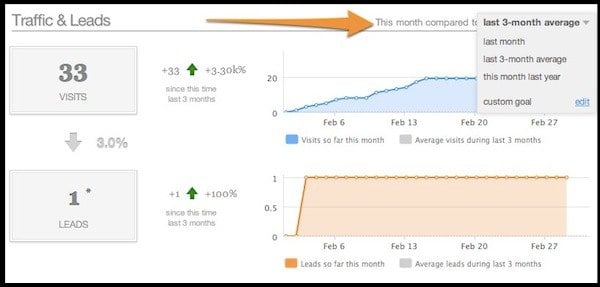
You can now compare monthly Traffic and Leads numbers against your numbers for the previous month, the average of your previous three months, or the same month last year.
This will be especially helpful for seasonal businesses that want to compare their performance against equivalent times in their business cycle. To set your comparison timeframe, just click the dropdown above the Traffic and Leads module and select the appropriate timeframe.

You can now also set an explicit goal for your Traffic and Leads for the month. This new feature allows you to create a customized monthly burndown chart for tracking your daily performance -- right on your dashboard.
As marketers, one of our biggest challenges is delivering a solid pipeline of qualified leads to our sales teams while still dealing with all od the natural variability of traffic and leads for the month. A monthly burndown chart helps you track progress towards your goal, letting you know instantly when you need to dial up or dial down your marketing efforts to keep your pipeline steady.

We hope you find these new features to be valuable weapons in your inbound marketing arsenal. They should offer you increased insight and predictability in your monthly Traffic and Leads pipeline. Please leave us any feedback in the comments!


