So there you are, looking at a report that tells you how many contacts have subscribed to your newsletter, how many contacts are within a certain persona, or maybe even how many contacts have filled out more than 15 forms on your site.

Your numbers look great! But you’re scratching your head because these cumulative reports aren’t telling you when the numbers climbed as high as they did.
Let’s say you want to create a report that will tell you, over time, when contacts have opted out of email from your site. The HubSpot default contact property Unsubscribed from all email tells you exactly who has unsubscribed, but not when that actually occurred. Maybe you have over a year’s worth of data that you want to report on. How can you go about reporting on that?
Below, we're going to walk through how to use a combination of workflows, the reporting add-on, and a little bit of CSV magic to create a report that shows the date a property changed in just a few easy steps.
Creating the Property
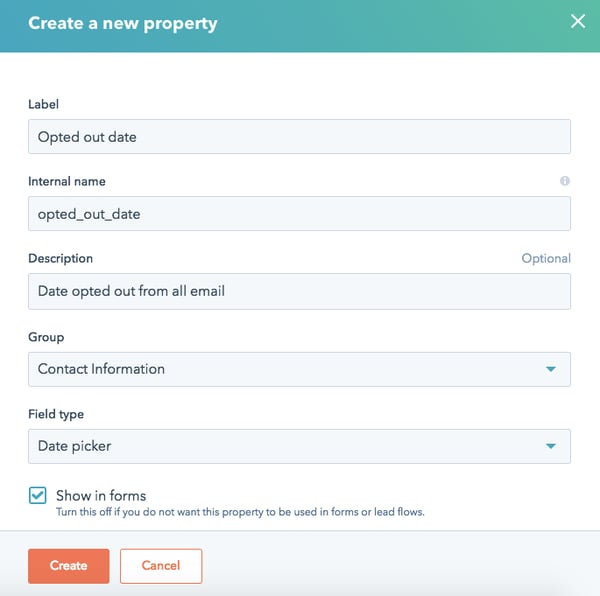
The first thing you’ll need to do is create a custom date picker property that you'll eventually use for our report. Make sure the Field type is set to Date picker.
A sample property might look something like this:
Setting the Date Information
After creating your custom property, export the property history for the existing property you want to report on (in this case, Unsubscribed from all email).
Your exported CSV will look similar to this:
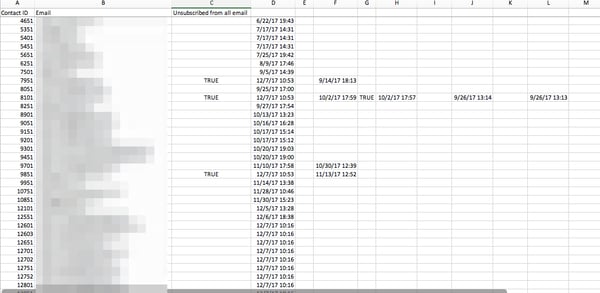
In this export, you'll find the historical values for the Unsubscribed from all email property for all contacts in your account as well as the dates that those values were set. The most recent value will always be in column D, with previous values in column E and the date that value was set in column F. Our report will only be able to show us one date at a time, so you don’t need to import the values past columns D and E if you don't want to.
Next, edit the CSV so that the only columns you have are the email address and the date the property changed (so columns B and D). You can remove the other columns to make the import process easier. Since we’re only reporting on the date the property changed, the value (column C) isn’t necessary to keep.
Then, edit the format of the dates to remove the timestamp and align the dates with the desired mm/dd/yyyy format. See this article for more information. One way to do remove the timestamp would be to select the column in Excel, then reformat the date so that it removes the timestamp altogether.
Then, re-import this edited CSV back into your account. You can do this by following these steps:
- Navigate to Contacts > Contacts
- Click on Import.
- Select CSV file.
- Select the file that you want to import using the file selector or by dragging the file into the import tool
- Click upload.
- Enter an import name and choose the lifecycle stage. If you don't want to change the lifecycle stage of any of your existing contacts, choose Subscriber. Learn more about this in the HubSpot Community here.
- Click Advanced Options to match the date format in your CSV with the format you're importing with.
- Click Next, map your properties.
- HubSpot will automatically match the columns in your CSV file to your contact properties, so the email property should be automatically matched, but you might need to manually map the date column to the new date property that you created earlier.
- Click Next, confirm additional options.
- On the Email Opt-in screen, review the statements and select True to confirm that the contacts you're importing are expecting to hear from you and that you have not purchased the list. Place your initials in the field to confirm your selections.
- Click Finish import. This import will backdate the property.
Creating the Workflow
After that, create a workflow that will automatically populate this property in the future. This will keep your property updating automatically so that you don’t need to worry about manually updating it or re-exporting the property history as the property continues to update. It will look something like this:
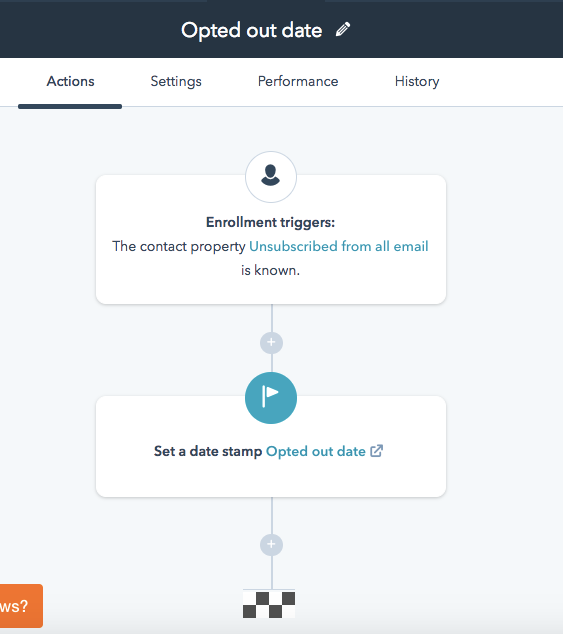
It’s important to enable re-enrollment based on the criteria The contact property (name of property) is known. This way, if your contacts' property values change in the future, they’ll still be re-enrolled in the workflow and the date stamp will update to the most recent value.
In the Settings tab of the workflow editor, set your workflow to execute 7 days a week, at any time of day. Otherwise, if a contact property changes while the workflow is not allowed to execute, the date stamp will no longer be accurate.
Creating the Report
Finally, you can create your date-based report. To do this, navigate to the appropriate dashboard and click Add report. Then, click Create custom report. For this report, select Single data set, then select Contacts, then click Next.
In the Properties section on the left, you can choose as many contact properties as you'd like. But the most important one will be the custom date property that you created earlier. The properties you choose will act as the x-axis on your report.
In the top left, click Filters to edit the report filters. By default, your report will have a Create date is This quarter so far filter. Click this filter to change it to your custom date property instead. You can add any other properties that you'd like, but for this example we'll stick with our custom date property.

Next, click the Visualization tab at the top of the report builder to customize the report's appearance. How you want the report to appear will depend on your preference and use case, but for this example we'll use the line chart for viewing the data over time.
On the left, in the Available properties to display section, drag Count of contacts and your custom date property up to the Displaying section. Your configuration will look something like this:

Click the Frequency, Color, and Display options filters in the top right to further customize your report. For example, if you're looking to see how many contacts are unsubscribing monthly, select the Monthly option from the Frequency dropdown menu. So that you can see trends over time rather than a running total, it's recommended that you don't select the Cumulative option under the Display options dropdown menu.

And there you have it. With a little bit of creativity, you can create the perfect report to suit you and your team’s needs—just in time to present to your shareholders.
HubSpot Support Series
![How to Size Images for Your Blog Content [HubSpot Support Series]](https://53.fs1.hubspotusercontent-na1.net/hubfs/53/375_Size%20Images.png)
![Mastering Media Queries [Support Series]](https://53.fs1.hubspotusercontent-na1.net/hubfs/53/Support/Support%20Series%20User%20Blog%20folder%20copy%202.png)