A/B testing is an important part of digital marketing today. Not many people will argue against that (assuming the testing is done accurately, of course).
But it’s not as simple as putting up a red button against a green one. We all have a limited amount of traffic, so it’s important that we minimize regret, factor in opportunity costs, and maximize efficiency. We want to put more of our chips on tests with a higher potential to win and make an impact.
In a sense, we need to start thinking about optimizing our optimization program, not just individual page elements in isolation. Here's how.
3 Factors of a Successful Testing Program
At the highest level, there are three variables that determine the success of your conversion optimization program:
- The number of tests you run
- The number of tests you win
- The impact per winning test
Variable number one — how many tests you run (testing velocity) — is a function of resources and traffic potential. If you have a limited amount of traffic, you have a limited amount of tests you can run with validity. So you should be able to max out your testing velocity as long as you have the proper resource allocation.
Variable number two and three are a bit different though: how can you improve the amount of winning tests and the impact per winning test? We’re all operating under uncertainty. No one can reliably predict the results of a series of A/B tests, but there are certainly ways to improve upon your record.
It all starts with conversion research.
Some prefer qualitative research, some prefer quantitative — I prefer a mixture of both. Regardless of the exact makeup of your research program, the goal is the same: to learn where the actual problems on your site are and tease out some good hypotheses for improvement.
Mastering Quantitative Conversion Research
First, you need to determine the “what” and the “where.” For this, we’ll use digital analytics to discover the best opportunities for experimentation.
Digital Analytics
When it comes to tracking and reporting, the main thing that matters is if it’s configured properly and if you trust the data enough to make decisions with it. Platforms like Hubspot and Google Analytics can be configured to answer these business questions for us.
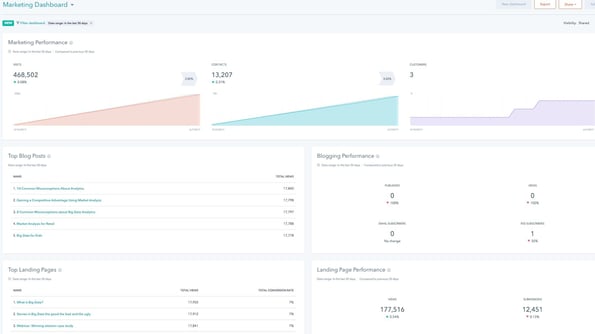
The HubSpot Reporting Tool
HubSpot's reporting add-on can help you create flexible reports that bridge the marketing and CRM divide. Better testing is all about constant examination and improvement, which is where the reporting tool — especially the custom reports — plays a big part. Learn how to configure the HubSpot reporting add-on in your account.
When you start to build your reports, it's important to ask questions like:
- What pages are most important to my site?
- Which landing pages are underperforming compared to the site average?
- Are there certain browsers or devices that are suffering?
- Might there be bugs ruining the user experience for certain people?
- How does site speed affect my conversion rate?
- Which traffic sources are performing best and worst?
- Are we tracking things properly to even know what’s working and what’s not?

While I'd love to write a whole article about finding testing opportunities using digital analytics, there are many articles on that topic you can check out.
In addition to your tried and true digital analytics tool, you can also pull quantitative insights from other tracking tools.
Heat Maps
One example would be heat maps software. With heat maps, you can gather some high level data on how users are interacting with your site.
Depending on the heat map tool you use, there can be a variety of reports included.
Some of the things you can learn with heat maps:
- Click maps communicate user behavior at a high level, and the fact that it’s visual makes it really easy to communicate with stakeholders.
- You can get a sense of the general hierarchy of attention on the page.
- If people are clicking things that aren’t links, you can either make them into links, or you can change the design so they don’t look like a link.
- Scroll maps are super valuable, especially if you’re using long form landing pages. How far are people actually making it? Make sure you don’t bury crucial content or CTAs below the point of mass drop-off.
Heat maps are, in essence, great at visualizing general behavioral data. I wouldn’t use them as a crutch, as they can induce more bias than other forms of quantitative insights, if only because they are aggregated insights and it’s easier to tell stories based on the visualizations.
I also wouldn’t put too much trust in hover maps. The studies vary, but most of the ones I’ve seen show that how you hover your mouse doesn’t correlate much with your eye movements. You’re probably better off simply using a solution like Tobii.

Form Analytics
Then you can use a form analytics solution as well, though you can also configure this in whatever analytics solution you’re using. This analysis can tell you important things like where people are dropping off, error rates, and insights with your forms.
Here's how to measure the success of your forms in HubSpot.

There are also tools specifically for this, like Formisimo.

Mastering Qualitative Research
Qualitative research continues to help us spot problem areas, but its real strength is giving us insights on potential solutions. When you hear the specific way a customer phrases a problem or you watch someone navigate your site, you begin to envision potential answers to the problems you’re trying to solve.
You likely use qualitative insights to make decisions already, even if not consciously. A peer review, or simply asking a friend what they think of your landing page, would fall under this category.
However, qualitative research tends to be easily biased, so it’s important to approach this rigorously and with formal processes in mind.
Session Replays
One of my favorite ways of the above to get test ideas is with session replay videos. My friend Justin Rondeau differentiates passive user data (collected automatically and without the user knowing) and active user data (consciously collected, as in an interview or a user test.) According to him, passive user data tends to be less biased because it’s collected without their awareness.
Session replays fall under the “passive” category. They’re essentially recorded visitors of anonymous users actually using your site. This is observational data, so it’s subject to your own biases, but these videos are super helpful in quantifying bottlenecks in your user experience. When an issue continues to pop up, you know it’s worth fixing. Even better, you’ll often find surprising issues that you could never have guessed are going on with your website UX.

Surveys and Polls
Another way to gather qualitative feedback is with surveys or polls. While there are slight differences between the two, the idea is the same: You ask people questions and they give you direct answers.
An on-site poll is just like it sounds — a form with which a visitor interacts directly on your website. These are usually used to gather specific and concise feedback on a given page. Sometimes, you can even get quantitative insights with these, like the example below.
Customer surveys are related. Generally, though, customer surveys are sent immediately after someone purchases, which of course, is a different type of feedback than that of an anonymous web visitor.
However, you can usually get deeper feedback and insight with these. In my experience, it’s best to run survey with mostly open-ended questions, but a few close-ended ones that you can quantify (and possible use to form distinct buyer personas.)
There are lots of ways to mess these up (mostly due to not attaching business goals to your survey design), but when done right, customer surveys are one of my favorite ways to generate A/B test hypotheses. They can help you answer tough business questions, too:
- Who are your customers? Can you find patterns to form buyer personas?
- What kind of problems do they have?
- What are the exact words they use?
- What are their motivations?
- Do they comparison shop? What are the most important variables in their buying decision?
Here’s how to build your own customer survey in HubSpot.
Customer Interviews
Then there are customer interviews, which are similar to surveys, but tend to be one-on-one and much more qualitative (and also open to bias). I usually like to do customer interviews after narrowing down subsets of target customers with digital analytics and qualitative surveys, and only then talk to whom I know to be the best model of customer.
Otherwise, since your data set is small, talking to a non-ideal customer can skew your insights. Not all feedback is valuable.

Interview Your Internal Teams
Another way you can grab qualitative feedback for test ideas, perhaps one of the least utilized, is to interview your sales and support teams. They have the most contact with customers and the most intimate knowledge of the customer’s motivations, struggles, and frustrations.
Mining these teams for insights takes such a low amount of time compared to the insights it generates.
User Testing
Finally, we come to the favorite qualitative weapon of a conversion optimization researcher: User testing.
User testing is when you walk a user through a series of tasks (I recommend doing some broad tasks and some specific), and you get to watch them complete it and comment on the process. Most tools also let you offer post-task and post-user-test surveys, which always brings further insight. Nothing teaches you empathy for your users quite like a good round of user tests.
You won’t believe how unusable some of your experiences are to users who aren’t super familiar with your site.

Some platforms you can use for user testing include:
Putting It Together and Building an Experiment Roadmap
After a healthy phase of conversion research, you won’t have a shortage of A/B test ideas. I promise that much.
No, often the problem at this point is your backlog of test ideas is way too big. Where do you start? Sometimes people rely on testing "best practices" but even that is tricky.
Here’s where the skill of project management comes in. We need to analyze our research, score our hypotheses, and prioritize & build our testing roadmap.
This could easily be its own article, but I’ll go over a brief summary of how we do this at CXL.
We’ll generally have a large list of ideas — some fall into the bucket of “just do it fixes” (things that take little time and will surely improve the site) to those that need more investigation or may need more resources for development. It’s time to prioritize these in some systematic way.
There are a variety of test prioritization frameworks out there — ICE, PIE, etc.
Each has its strengths and weaknesses, but every one I’ve seen is based on a balance of two variables: potential impact and resources.
If something has a high potential to make a big impact and it takes very low resources to implement, put it at the top of the list. If something will barely be noticed and won’t change the bottom line, but takes a ton of development resources, it should be placed at the bottom.
At CXL, we developed our own test prioritization framework called PXL, mostly because we deemed the others to be a bit too subjective (what’s the difference between a score of “5” and “7” on impact?)

Essentially, we ask a series of questions with binary responses. It’s either a yes or no. In addition, each question is crafted so that it forces you to bring data to the table. As an example, “is this something that you’ve found using customer surveys?”
Grab your own copy of this spreadsheet template here. Just click "File" > "Make a Copy" to have your own customizable spreadsheet.
Conclusion
“Give me six hours to chop down a tree and I will spend the first four sharpening the axe." —Abraham Lincoln
In other words, prepare for success. If you’re running a bunch of A/B tests, that’s great. If you’re running a bunch of A/B tests and conducting lean and effective research, even better.
The more you can optimize your optimization process, the more value you derive from it. For best results, combine qualitative and quantitative insights to come up with more winning test ideas.
Want to learn a little more about conversion rate optimization? Learn about CRO here.
And check out this example of a full redesign research process from HubSpot's U/X team.
This post was contributed by ConversionXL.
Looking for in-person training on conversion rate optimization? In the CRO training workshop at Inbound 2017, you’ll learn how making adjustments to your webpage can maximize the likelihood that a site visitor will convert on that page.