This post breaks the process down into clear, approachable steps. It explains what web development involves, the skills and tools beginners need to start, and the different paths developers can take as they specialize.
No matter the project, understanding these fundamentals marks the true beginning of building for the web.
Table of Contents
- Getting Started With Web Development
- What is website development?
- Why is web development important?
- Understanding the Different Types of Web Developers
- Web Development vs. Web Programming
- Web Development Basics
- Types of Web Development
- The Website Development Process
- Front-End Web Development Languages
- Front-End Web Development Roadmap
- Back-End Web Development Languages
- Back-End Web Development Roadmap
- Website Development Resources
- Frequently Asked Questions About Web Development
Getting Started With Web Development
Every website seen online starts with the same foundation. That’s why developers must understand how the web works, setting up the right tools and learning by building. A proper web development intro can help.
Here’s an outline of what beginners should know before they start, what tools they need, and how to take the first practical steps toward becoming a web developer.
Prerequisites for Learning Web Development
Before learning web development, it helps to have a few basic skills and concepts in place.
- General computer knowledge: Beginners should be comfortable using a computer, managing files and folders, and installing software. This makes it easier to follow along with coding exercises and tutorials.
- Internet fundamentals: A basic understanding of how the internet works (such as what a website, browser, and server are) creates helpful context for learning web technologies.
- Analytical thinking: Web development often involves solving problems, so approaching challenges logically and patiently is an important skill.
- Goal setting: Knowing the reason for learning web development helps narrow the focus. For instance, business owners may want to build or manage their company’s website, while aspiring developers may want to start a career in technology.
Most importantly, web development requires consistency. Regular practice, even in small amounts, leads to faster progress than occasional bursts of study.
What You’ll Need to Begin
Learning web development requires both hardware and software tools. These tools form the foundation for both learning and building real projects.
Hardware
A reliable laptop or desktop computer with at least 8GB of RAM and a stable internet connection is enough for most beginners. Higher specifications may be needed later for larger projects or complex applications.
Software
- Web browser: A modern browser such as Google Chrome, Mozilla Firefox, or Microsoft Edge is essential for testing websites. Each of these browsers includes developer tools that allow inspection of elements, layout, and code behavior.
- Code editor: Applications like Visual Studio Code, Sublime Text, or Atom are used to write and edit code. Visual Studio Code is especially popular because it’s free and supports many programming languages and extensions.
- Version control: Git is the most widely used system for tracking code changes. Beginners can create a free GitHub account to store their projects online and collaborate with others.
- Programming languages and tools. For front-end development, HTML, CSS, and JavaScript are the starting point. We’ll cover these in more detail later. For back-end development, a language such as Python, PHP, Java, or Node.js is needed, along with a database like MySQL or PostgreSQL.
- Design and testing tools: Figma (for design), Postman (for testing APIs), and simple text editors or browser extensions for checking accessibility and responsiveness can be helpful as skills progress.
- Hosting services: Platforms like Netlify or Vercel allow beginners to publish small websites online easily and for free.
First Steps in Web Development
The first steps in web development involve learning how websites are built and displayed in a browser.
- Learn how the web works. Before coding, understand how a browser requests data from a server and displays it as a webpage. This basic flow shows how HTML, CSS, and JavaScript work together.
- Start with HTML. HTML defines a website’s structure, allowing developers to feature text, links, images, and sections on web pages. Beginners can practice by building simple pages with headings, paragraphs, and navigation links.
- Learn CSS for styling. CSS shapes a site’s look with colors, fonts, and layouts. Learning Flexbox, Grid, and responsive design helps pages adjust smoothly to any screen size.
- Add interactivity with JavaScript. JavaScript brings sites to life. Start with simple interactions like toggling elements, validating forms, or updating content dynamically.
- Build small projects. Practice by creating small, focused projects, like a personal portfolio, a to-do list, or a landing page, to apply and reinforce new skills.
- Learn to use version control. Use Git to track changes, fix errors, and collaborate. Platforms like GitHub or GitLab also serve as online portfolios for sharing work.
- Publish a first website. Deploying a project to the web is an exciting milestone. Services like Netlify, Vercel, or GitHub Pages make it simple to upload files and generate a live website link.
As learners gain confidence, they can explore frameworks such as React (for front-end) or Express (for back-end) to handle more advanced projects. Over time, these skills combine to form a complete understanding of how modern websites and applications are created and maintained.
What is website development?
Web development is the process of building and maintaining websites and web applications. This includes everything from markup and coding to scripting, network configuration, and CMS development.
If someone wants to get started with web development, a big part of that will be learning various programming languages. Depending on their focus, these could be front-end languages like HTML, CSS, and JavaScript, or back-end languages like Python, PHP, Java, Ruby, and so on. Front-end development focuses on the visual and interactive parts of a website, while back-end development handles the server-side logic and databases.
However, learning programming languages isn’t the only part of website development. It’s also important to understand how the web works at a basic level, especially for anyone interested in back-end website development.
Why is web development important?
Right now, over 6.04 billion people are connected through the internet. That's more than half of our global population actively engaging in research, connection, education, and entertainment through this incredible digital universe.
Given the rapidly increasing number of internet users, it’s no surprise that web development is a rapidly expanding industry. Between now and 2034, the employment of web developers is expected to grow by 7%, which is faster than most other technology careers.
It’s an exciting time to be in this field, and I’m thrilled to be part of this dynamic industry.
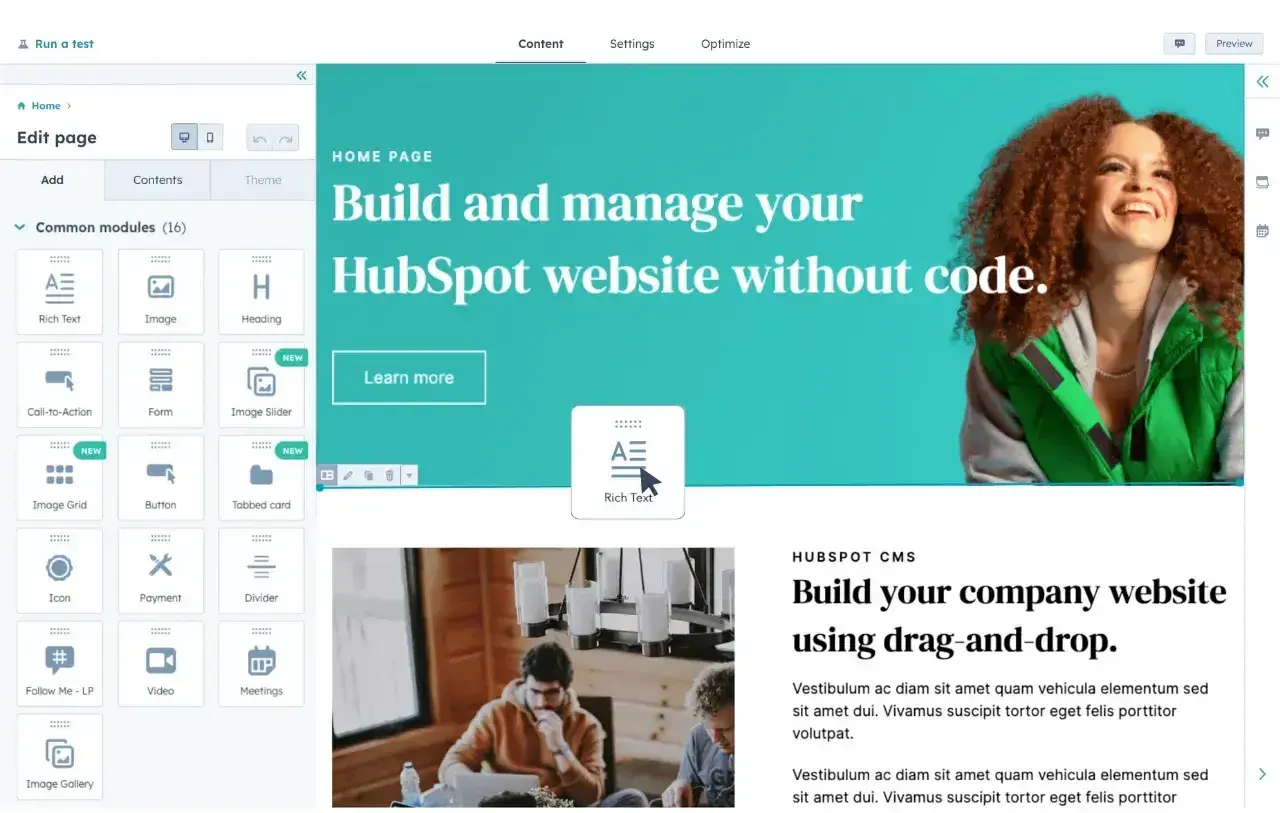
However, not every business needs a dedicated web developer. Many companies use content management systems and templates to design their sites. That’s especially true of small and medium-sized businesses with limited budgets. For example, HubSpot Content Hub provides beginner-friendly tools and resources for web development. WordPress and Wix are other popular options.
Understanding the Different Types of Web Developers
As beginners progress, they often start to specialize. Web development covers several distinct paths, each focusing on a different layer of how websites and web applications work. Some developers concentrate on what visitors see, others on the logic and data that power the site behind the scenes, and some work across the full spectrum.
The table below outlines the main types of web developers, what each one does, and the programming languages and technologies commonly used in their work.
|
Type of Developer |
What They Do |
Languages and Tools to Know |
|
Front-end developer |
Focuses on the part of a website that users interact with directly, e.g., layout, navigation, design, and responsiveness. Translates design mockups into functioning interfaces and ensure websites look and perform well on all devices. |
Core languages: HTML, CSS, JavaScript. Frameworks/Libraries: React, Vue.js, Angular, Svelte. Tools: Git, Chrome DevTools, Figma, Vite, Webpack. |
|
Back-end developer |
Works on the server side of web applications, managing databases, handling user authentication, processing logic, and ensuring smooth data exchange between server and client. |
Languages: Python, PHP, Java, Node.js, Ruby, C#. Databases: MySQL, PostgreSQL, MongoDB. Frameworks: Express, Django, Flask, Laravel, Spring Boot, .NET. |
|
Full-stack developer |
Builds and maintains both front-end and back-end systems. Designs user interfaces, manages servers, handles databases, and deploys applications end-to-end. |
Combines front-end and back-end skills. Languages: HTML, CSS, JavaScript (React, Node.js), Python, or PHP. Tools: Git, REST APIs, Docker, Postman, Vercel/Netlify. |
|
Web designer/UI developer |
Focuses on the visual design and user experience of a website. Ensures that the website is easy to navigate, visually consistent, and aligned with brand identity. |
Tools: Figma, Adobe XD, Sketch, Canva. Languages: Basic HTML and CSS for layout adjustments. Knowledge: Design systems, typography, color theory, accessibility. |
|
Mobile web developer |
Builds responsive websites and progressive web apps (PWAs) optimized for mobile devices. Focuses on performance, offline access, and cross-device compatibility. |
Languages: HTML, CSS, JavaScript. Frameworks: React Native, Ionic, Flutter (for web), PWA standards. Tools: Lighthouse, Chrome DevTools, mobile emulators. |
|
CMS developer |
Specializes in building and managing websites using content management systems such as WordPress, Drupal, or HubSpot CMS. Customizes themes, builds templates, and integrates plugins. |
Languages: HTML, CSS, PHP, JavaScript. CMS Platforms: WordPress, Drupal, Joomla, HubSpot CMS, Webflow. Tools: cPanel, FTP, database management tools. |
|
E-commerce developer |
Builds and maintains online stores. Handles payment gateways, product catalogs, shopping carts, and integrations with CRM or ERP systems. |
Languages: HTML, CSS, JavaScript, PHP, Liquid (Shopify), or React (for headless commerce). Platforms: Shopify, WooCommerce, Magento, BigCommerce. APIs: Stripe, PayPal, Square. |
Web Development vs. Web Programming
Web development and web programming sound very similar — and they are. But, there’s one very important distinction.
Web development refers to the overall process of creating websites or web applications, including the project’s design, layout, coding, content creation, and functionality. It involves using a combination of programming languages, tools, and frameworks to bring a website or web application to life. Web development may also encompass project management activities, such as fielding development requests from stakeholders or freelance clients.
Web programming, on the other hand, specifically refers to the coding and scripting of a website, whether the front-end or back-end. It primarily involves writing code to handle data, process user inputs, and generate dynamic content.
A web programmer will rarely, if ever, handle a large web development project from end to end. They may build a certain section of a site or troubleshoot bugs.
Understanding this difference has been crucial in my career, allowing me to appreciate the depth and breadth of skills required in the world of web creation. It's a reminder of the diverse talents and expertise that come together to make the digital world what it is today.
1. What is a website?
Websites are files stored on servers, which are computers that host (fancy term for “store files for”) websites. These servers are connected to a giant network called the internet.
Now, how do people access these websites? This is where browsers come into play. Browsers are computer programs that load websites via an Internet connection, such as Google Chrome or Safari, while the computers used to access these websites are known as “clients.”
2. What is an IP address?
An Internet Protocol (IP) address is a unique string of numbers. Each device has an IP address to distinguish itself from the billions of websites and devices connected via the Internet.
The IP address for HubSpot is currently 104.16.118.116. Anyone can find a website’s IP address by visiting a site like Site 24x7 or by using Command Prompt on Windows or Network Utility > Traceroute on MacBooks.
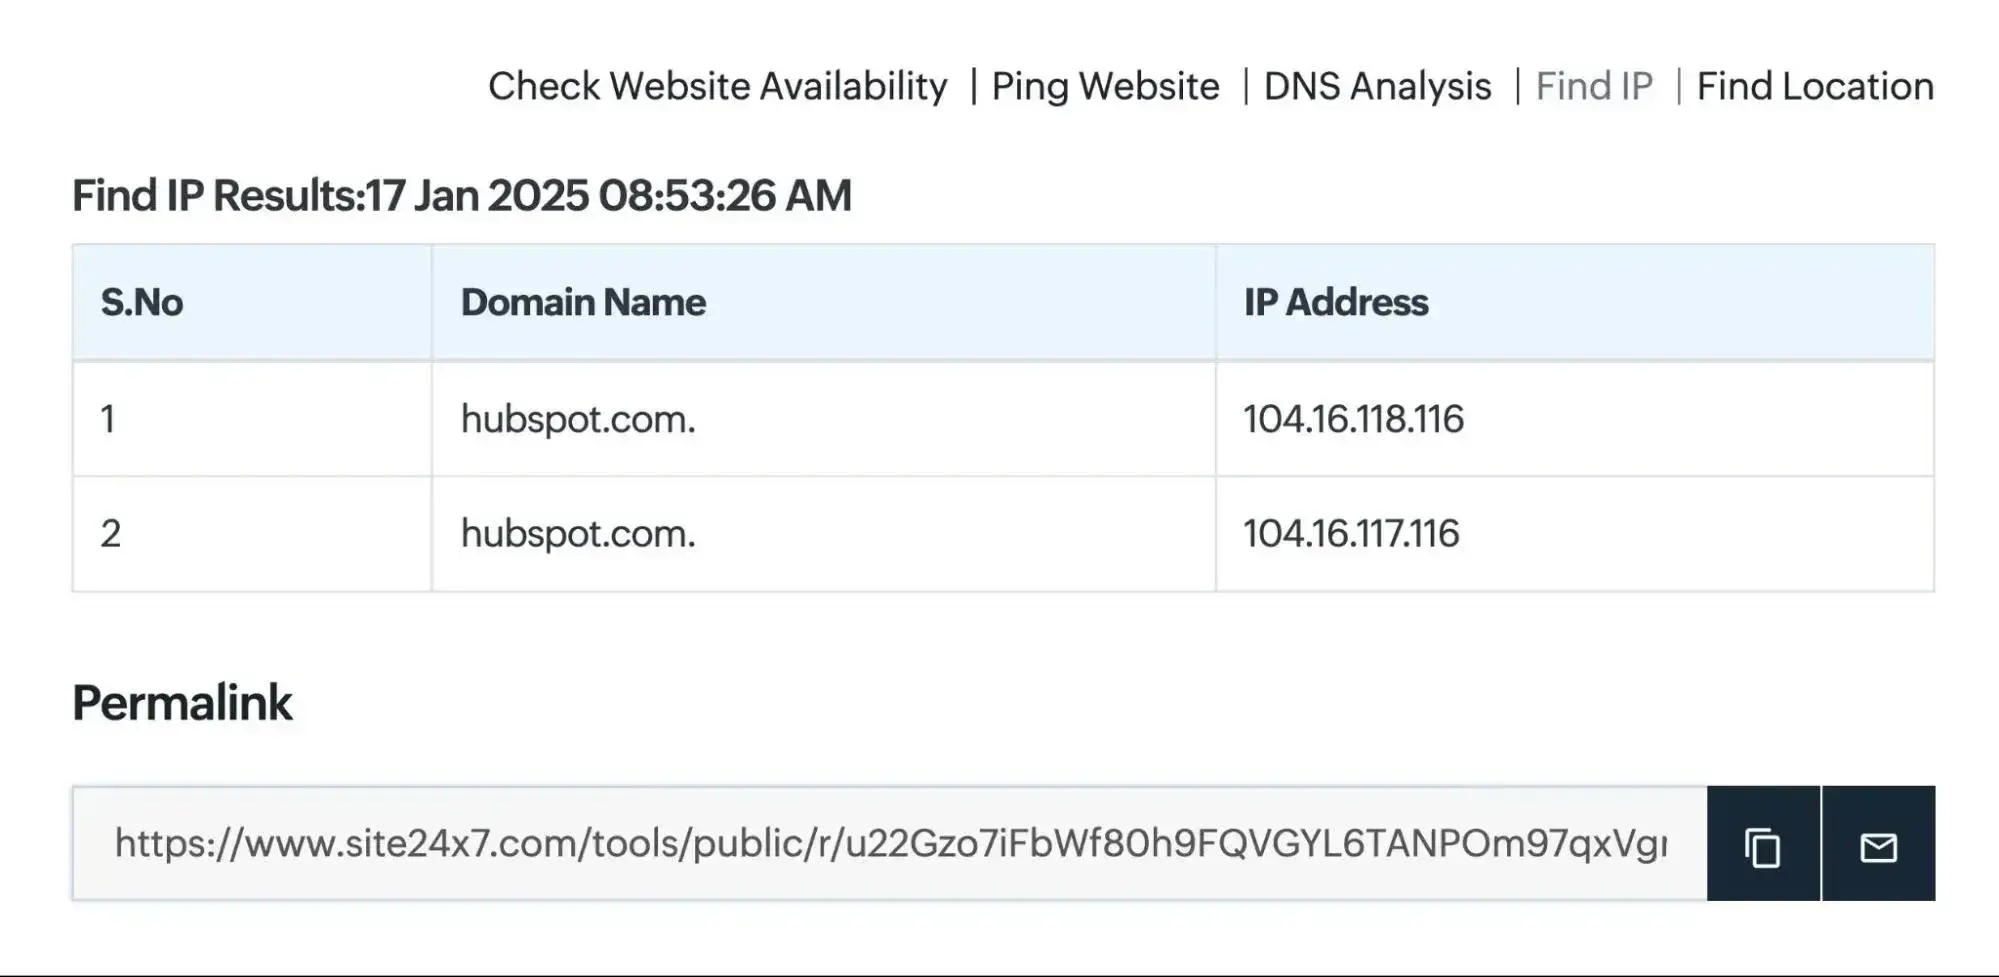
If this sounds new, that’s because most people have been using domain names to reach websites. While a website can be accessed using its IP address, most internet users prefer to use domain names or search engines.
Domain names are connected to website server IPs using something called the Domain Name System (DNS). To be a web developer, it's essential to understand how DNS works.
Pro tip: To find a device’s IP address, type “what’s my IP address” into a search engine.
3. What does HTTP mean?
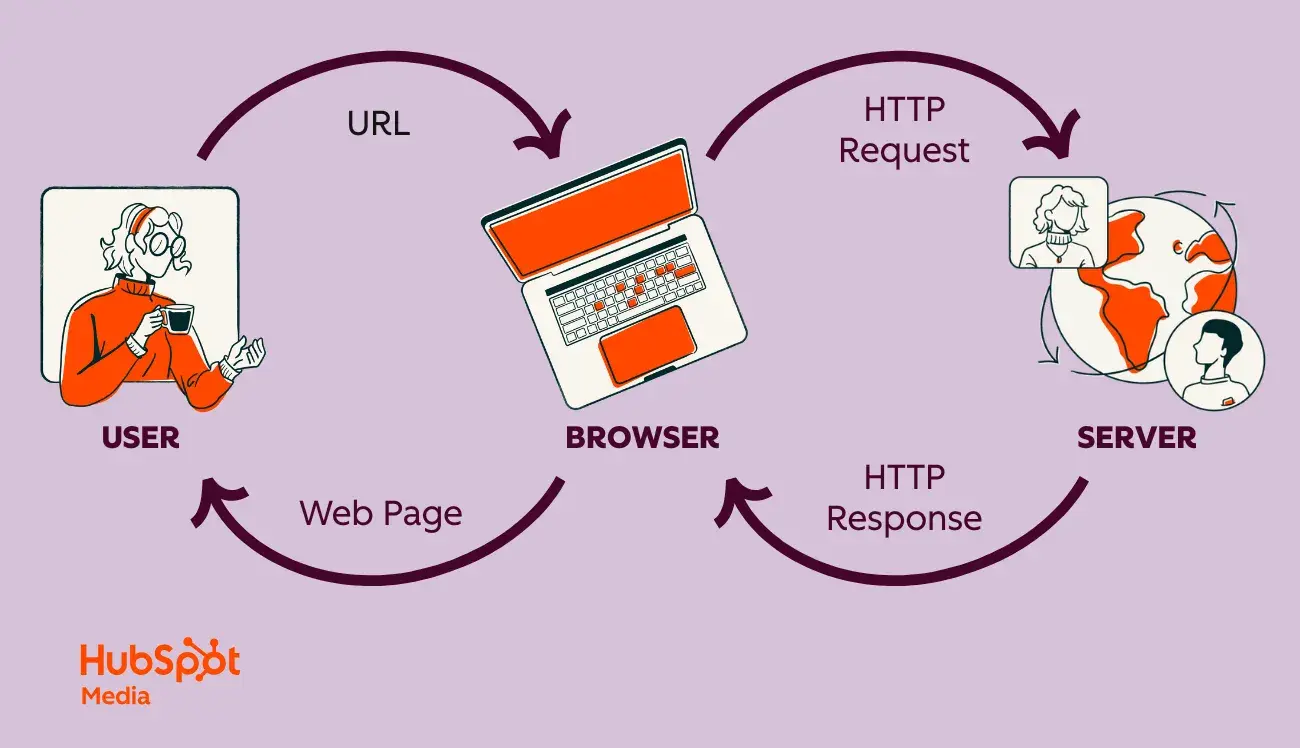
HyperText Transfer Protocol (HTTP) is what connects a website request to the remote server that houses all website data. It’s a set of rules (a protocol) that defines how messages should be sent over the internet. It allows users to jump between site pages and websites.
If a person types a website into a web browser or searches for something through a search engine, HTTP provides a framework so that the client (computer) and server can speak the same language when they make requests and responses to each other over the internet.
It’s essentially the translator between the web user and the internet. HTTP reads a website request, reads the code sent back from the server, and translates it into a visible website.
Understanding HTTP is important for all aspects of web development, but it's especially essential for anyone interested in back-end development.
4. What is coding?
Coding refers to writing code for servers and applications using programming languages. They’re called “languages” because they include vocabulary and grammatical rules for communicating with computers. They also include special commands, abbreviations, and punctuation that can only be read by devices and programs.
All software is written in at least one coding language, but languages vary based on platform, operating system, and style. All languages fall into one of two categories: front-end and back-end.
Pro tip: Sometimes, businesses seek a full-stack developer. This means that the developer has expertise in both the front end and the back end.
5. What does front-end mean?
Front-end (or client-side) is the side of a website or software that people see and interact with as an internet user. When website information is transferred from a server to a browser, front-end coding languages allow the website to function without having to continually “communicate” with the internet.
Front-end code allows users to interact with a website and play videos, expand or minimize images, highlight text, and more. Web developers who work on front-end coding work on client-side development.
6. What does back-end mean?
On the contrary, the back-end (or server-side) is the side that people don’t see when they use the internet. It’s digital infrastructure. To non-developers, it looks like a bunch of numbers, letters, and symbols.
There are more back-end coding languages than front-end languages. That’s because browsers (the front end) only understand HTML, CSS, and JavaScript. Meanwhile, a server (the back end) can be configured to understand pretty much any language.
7. What is a CMS?
A content management system (CMS) is a web application or a series of programs used to create and manage web content. (Note: A CMS isn't necessarily the same thing as a site builder, such as Squarespace or Wix.)
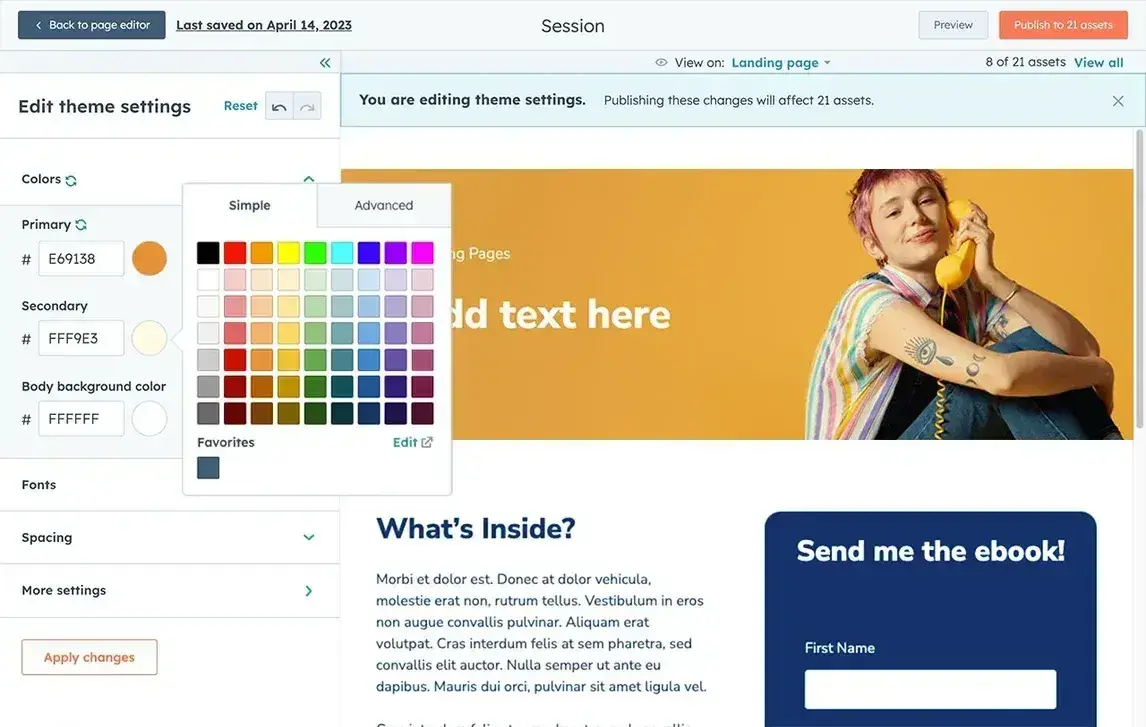
While not required to build a website, using a CMS makes things easier. It provides the building blocks (like plugins and add-ons) and lets developers create the structure with their code. HubSpot CMS, for example, offers drag-and-drop functionality. Users can build a website without knowing how to code.
Pro tip: A CMS is often used for ecommerce and blogging, but it's useful for all types of websites. It can be especially helpful for businesses that need to display and organize large amounts of data.
8. What is cybersecurity?
There are always malicious actors looking to find vulnerabilities in websites to expose private information, steal data, and crash servers. Cybersecurity is the practice of securing data, networks, and computers from these threats.
The methods used by hackers are constantly evolving, as are the security measures taken to defend against them. Failing to understand how a site could be targeted could result in disaster.
As a result, a basic understanding of cybersecurity best practices is critical for effective web development. Developers should also carry out security audits on a consistent basis. This ensures that websites do not fall victim to bad actors attempting to steal sensitive information.
These different types of web development primarily refer to the different sectors of the profession in which web developers can work. Some of these distinctions overlap, and web developers will often master multiple types of web development. While a web development intro won’t teach a developer each language, they should know the difference.
1. Front-End Development
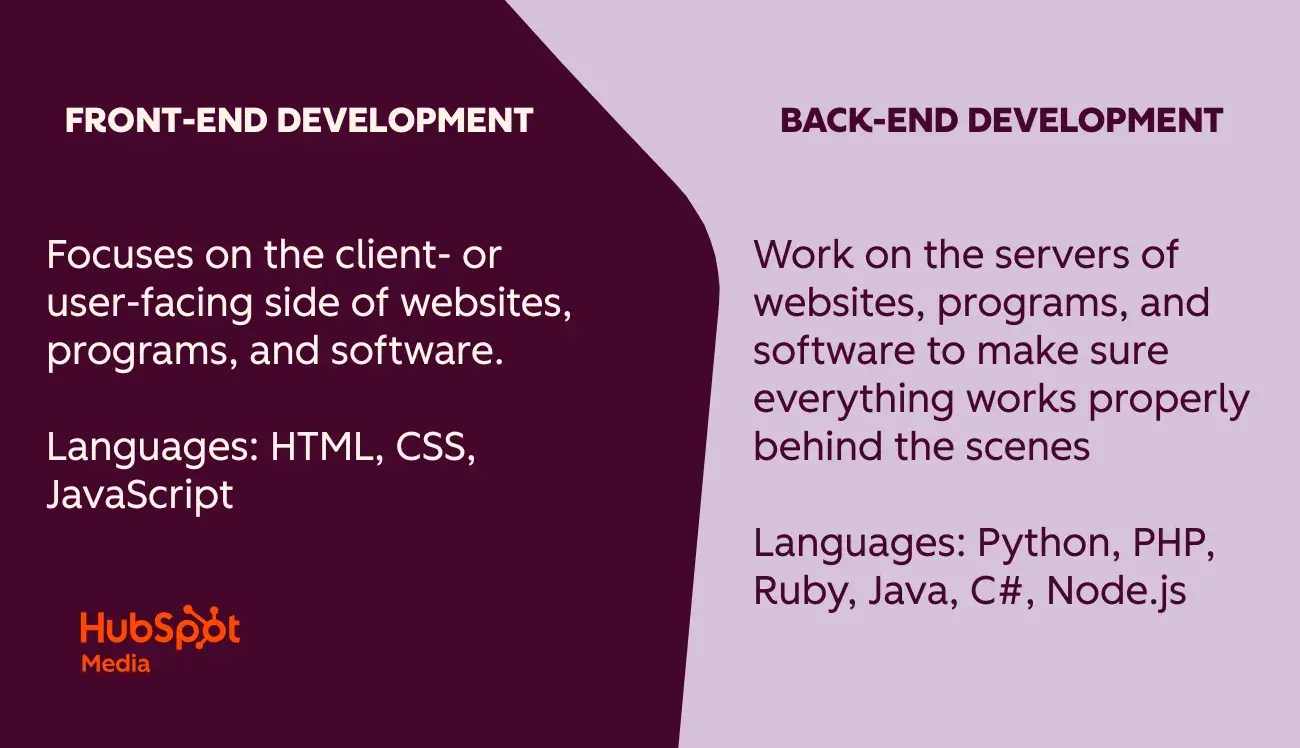
Front-end developers work on the client- or user-facing side of websites, programs, and software. This is what users see. They design and develop the visual aspects, including the layout, navigation, graphics, and other aesthetics.
Front-end developers build interfaces that help users reach their goals. They also often work on the user experience aspect of their projects.
2. Back-End Development
If the front end is what users see, the back end is what they don’t. Back-end web developers work on the servers of websites, programs, and software to make sure everything works properly behind the scenes.
These developers work with systems like servers, operating systems, APIs, and databases, and manage the code for security, content, and site architecture. They collaborate with front-end developers to bring their products to users.
3. Full Stack Development
Full-stack development combines front-end and back-end skills. Full-stack developers can create a website, application, or software program from start to finish. “Stack” refers to the different technologies that handle different functionalities on the same website, like the server, interface, etc.
Because full-stack developers require years in the field to build the necessary experience, this role is often sought after by companies looking to build or update their websites. The developer's all-around knowledge helps them optimize performance, catch issues before they occur, and help team members understand different parts of a web service.
This comprehensive skill set is typically covered in a full-stack developer course. To be well-versed in all things web development, take one of these courses.
4. Website Development
Website developers can be front-end, back-end, or full-stack developers. However, these professionals specialize in building websites, as opposed to mobile applications, desktop software, or video games.
5. Desktop Development
Desktop developers specialize in building software applications that run locally on devices, rather than over the Internet in a web browser. Sometimes, the skill set of these developers overlaps with web developers if an application can run both online and off.
6. Mobile Development
Mobile developers build applications for mobile devices such as smartphones or tablets. Mobile apps operate much differently than other websites and software programs, thus requiring a separate set of development skills and knowledge of specialized programming languages.
(Even for those not building a mobile application, it’s important to ensure that a website is mobile-friendly.)
7. Game Development
Game developers specialize in writing code for video games, including console games (Xbox, PlayStation, etc.), PC games, and mobile games, which means this specialty overlaps somewhat with mobile development.
8. Embedded Development
Embedded developers work with all hardware that isn't a computer (or, at least, what most of us imagine as “computers” with a keyboard and screen). This includes electronic interfaces, consumer devices, IoT devices, real-time systems, and more. With a recent rise in interconnected devices, demand is growing for embedded development.
9. Security Development
Security developers establish methods and procedures for securing software programs or websites. They typically work as ethical hackers, trying to “break” websites to expose vulnerabilities without intending harm. They also build systems that discover and eradicate security risks.
The Website Development Process
Once the basics of web development are clear, the next step is to understand how a website actually comes to life. From defining goals to writing code and launching a finished product, each phase plays an essential role in the overall process.
1. Form a plan.
Before laying pen to paper or hands to keyboard, it's vital to first connect with teams and personnel across an organization to develop a plan for the website.
Here are some questions to consider before the first site draft:
- What is the goal of the website?
- Who is the audience, and what should visitors do on the website?
- What type of website is being built (e.g., basic information, membership, online store)?
- What content is being published, and at what volume?
- What’s the purpose of this content?
- How will the website be structured for the best navigational experience?
- What’s the budget?
Answering the questions requires interfacing with web development, marketing, and financial teams to determine priorities and make informed decisions. Put simply, it’s much easier to create a roadmap at the beginning of the process than to reverse progress at a roadblock.
It‘s especially important that the entire team is on the same page, so ensure consistent communication among all team members.
2. Create a wireframe.
All good websites start with a blueprint. Developers call this a wireframe. It doesn’t have to be an official document. It’s simply a vision for the site that’ll give both the project team and the developer(s) direction and a place to start. It can be drawn on a whiteboard or created using a tool like Figma, Slickplan, or Mindnode.
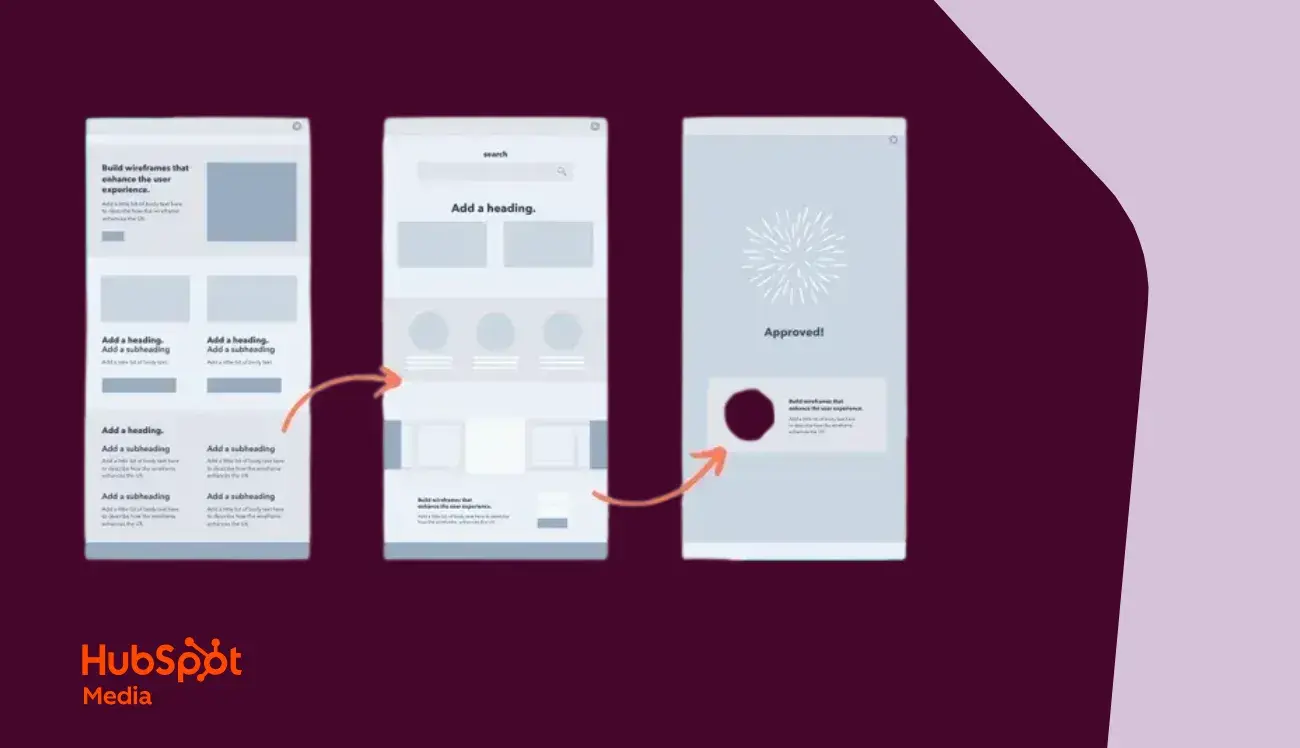
Wireframes are strictly visual tools that help identify where text and images will go on individual web pages. Blank boxes and “dummy text” can be used to get an idea of how content will appear on the front end. When working with a company or freelancer, creating a wireframe provides a shared understanding of what the final product will be.
3. Draft up a sitemap.
Next, it’s time to create a sitemap (not to be confused with sitemap.XML, which is an XML file that helps search engines crawl and find a site). Just like a business plan gives a potential investor insight into goals and deliverables, a sitemap gives a developer the information needed to meet the project vision. The sitemap can be created internally or in collaboration with developer(s).
Here are a few questions to ask during site planning:
- What individual pages are needed?
- What content will be on those pages?
- How can those pages be organized into categories?
- What is the hierarchy of pages on the site?
- How will the pages link together?
- What pages and categories are essential to user experience?
- Which pages or categories could be removed or combined?
It’s a good idea to consult with other teams within the organization. If an SEO and/or content strategy team exists, their input will be critical in determining linking structure and page categorization.
4. Build the back end of the website.
Writing code might be one of the more complicated parts of web development, but it’s hardly the only component. It’s also necessary to build the back-end and front-end site structures and design.
The back end handles the data, which enables functionality on the front end. For example, Facebook's back end stores photos so that the front end can then allow others to view them. It’s made up of two key components:
- Databases are responsible for storing, organizing, and processing data so that it’s retrievable by server requests.
- Servers are the hardware and software that make up a computer. Servers are responsible for sending, processing, and receiving data requests. They’re the intermediary between the database and the client/browser.
The browser will, in effect, tell the server a piece of information is needed and the server will know how to get that information from the database and send it to the client.
These components work together to build the foundation for each website.
As for building the website, backend developers will establish three things:
- Logic code, which is a set of rules for how the website will respond to certain requests and how objects will interact.
- Database management, which defines how the website will organize, manage, and retrieve its data.
- Infrastructure, which determines how the site will be hosted. Hosting a site independently provides greater control but is more expensive and requires maintaining server health and security.
Alternatively, managed hosting providers like Kinsta or WP Engine can simplify the process. These platforms handle infrastructure, optimizing performance, and ensuring security updates are managed automatically.
With these components and decisions in place, the website will be ready for front-end development.
Note: The back-end is slightly tangential to web development because a back-end isn’t always needed if no data is being stored. “Data” in this context means any user-entered information that needs to be saved and persisted.
Consider logging in to a website. If the website doesn't have a back-end, it cannot remember login information or profile settings. A back-end is required to retrieve this information.
Facebook, for example, needs to know who is on each user’s Friends list, what events they have joined, what posts they have created, and more. This is all “data” that lives in a database. Without a back-end and database, none of that data would be accessible.
On the other hand, a website that’s purely informational and doesn’t require users to enter any data wouldn’t need a back-end.
So, if no data is required, a back-end isn’t necessary.
5. Build the front end of the website.
Anyone who has dabbled in web design or experimented with a website in WordPress, Squarespace, or Google Sites has worked with front-end web development. The front-end component is important. It’s what visitors, customers, and users see and how they interact with a website.
Front-end (or client-side) development includes a combination of JavaScript, HTML, and CSS. It also controls components such as typography and fonts, navigation, positioning, browser compatibility, and responsiveness. This part reflects the initial site vision and what was included in the wireframe.
As technology and consumer preferences evolve, client-side coding tends to become outdated faster than back-end development. This is where coding resources and continuous learning become essential.
6. (Optional) Work with a CMS.
A CMS, or content management system, offers an alternative to coding “by hand” or “from scratch.” While a CMS is less flexible and offers less control over the front end, it is easier to use and requires less coding.
A CMS often includes tools for hosting the site, creating web pages, storing user information, publishing blogs, creating landing pages, capturing leads, and even building email lists. This allows websites to become more profitable with significantly less effort.
CMS options frequently include plugins that eliminate the need to write a back-end. For instance, WordPress offers ecommerce plugins that eliminate the need for a complex back-end to process payments manually.
Popular content management systems include HubSpot CMS, Joomla, Magento, and WordPress, which holds around 60.7% of market share. (In this case, the reference is to open-source WordPress software, not the WordPress.com site builder.)
7. Acquire a domain name.
At this point, the website will have an IP address. It also needs a domain name, which is a memorable website name that visitors can use to find the site. It’s also necessary to ensure the desired domain name isn’t already in use.
Sites like GoDaddy and Hover help users purchase a domain name and register with ICANN (Internet Corporation for Assigned Names and Numbers). Most domain registrations are valid for one year before renewal is required.
Website builders and hosting services, like WordPress.com and Squarespace, also allow domain name purchases.
8. Launch the site.
Once a domain name has been set up and linked to the host, the website is almost ready to go live.
Before launch, however, there are still a few important steps to complete. These tasks include assigning team responsibilities, conducting thorough prototype testing to identify glitches, optimizing the site for SEO, and performing a final pre-launch review.
It’s also essential to address all legal requirements for an online website, such as displaying a privacy and cookie policy or a proper cookie consent banner to your visitors. Compliance plays a vital role in preventing potential legal issues, yet it’s often overlooked.
Front-End Web Development Languages
Front-end web development focuses on creating the visual and interactive elements of a site. It involves designing and building the user-facing side — what visitors see, essentially, when a site is opened in a web browser. These languages are often taught during a web development intro.
From my perspective, front-end development is likely the “easiest” way to begin a career in web development. That said, as with any other aspect of this field, it will have a learning curve (that’s explained later).
Here are some of the most popular front-end web development languages. Understanding these will be essential for a front-end developer.
HTML (Hypertext Markup Language)
HTML is likely the language most people first think of when it comes to web development, and with good reason: HTML is the backbone of any web page. It provides both semantic structure and defines the elements of a website, such as headings, paragraphs, images, and links. Web developers use HTML to give content a proper layout before customizing it.
CSS (Cascading Style Sheets)
If HTML is the backbone of a site, then CSS is the muscle. CSS is responsible for styling the visual appearance of a website. It allows developers to customize colors, fonts, layouts, and other design elements. With CSS, developers can also create responsive web pages that adapt to different screen sizes.
While developers can always write their own CSS from scratch, there are also many CSS frameworks that can help them more quickly and easily style a website.
JavaScript
JavaScript is a dynamic programming language that adds interactive elements to web pages, such as dropdown menus, sliders, forms, and animations.
JavaScript is widely used for client-side scripting (that is, the script runs on the client’s browser and not on the server that hosts the website). JavaScript generally enhances the user experience by making websites more dynamic and engaging.
There are also a number of popular JavaScript frameworks and libraries that can help, including jQuery and React.
Front-end languages play a crucial role in creating visually appealing, intuitive, and interactive websites. Don’t underestimate them: A website may have the best back-end structure, but unless the UI is modern, interactive, and user-friendly, it won’t be as appealing to a visitor.
Front-End Web Development Roadmap
Here’s a roadmap that outlines the general process for learning front-end web development. Basically, to get started with front-end web development, do things in this order.
- Understand the basics of how websites work.
- Learn HTML to create a basic web page.
- Use CSS to style the web page.
- Add interactivity with JavaScript.
- Deploy a website.
- Expand knowledge.
Understand the basics of how websites work.
Before writing any code, it’s important to start by learning how websites and the internet function. Understanding these basic principles creates the groundwork for everything else in web development.
Here are some of the key areas and questions to focus on when starting out:
- How devices communicate on the internet.
- What HTTP is and how it works .
- What HTTPS is and how it works.
- Domain names and the Domain Name System (DNS).
- How web browsers work at a fundamental level.
- How APIs work (Application Programming Interface).
- What the Document Object Model (DOM) is.
Learn HTML to create a basic web page.
HTML is the foundation of front-end website development. Once the basic principles of how websites work are understood, learning HTML becomes the next logical step on the front-end roadmap.
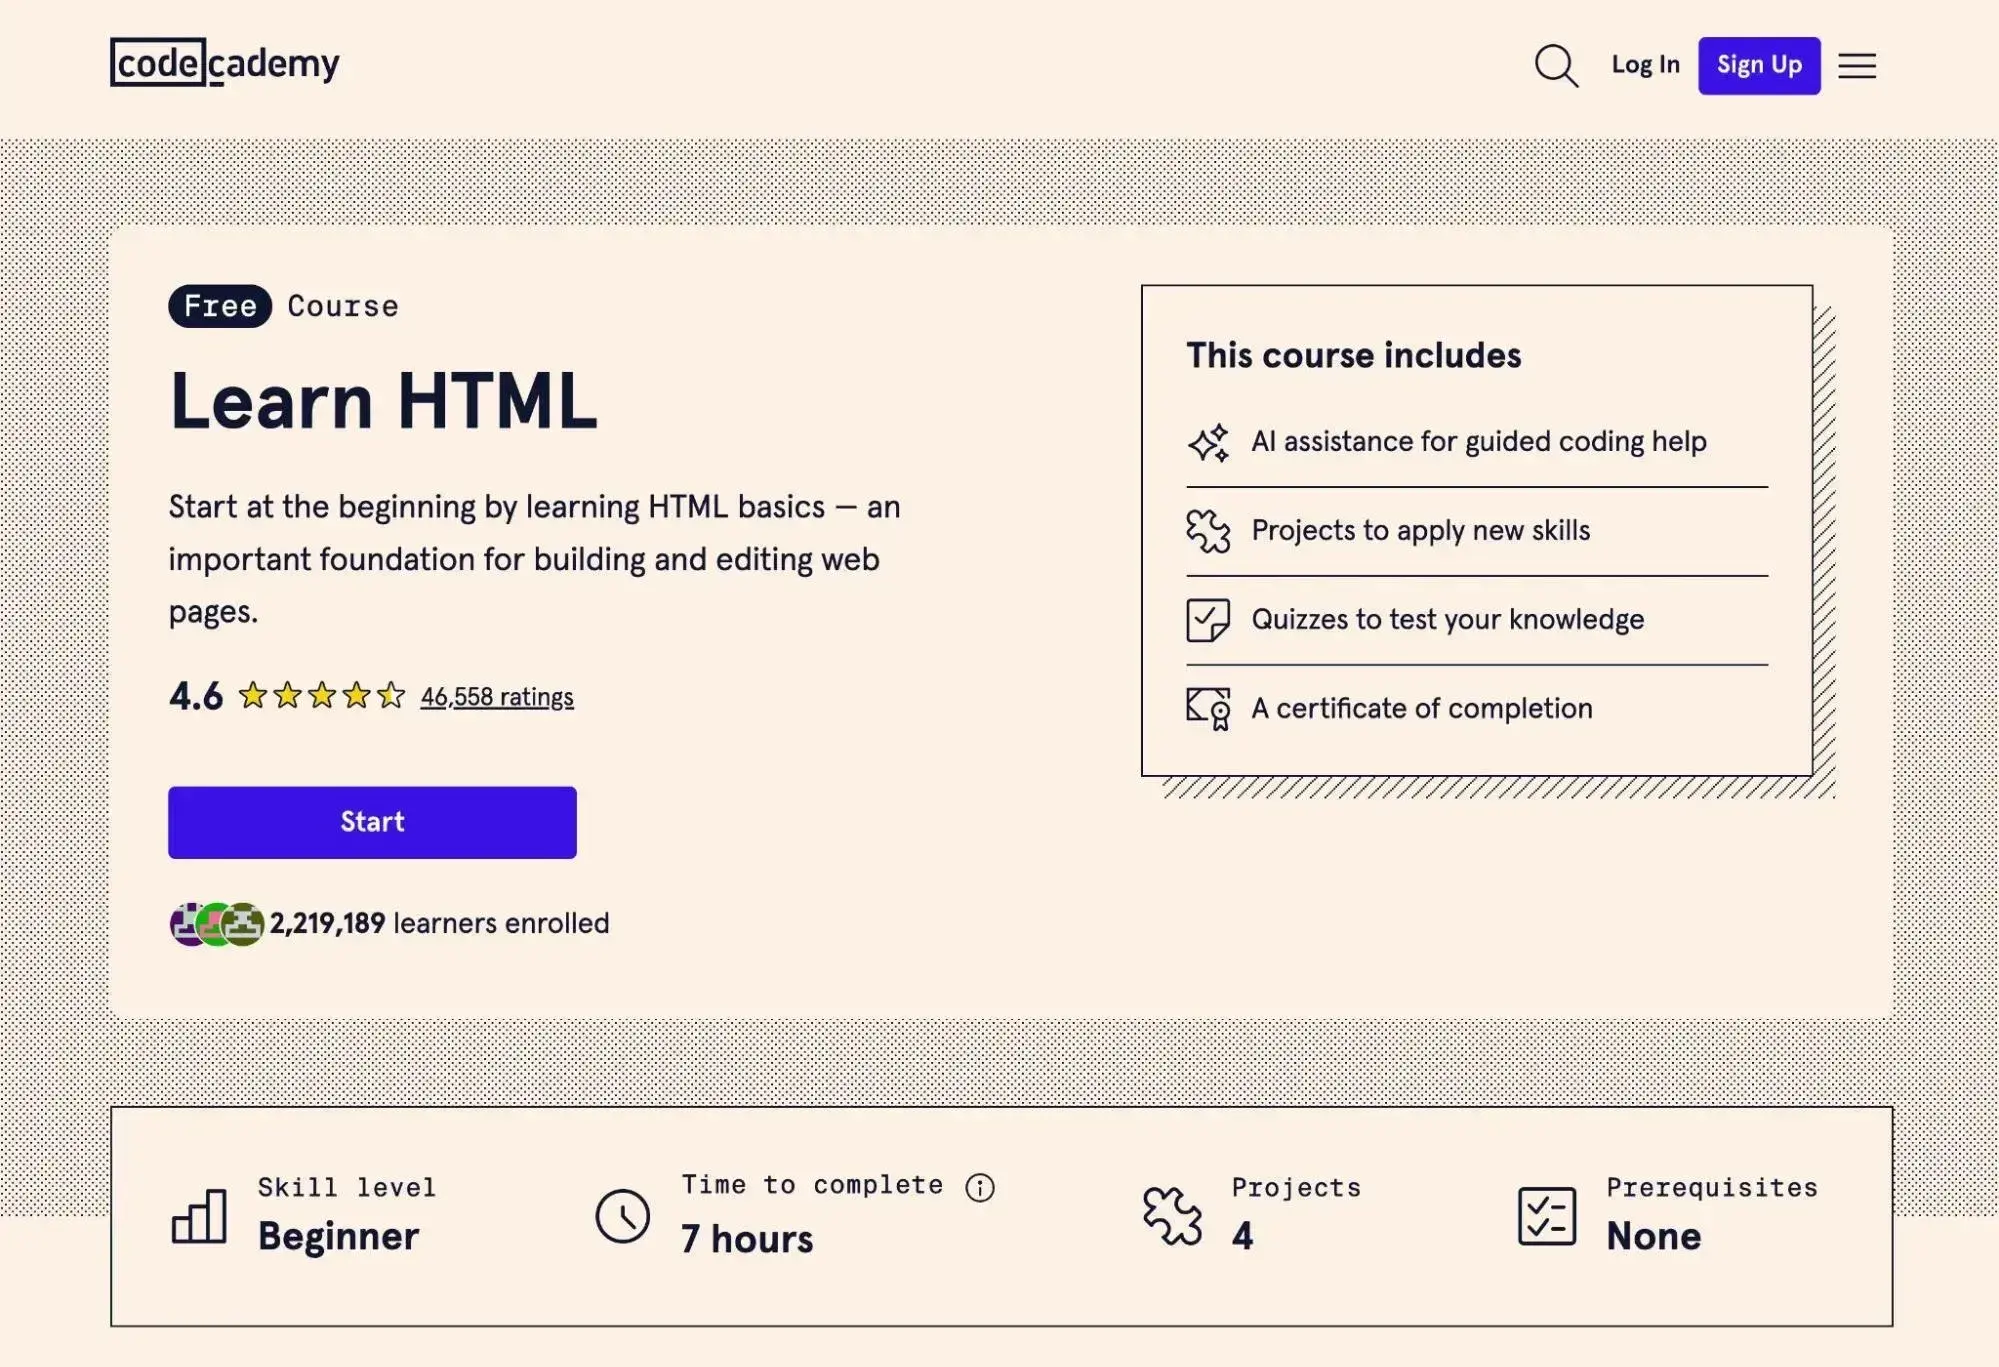
Beginners can explore HubSpot’s beginner’s guide to HTML for practical tips on getting started, or try beginner-friendly HTML projects to apply new skills. Codecademy also offers a free HTML course that covers all the key fundamentals of the language.
Use CSS to style the web page.
HTML forms the structure of a web page, but adding CSS is what gives it visual appeal. CSS controls the design elements of a website, including colors, fonts, layouts, and spacing.
HubSpot’s ultimate guide to CSS provides a thorough introduction, along with other guides to some specific aspects of CSS, including:
Codecademy also offers a free CSS course that complements the HTML course.
To work more efficiently, developers can also explore CSS frameworks. Learning popular frameworks like Bootstrap or Tailwind CSS can significantly speed up styling and introduce more advanced design capabilities.
Add interactivity with JavaScript.
With just HTML and CSS, developers can create well-structured and visually appealing websites. To make websites interactive, learn JavaScript. JavaScript adds functionality that responds to user actions, such as button clicks, animations, or dynamic content updates.
Codecademy has a great free course on JavaScript that covers core concepts, including conditionals, functions, scope, arrays, and loops.
Deploy a website.
After building a basic website with HTML, CSS, and JavaScript, the next step is deployment, or making the website accessible to users around the world.
If the website does not require any back-end functionality, it can be hosted on various free or paid platforms. Cloudflare Pages, Netlify, and Vercel are popular options for hosting static websites. Deployment typically involves uploading project files to a host and connecting a custom domain.
Expand knowledge.
Once comfortable with HTML, CSS, and JavaScript, a developer has a solid foundation in front-end web development. Continuing to build on this foundation is key to long-term growth. Some areas worth exploring include:
- Learning additional front-end languages.
- Experimenting with different JavaScript and CSS libraries to find some that fit specific project needs.
- Learning some back-end development to build more advanced websites.
- Working with off-the-shelf content management systems like HubSpot Content Hub, WordPress, Webflow, and so on.
Back-End Web Development Languages
While front-end developers focus on creating the user-facing elements of a website, back-end developers work behind the scenes to ensure everything runs smoothly. Without back-end developers doing so, front-end developers wouldn't be able to go in and get their job done.
Here are some of the most common back-end web development languages. Most go beyond a web development intro but are helpful to be familiar with.
Python
Python is a versatile and more beginner-friendly programming language known for its readability and simplicity. It offers a wide range of frameworks, such as Django and Flask, that simplify back-end development tasks like database management and handling HTTP requests. Python's extensive libraries and frameworks make it a popular choice among back-end developers.

In addition to back-end development, Python also has a ton of other use cases for automation, data analysis, and more. This makes it one of the most versatile back-end development languages to learn.
PHP
PHP is a widely used server-side scripting language specifically designed for web development. It seamlessly integrates with HTML and provides powerful features for handling databases, generating dynamic content, and interacting with web servers.
Popular PHP frameworks like Laravel and Symfony enhance productivity and maintainability for complex web applications. WordPress also relies heavily on PHP, so learning this language is essential for working with WordPress.
Ruby
Ruby is a dynamic and object-oriented programming language that prioritizes simplicity and readability. It is most commonly associated with the Ruby on Rails framework, which provides a structure for building robust and scalable web applications.
Ruby's elegant syntax and extensive ecosystem make it a preferred choice for web development projects.
Java
Java is a versatile and widely used programming language known for its platform independence and scalability.
It is commonly used for building enterprise-level web applications that require high performance and security. Java frameworks like Spring and Hibernate offer tools for building complex back-end systems with ease.
C#
C# (pronounced C-sharp) is a modern, general-purpose programming language developed by Microsoft. It is primarily used for building Windows desktop applications and web services.
With the rise of the .NET framework, C# has gained popularity as a back-end language for developing scalable and secure web applications.
Node.js
Node.js is a JavaScript runtime (that is, the environment where JavaScript code executes) built on Chrome's V8 JavaScript engine. It allows developers to run JavaScript code on the server side, opening up opportunities for full-stack JavaScript development. Node.js is highly scalable, efficient, and ideal for building real-time applications and APIs.

Remember, back-end developers need to have a solid understanding of databases, server management, and web security, in addition to their language proficiency. That’s why back-end development is generally harder than front-end development, but it’s still learnable nonetheless.
Back-End Web Development Roadmap
Because back-end development can be a little more complex than front-end development, this roadmap will look a little more complex than the front-end development roadmap. Here are a few key steps along the journey:
- Choose a language and framework to get started.
- Learn about version control and repo hosting.
- Learn about databases.
- Learn about APIs.
- Learn how security works.
- Learn how testing works.
- Learn how to deploy web apps.
Choose a language and framework to get started.
The next step is choosing a backend language to use when getting started.
As skills develop, learning additional languages will help improve versatility. However, when beginning with backend development, it’s best to focus on one language and stick with it. A framework can also be selected to work more effectively. For example, developers might use JavaScript with Node.js, PHP with Laravel, or Python with Django.
For those who plan to work with WordPress websites, PHP is a practical starting point. Those building custom web applications can explore other languages and frameworks.
Learn about version control and repo hosting.
Version control and repo hosting are important for both front-end and back-end development. These topics are especially valuable for back-end development, which is why they hold a distinct place on the roadmap.
Version control helps manage, track, and organize different versions of back-end projects. Git is the best-known and most widely used version control system, though other options exist, including SVN and Mercurial.
To simplify access and collaboration, developers can use services such as GitHub, GitLab, or Bitbucket.
Learn about databases.
To store a website's data, a project will require some type of database.
There are two main types of databases:
- Relational databases like MySQL, SQLite, PostgreSQL, and others.
- Non-relational databases (NoSQL) like MongoDB, Redis, and others.
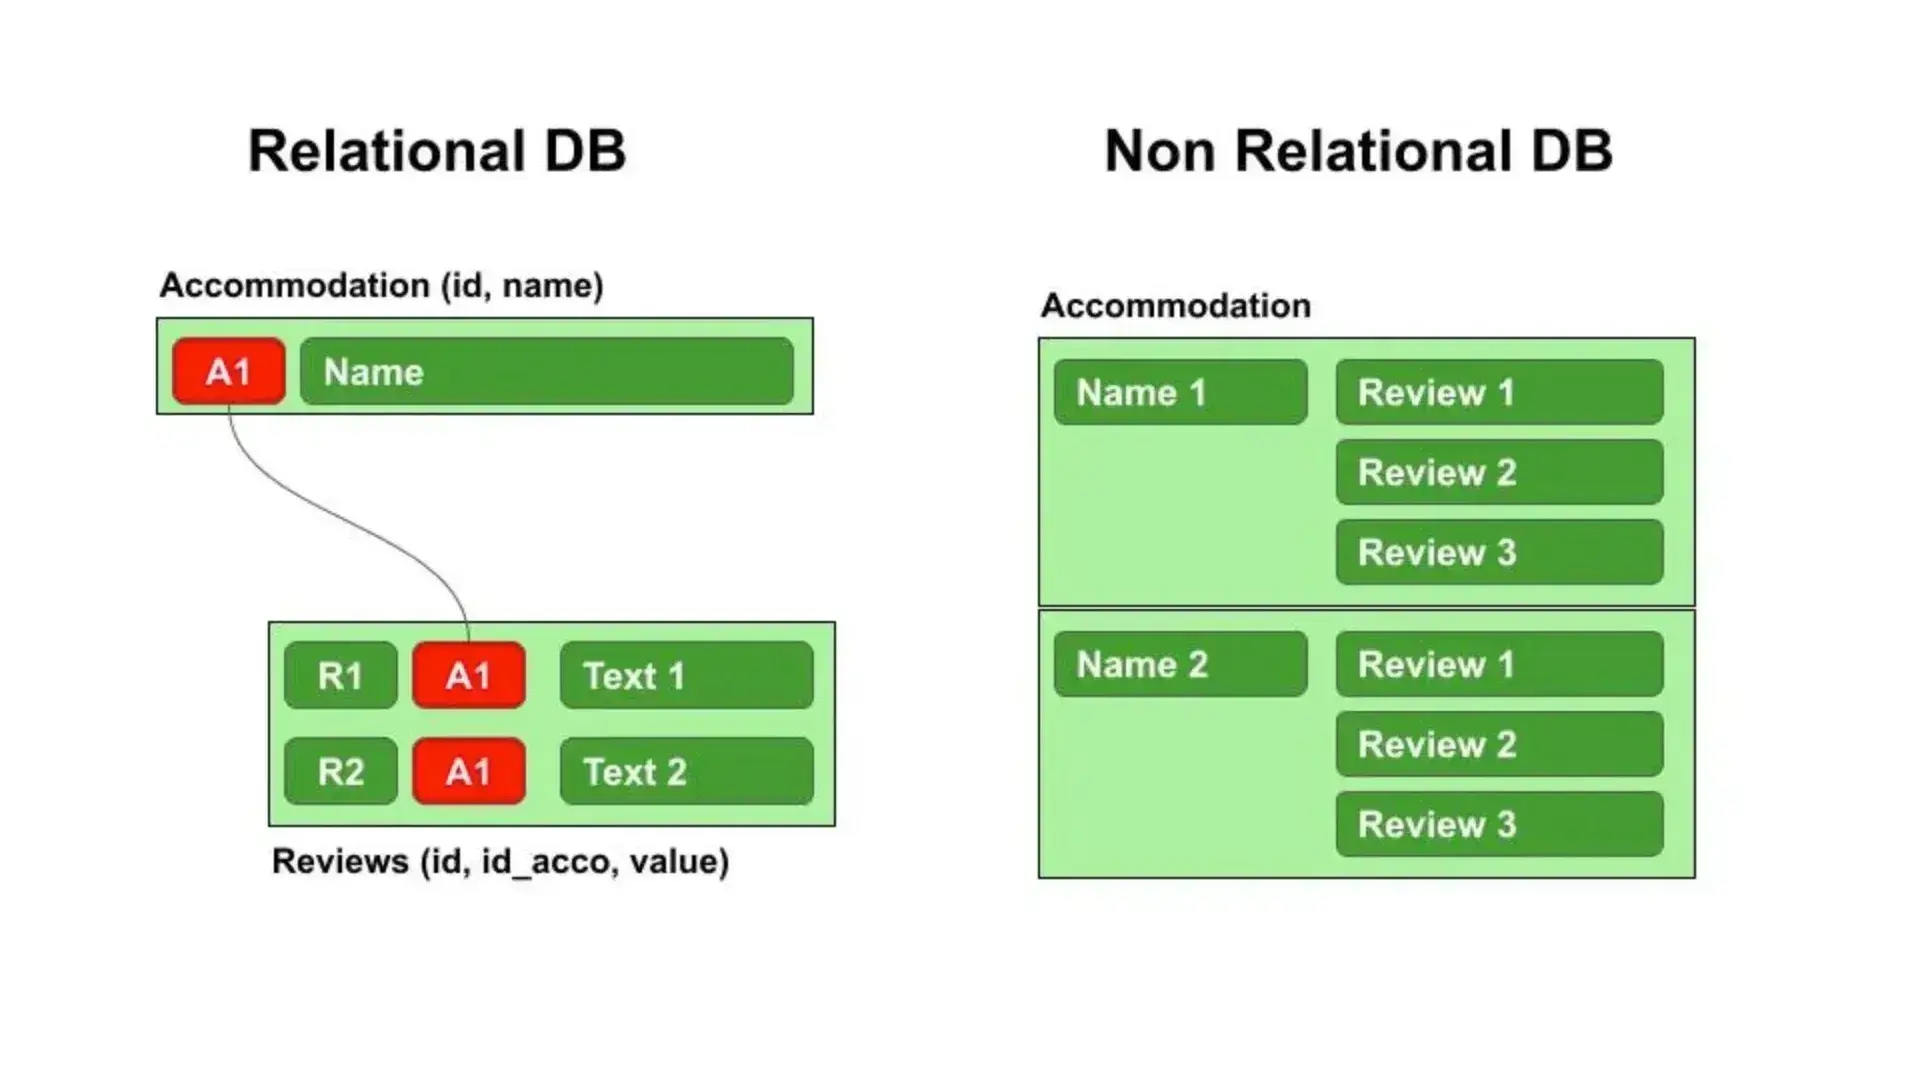
With back-end web development, starting with relational databases is often recommended. In general, unless there is a specific reason to use a non-relational database, relational databases serve as a solid default choice.
It’s also useful to learn about non-relational databases later on. HubSpot’s guide on database schemas is a good place to start exploring this topic.
Learn about APIs.
An API, short for Application Programming Interface, connects data in a database with the front end of a website. APIs are essential for building functional web applications, even when front-end development is handled by someone else.
To enhance technical understanding, learners can explore the following topics and technologies:
- REST (Representational State Transfer Application Programming Interface)
- JSON (JavaScript Object Notation)
- GraphQL
- SOAP (Simple Object Access Protocol)
- gRPC
- Webhooks
- WebSocket
Learn how security works.
To succeed in back-end development, developers must be able to build secure applications. Once they master the basics, the next step is understanding key security principles and applying them to real projects.
Here are some topics to learn:
- Password hashing (MD5, SHA, scrypt, etc.).
- HTTPS + SSL/TLS.
- Cross-Origin Resource Sharing (CORS).
- Server security principles.
- Content Security Policy (CSP).
- User authentication.
Here's a good guide with some general tips on secure back-end development.
Learn how testing works.
Understanding how testing works in back-end development is essential, particularly when projects move into production. Here are some common types of tests to learn about:
- Integration testing — making sure different components will work together as they should.
- Unit testing — testing individual components in isolation.
- Functional testing — testing to make sure the requirements for function are met.
Learn how to deploy web apps.
Once the foundational stages are complete, developers are ready to learn about deployments, including containerization and virtualization. It’s also helpful to understand how web servers operate.
Cloud platforms are another important area to explore, as each has unique features and workflows. Common examples include Amazon Web Services (AWS), Google Cloud Platform, and Microsoft Azure.
The back-end development journey continues well beyond deployment. After launching a project, the focus often shifts to optimizing performance and improving scalability. To achieve this, developers can learn about caching, indexes, load balancers, microservices, and other advanced topics.
Website Development Resources
Outside of connecting and networking with other developers, there are plenty of resources available to further an understanding of web development. These guides can help you throughout your web development intro.
Web Development Courses and Classes
Here are a few online courses and classes that are recommended by HubSpot’s developers. Many of these resources offer web development intros.
HubSpot Website Blog
The HubSpot Website Blog stands as a go-to source for both beginners and seasoned learners. With a focus on delivering actionable insights and practical advice, this blog simplifies the complexities of coding. It's a resource packed with expert tips, course recommendations, and industry trends that resonate with the evolving needs of web developers.
TutorialsPoint
All content and resources on TutorialsPoint are free. Between tutorials, ebooks, and videos, TutorialsPoint provides a host of learn-to-code options.
freeCodeCamp

freeCodeCamp is a non-profit organization that helps people learn to code for free. With thousands of articles, videos, and interactive lessons, as well as worldwide study groups, freeCodeCamp helps thousands of developers and engineers learn about programming.
egghead
According to their website, egghead provides “concise, information-dense video courses on the best tools in the industry.” Users can take courses, listen to podcasts, or take lessons on a wide variety of web development topics.
Khan Academy
Khan Academy is a well-known free educational resource. Users can learn anything from macroeconomics to linear algebra to US history, as well as a handful of computing topics.
SiteSaga
SiteSaga is a free online resource for beginners who want to create a website. It’s the ultimate website saga that covers simple and comprehensive guides on building websites. Mainly focused on non-developers and small businesses, it features the easiest ways to make websites using CMSs like HubSpot and website builders.
Codecademy
Codecademy offers many interactive courses on front-end and back-end web development. Some of these courses are free to take, while others require a paid plan. I've personally used it to learn PHP and front-end development (HTML, CSS, and JavaScript) and found the experience to be quite positive.
Team Treehouse
Team Treehouse is a subscription-based online learning program. Users gain access to hundreds of courses on over 25 different topics.
Web Development Communities
Web developers are masters of the Internet, so it makes sense that they hang out and connect in Internet-based communities. Here are a few online communities recommended by our HubSpot developers.
Stack Overflow
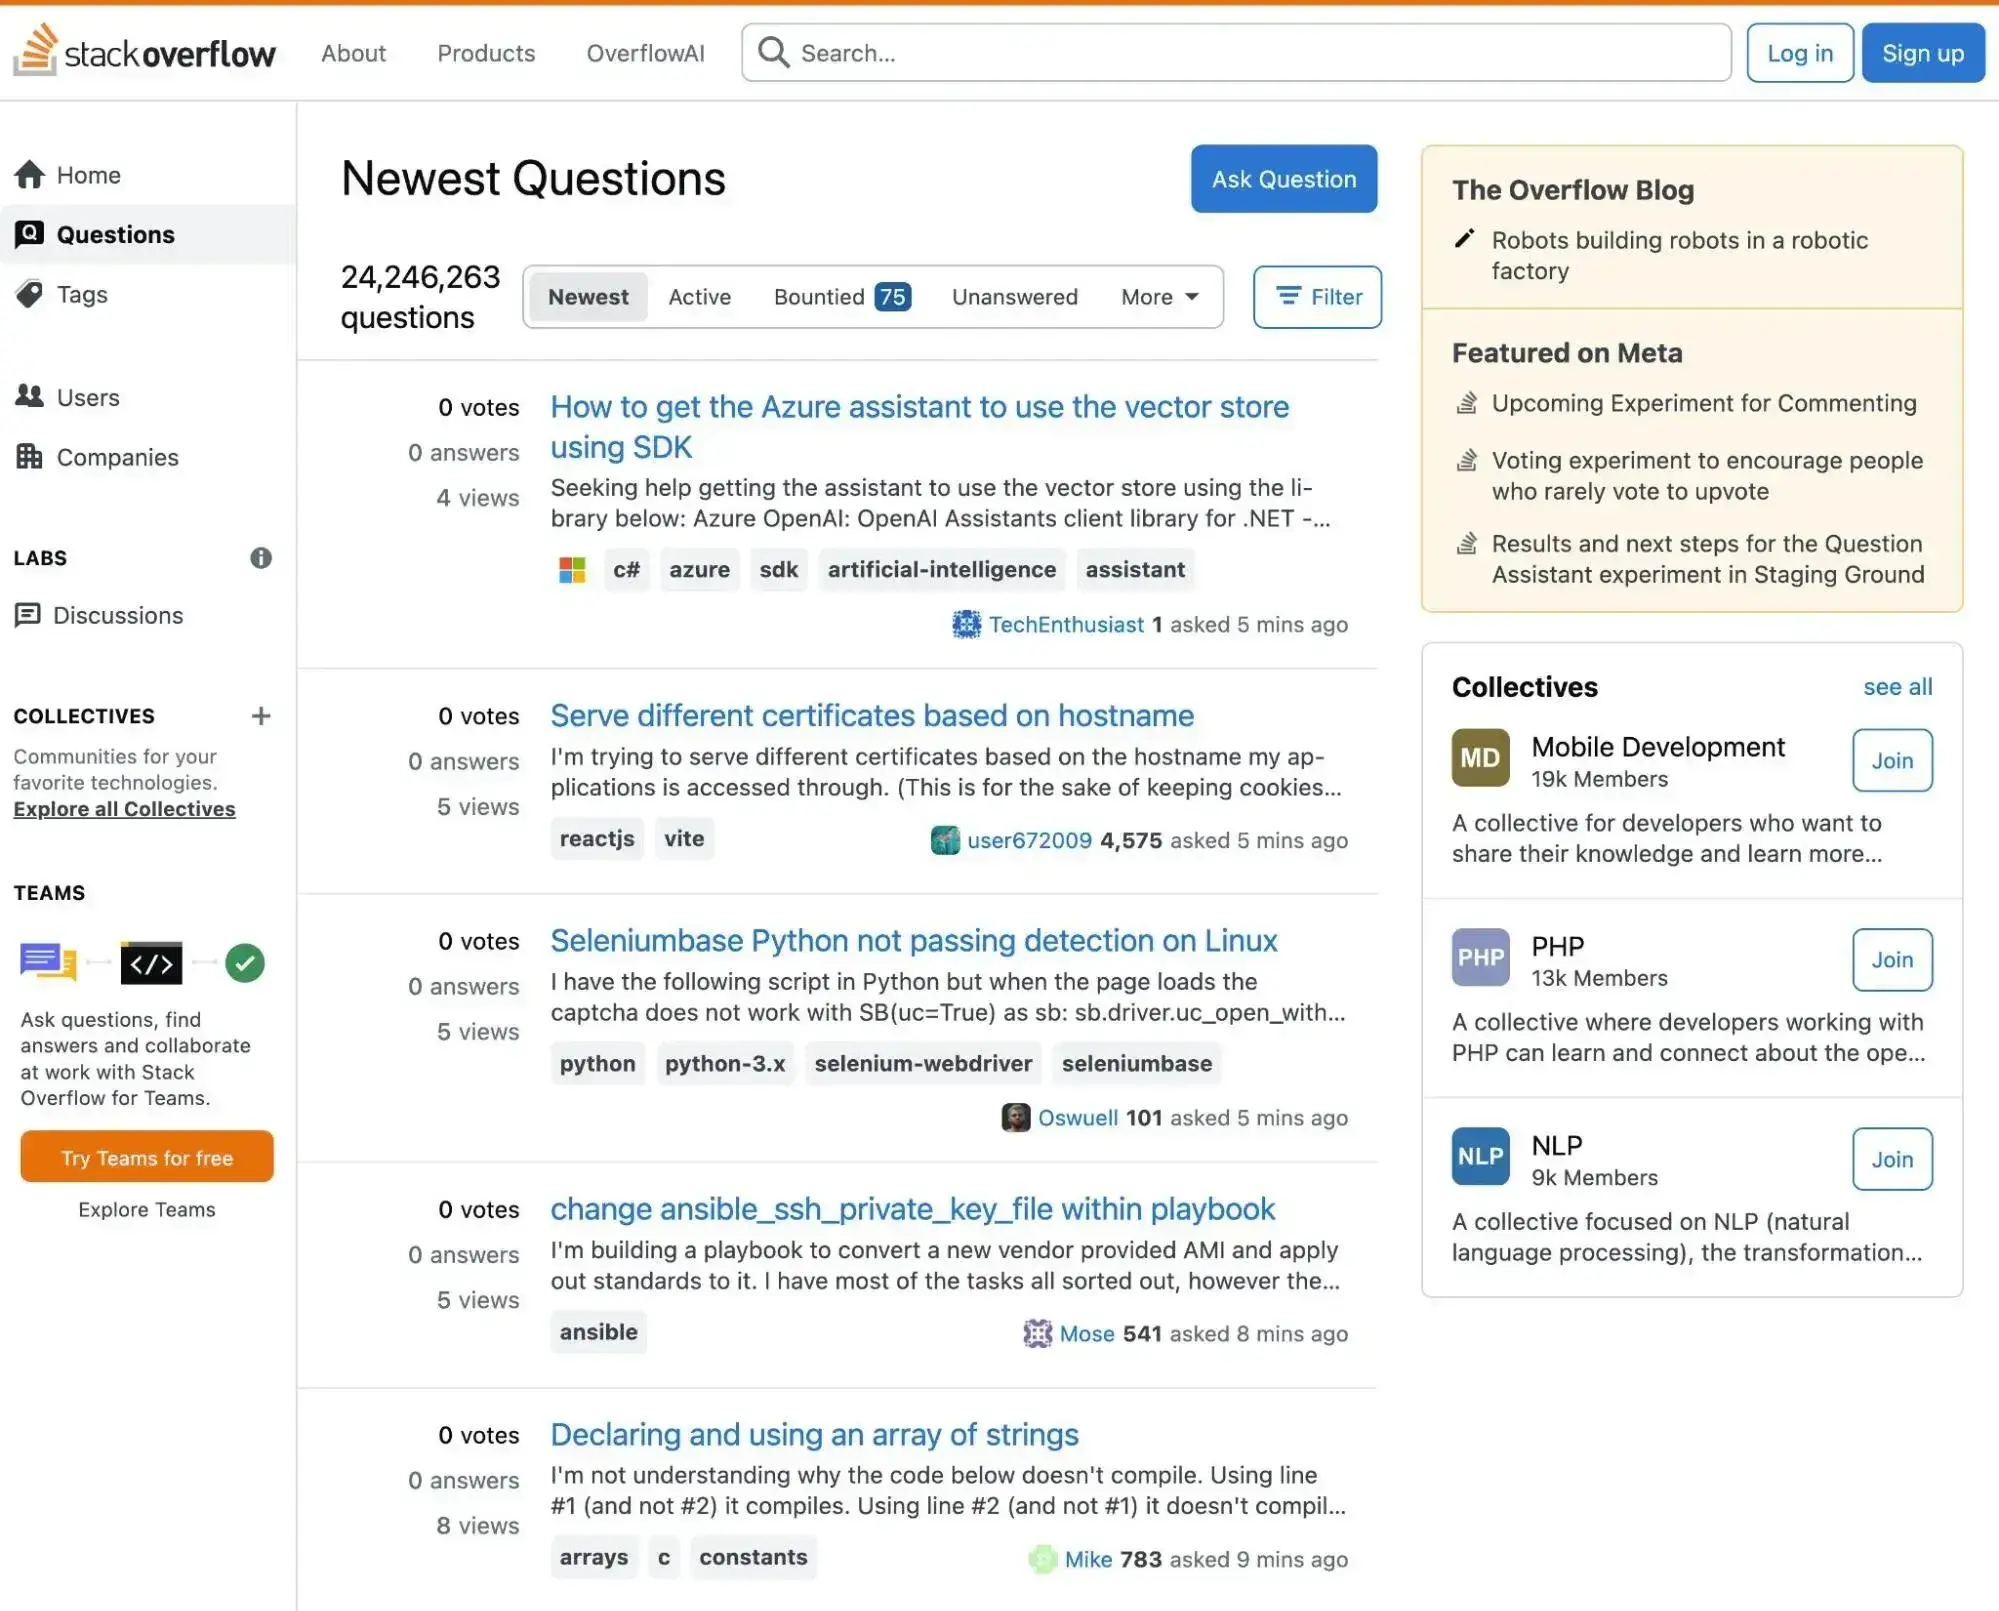
Stack Overflow was introduced over 15 years ago and has since become one of the most popular programming communities in the world. It’s a great place to go with questions because, most of the time, other developers have asked and answered the same ones. The forums in Stack Overflow inform developers and connect them to other developers.
Mozilla Development Network
Mozilla Development Network (MDN) is known to be more thorough and accurate than other online resources. It’s not as much a community as a comprehensive resource and library of documents for coding languages. MDN is useful when learning how certain functions work and staying up-to-date on coding and development news.
Reddit is a forum-based community where developers of all levels gather to ask and answer questions. It’s incredibly interactive and includes people from all over the world. Also, join “subreddits” based on specific topics such as web design, JavaScript, or freelancing.
Frequently Asked Questions About Web Development
How do beginners get started with web development if they have no experience?
The best way to begin is with a web development intro that helps beginners understand how the web works. These guides often feature the three core building blocks of every website: HTML, CSS, and JavaScript. Beginners often start by creating simple web pages and gradually move on to small projects.
What are the main types of web development roles?
Web development roles generally fall into three categories: front-end, back-end, and full-stack.
- Front-end developers focus on how a website looks and behaves in the browser.
- Back-end developers handle the logic, databases, and server-side processes that make websites function.
- Full-stack developers work across both areas, managing everything from the user interface to server deployment.
How long does it take to become job-ready in web development?
The timeline depends on the learner’s schedule, pace, and depth of study. Those studying part-time may take longer. Building a strong portfolio of real projects often matters more than the length of study, as employers value practical experience and problem-solving skills.
Do web developers need a computer science degree to start?
Beginners can start learning web development without a computer science degree. Many successful web developers are self-taught or trained through online courses, bootcamps, and personal projects. A formal degree can be beneficial for long-term career growth, but it is not a requirement for entry.
What can web developers actually build?
Web developers create a wide range of products, from personal websites and company homepages to complex web applications. As skills expand, developers can move into areas such as API development, automation tools, or AI-powered applications.
Where can beginners find resources to learn web development for free?
Popular learning platforms include freeCodeCamp, The Odin Project, and MDN Web Docs. YouTube channels such as Traversy Media, Programming with Mosh, and Kevin Powell provide practical tutorials for visual learners. HubSpot Academy also offers a course on how to build a web app. Combining resources with consistent practice and small projects builds skills over time.
Learning Along Your Web Development Intro
Working through a web development intro can be a turning point for many professionals. This field isn’t just about coding; it’s about reshaping the way people experience the digital world. Those who explore web development contribute to shaping a huge part of everyday life.
Whether the goal is to boost a business online or build the next big app, understanding web development is essential. The field continues to evolve rapidly, making it both necessary and exciting to stay engaged. There’s never a dull moment in web development.
Editor's note: This post was originally published in November 2018 and has been updated for comprehensiveness.
Website Development




![How to make a website with user accounts and profiles [with WordPress, Wix, and more]](https://53.fs1.hubspotusercontent-na1.net/hubfs/53/%5BUse%20(3).webp)
![How to build a Google Site that looks good and drives business [templates & examples]](https://53.fs1.hubspotusercontent-na1.net/hubfs/53/Website%20Redesign%20Terms.png)


