Let’s take off our marketing hats for a few minutes and talk food. Specifically burritos.
Who doesn’t love a good burrito? Tasty, filling, a full gastronomic delight. If you’ve been out and about in the last decade, you’ve surely noticed an abundance of burrito-focused quick-service restaurants.
With clear and well-designed menu boards, these restaurants can serve up a custom burrito in no time.
Why are these burrito joints such a success? They're quick and easy to make and the variety is endless. Start with one of a half dozen meats and proteins. Add the beans, cheeses, veggies, sauces. Top it off with a dollop of guac. Done.
Now lets put our marketing hats back on and ask another question:
Who doesn’t love a good marketing or sales report?
Reports are the backbone of inbound. They help you measure your efforts and optimize your strategy.
And talk about variety — there are funnel reports, pipeline reports, analytics reports, and more. Need to find out where your sales efforts are getting hung up? A funnel report is your best bet. Which source is giving you the most customers? A nifty bar graph answers that question in no time.
Just like a burrito fills your stomach, a good report can fill your brain with great data.
And like a trendy burrito joint offering a wide variety of burrito choices, HubSpot provides many reporting options and provides excellent tools for measuring the current status of properties. HubSpot contains a variety of common default reports and is great for analyzing of your funnel.
It may be cheesy (see what I did there?), but you can think of the HubSpot reporting add-on as your daily burrito of data. You can even construct your report using the same methodology you use to build your lunchtime burrito.
If you’ve been to a burrito joint lately, you’ve no doubt noticed how easy it is to order from the prominently placed menu boards. The beauty in the menu board is its design. It lets you build your burrito step-by-step, presenting only the options available at that step.
- First choose your vessel (bowl, burrito, taco, etc.).
- Then your protein (chicken, carnitas, steak, tofu, etc.). Add your fillings (cheese or guac), then pick salsas and sides.
Easy. Here's another way to think about building your dish.
- First you decide how it’ll be presented. As a bowl, burrito, taco, or salad? To go, or for here?
- Then you decide what actually goes into the dish: meats, cheeses, sauces, and more.
How can you apply this same burrito-building approach when creating a custom report in HubSpot?
First, make your way into the report builder by clicking “Add report,” then “Create custom report” from the top of any of your dashboards. This is the equivalent of walking into the burrito joint. As a quick caveat, you’ll need the reporting add-on to create custom reports.
Once you’ve made your way into the report builder, it’s just like building a burrito, but instead of a menu board guiding you through each step, you can use the helpful drop-downs under Filters and Measures to build your burrito report. Start building your report by using the Filter tool to choose which data points (or “objects”) the tool will look at (think of this as the “fillings” of your burrito report) then use the options under Measures to pick the actual data to be analyzed and presented.
(Note: engagements, contacts/deal funnels, blogging, and page summary reports are limited in scope and not part of this tutorial.)
In other words, first you choose things you’ll be including in the report — this month’s MQLs? Last quarter’s closed deals? Target accounts on the west coast? Then you configure how you’d like them to be measured your options here are total, average, minimum, and maximum.
Here's how that breaks down.
Step 1: Choose Your Fillings by Selecting Your Filters
The filters sections lets the tool narrow down the records you wish to report on by picking an object, a date property, and a range.
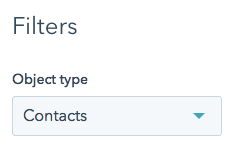
The object filter simply tells HubSpot which records to look at (i.e. contacts, deals, companies). At this time, you can only report on one object at a time, so cross-object reporting is not possible. For example you can’t build a deals report based on a contact property (e.g. forecast amount totals, a deal object, by state, a contact object).
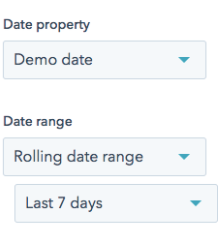
Next, pick a date filter. Don’t let this confuse you. Remember, we’re not yet choosing our presentation, just our fillings. These date filters won’t impact how your report ultimately looks; they’ll just determine which records it includes.
When using the date filters, the report will only choose records that have a date property populated within the chosen date range. All other records will not be included in the report. This allows you to get granular about which records to analyze, and it provides the possibility to compare reports on a monthly, quarterly, or yearly basis.
Below the date filter is another filtering tool that allows you to analyze records included in a saved filter (more about saving filters here).
Here are a few ways you might combine these filters:
- Contacts who became an MQL last month.
- Deals with a close date of last quarter that were owned by Josie Smith.
- Companies with create date this week and with more than 200 employees.
Step 2: Choose Your Presentation Using Measures
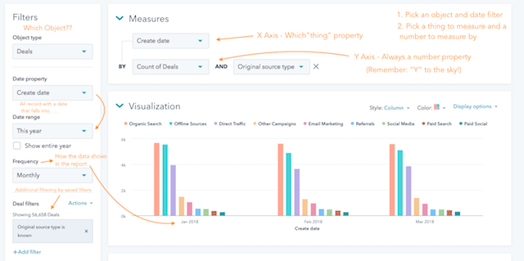
Once you’ve set up you filters, you'll need to determine what your report looks like. The key components include 1) a “thing” to measure, and 2) a number by which to measure that “thing."
Let’s walk through a quick example. Suppose we wanted to chart the contacts created this month by their lifecycle stage.
Under Filters, start by choosing Contacts under object type, selecting Created Date as the date property, and This Month as the date range. By doing this, you’ve told the reporting tool to look only at contact records where the create date is in the range of this month. Records that don’t meet this criteria will not be included.
You can get more granular record inclusion by using the filtering and saved filters options below the date range dropdown. This section also gives a quick summary of the total amount of records included in this report.
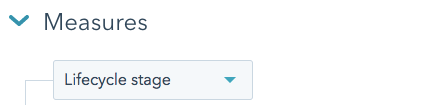
Now that you’ve picked your fillings, it’s time to choose a presentation under the Measures section.
For our example, I’ll choose “Lifecycle Stage” as the thing I’d like to measure. Clicking this first dropdown will only show you properties that are “things” (i.e. Deal Stage, Pipeline, HubSpot Owner, Lifecycle Stage, Persona, State/Region). These property options generally occupy the horizontal ( X ) axis of your report.
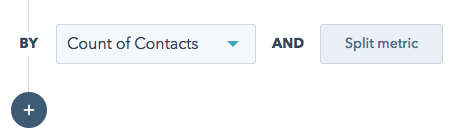
Next, we pick a “number” to measure by (ignore split metric for now). In our example, we simply want to see the total count of contacts, so we’d choose “count of contacts” from the dropdown. Note that this dropdown will only show number properties and occupies the vertical ( Y ) axis of your report.
(A good way to remember the difference between axis is “Y to the Sky.")
Some options you might find here include Count of Contacts, Days to close, Amount, Forecast Amount, HubSpot Score, Number of times contacted.
Once you’ve completed these steps, data will immediately populate in the report.
Want to get a layer deeper? Add a Split Metric.
Let’s say you wanted to take one more step into the data: Instead of just seeing your contacts by lifecycle stage, you wanted to see which sources were bringing in each of those lifecycle stages. Adding a split metric allows you to add one layer of delineation to your results. In our case, we’d add a split metric for “original source type.” If you wanted to slice the data another way, you could choose, country, industry, or any other custom property instead.
Two quick notes and examples
Two quick notes.
1) Choosing your fillings and choosing your presentation are two independent steps. At a burrito joint, deciding between a to-go burrito and a for-here taco is one decision; determining what goes into the burrito or taco is another one altogether.
Similarly, in your reports, changing a filter on the left-hand side bar will not change the way your chart looks (bar chart, axes, etc.), but instead will alter the records the reporting tool is evaluating.
2) You can't mix and match meats. At a burrito joint, you pick one meat as the foundation of your filling. In HubSpot, you pick one object. There's not currently a way to mix and match (e.g. filter for deals that have contacts with XYZ properties).
Two quick examples.
Need some examples? Here are two reports that help you measure the success of your channel efforts.
First conversion by source: This report shows the channels bringing the most leads to your best top-of-funnel offers. If you find a certain offer is doing well with a particular channel, double down on that channel in your promotion. Use the following for your x and y axis.
Measures (thing) : First Conversion
By (number): Count of Contacts
Split Metric: Original Source
Contacts by job title and original source: Use this report to see if you're targeting a specific type of individual or industry and how those decision-makers are finding your website. The criteria will be Job Title (or industry) is known.
Measures (thing): Job Title
By (number): Count of Contacts
Split Metric: Original Source
A wise person once said, “relate anything to food and the world makes sense.” By using the burrito methodology to build your reports, you can make sense of your data and make confident data decisions.