Lead scoring isn't easy. There is a lot of analysis and time leading up to creating that perfect lead scoring formula. You need to figure out all of the properties that should be included in your lead score such as job title, location, page views, email interactions, etc. Then, you need to figure out how much to weigh them by.
For example, you'll need to figure out if you should give someone 1 point or 5 points based on their location. Therefore, you need to understand how important these characteristics are in turning a lead into a customer. This sounds difficult, or dare I say impossible doesn't it?
That's why at INBOUND 2015, we released Predictive Lead Scoring for our Enterprise customers. As a reminder, in order to access predictive lead scoring:
- You must have been storing both engaged and unengaged contacts in HubSpot.
- You must have been marking contacts as customers for at least three months.
- You must have at least 500 contacts in HubSpot that are marked as Customers.
- You must have at least twice as many contacts who are marked as non-customers.
If you fit into this criteria, we will run your lead score for you.
Also at INBOUND 2015, we released the Reporting Add-on, a centralized location for all your reporting that costs $200/month for any product tier. Not only can you create as many dashboards as you want based on your reporting needs, but you can create customized reports based on your contacts, companies, deals, and engagements.
What we didn't reveal was how beneficial these two apps are when you pair them together. Whether you are in sales or marketing, these apps work hand in hand to surface your best qualify leads, what they are interacting with, and who needs to follow up with them.
If you do not have HubSpot Enterprise or the Reporting Add-on, you can start a trial for free here.
How to Use Predictive Lead Scoring & The Reporting Add-on
When you use the Predictive Lead Scoring app, we will give you a breakdown of your leads based on how qualified they are. We also provide advice on each category if you hover over the percentage.

When you hover over the 10%, you will notice the following message.

If you click either of those blue links, we will bring you to the Lists app where you can see a list of all your leads or contacts that we predict are the most qualified. You can then use this List across the platform: emails, workflows, or reports. That's where the Reporting Add-on comes in.
Create Reports Using the Predictive Lead Score
After you have your list of contacts by high predictive lead scores, you can start building some reports.
When creating your reports, make sure to first select the list with the predictive lead score. This will ensure that when you build your reports, it is only using the segment of your database with the highest quality leads. We create two lists for you: one with customers and one without. When choosing which list you want to include think about if you want to include one that has customers or not.

Count of Contacts by HubSpot Owner
Use your predictive lead score list to find out how many high-quality leads are owned by each sales rep. You will then be able to monitor if the sales reps are following up with them and eventually closing them into customers.

Count of Contacts by Original Source Type
Use your list to see the number of contacts by different sources. This will help you figure out where you should be promoting your different forms of content.

Count of Contacts by First Conversion
After you have a better idea of where you should be promoting your content, you should also take a look at what content to promote. Run a report that shows what your qualified leads were viewing first and most recently to find out what you want to get in front of your contacts. This will be helpful when you figure out what content to create and how soon to promote it in the sales cycle.

Contact Lifecycle Funnel
Using your predictive lead scoring list, run a report that shows how these contacts are moving through the funnel. Is there a certain point in the funnel where you see drop off? If there is you know that you need to nurture these contacts differently since they are so highly qualified! Use this information to then build an Attribution Report that shows what content the most qualified leads viewed before converting into a marketing qualified lead or customer. If you are not showing this highly qualified group of people those pieces of content, you know you need to adjust your strategy.

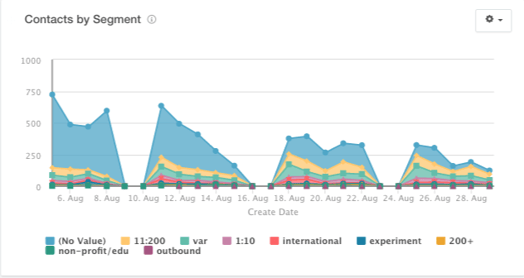
Contacts by Segment
Run a report that shows the breakdown of your qualified contacts by segment. This will help you understand how many qualified leads you are generating for each segment of your database. If you aren't generating high quality leads in one of your segments, it may make sense to re-evaluate your marketing strategy.

Average Predictive Lead Score by Source
In addition to using your predictive lead score in your list, you can also use it as a property when building your report. This report shows your average predictive lead score broken down by Original Source type. This will help you see what source your most qualified leads are coming from.

Additional Report Ideas
After you try out our examples reports, there are some other questions you should ask:
- What would happen if I run these reports using a list of the next 20% of my predictive lead scores? Simply change the criteria in your list, and you can compare the differences between the two reports. See what content that 20% of your database is looking at vs. your top 10%. You can grab the predictive lead score range in your predictive lead score app:
- What is my average predictive lead score by segment?
- Are the deals of contacts with high predictive lead scores closing? How much revenue are they generating?
- How many interactions have I had with people who have high predictive lead scores (calls? emails? meetings?)
- Do contacts with high predictive lead scores read my blog? Are they subscribed?
- How much email interaction do my contacts with predictive lead scores have?
What report do you want to build using predictive lead scoring and the reporting add-on? Let us know in the comments!