
That’s not a rhetorical question. If you want to manage a thriving community, you better figure out which community management metrics actually mean something about your work.
I spoke with a panel of four experts — from CCOs and Directors to program managers in the trenches — and asked what metrics they use themselves.
They also shared their thoughts on reporting upwards (gulp) and which KPIs are just a distraction.
Table of Contents
- How to Think about Community Management KPIs
- Top Community Management Metrics
- Best Community Metrics for Reporting Upwards
- The Benefits of Measuring Community Management Metrics
Community Management Templates
3 templates to help you build, grow, and connect with your community.
- Community Member Journey Map
- Community Member Profile
- Community Launch To-Do List
Download Free
All fields are required.
Form not available
How to Think about Community Management KPIs
Before you jump into the metrics below, pause and think about the twin dangers of data analysis.
1. It’s easy to get misled by the wrong numbers.
In any kind of digital management, you’re more likely to run into the problem of too much data rather than not enough.
“Page views, unique visits, and new members can often be distracting without telling the full picture,” warns Max Pete, community engagement program manager at Square. “For example, say you‘re getting a ton of new members per month, but there’s even more members leaving the community. So while it looks like you‘re in a big growth mode, actually you’re not retaining them.”
To avoid this, keep the goals of your community in mind as you read the list below.
“The metrics you define should be aligned with the business and member goals of your community,” says Jenny Sowyrda, manager of Community Strategy and Operations at HubSpot. “The more you can align your success metrics with what the business cares about, the better off you’ll be.”
2. It’s easy to waste time measuring things you can’t act on — or that you’re not ready for yet.
To dodge this trap, you should also be thinking about what stage of development your community is currently in.
“Depending on the life cycle of the community, I look at foundational, engagement, and impact metrics,” says Christina Garnett, founder and fractional CCO of Pocket CCO. “As a community starts, you will focus on foundational metrics and move out as you mature.”
To illustrate what she means (literally), Christina has shared this fantastic diagram below.
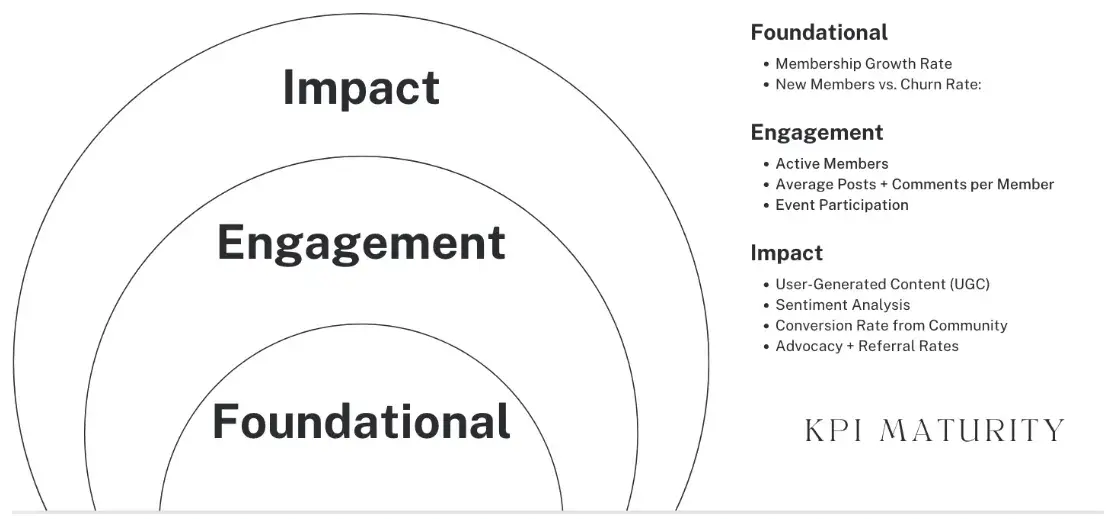
While she’s populated it with KPIs that any community could (and should) be monitoring, the exact metrics you fill it with will depend on your community’s needs and goals.
Top Community Management Metrics
Here are the metrics our panel of experts actually use in their own day-to-day jobs.
But note that while each of these KPIs is used by an expert, not every expert uses all of these KPIs.
I bring this up in order to drive home that, once again, it’s important for you to think about which of these metrics actually connect to a goal for your community.
While the panel can point the way, only you can decide which are needed.
Foundational Stage Community Metrics
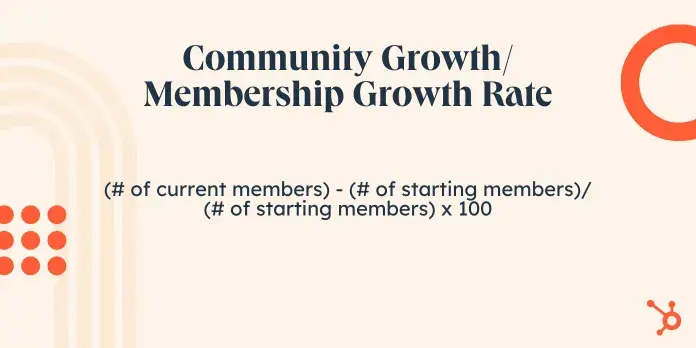
Community Growth/Membership Growth Rate
In general, a healthy community should be growing. Just how much depends on the type of community, and where you’re at in its lifecycle.
In the beginning, it’s normal to see your growth rate jump up high and then drop down low and back again. Eventually, you’ll want to see it steady out.
When I’ve helped grow newsletter communities, I found it very common to see the growth rate soften after the explosive first few months when promotional efforts were in full swing. But as long as that softer rate remained steady I knew we were still seeing healthy growth.
On the flip side, if this number drops suddenly, it’s a sign you need to investigate your sources of new members.
Formula: (# of current members) - (# of starting members)/ (# of starting members) x 100
Example: (1,500 current members) - (1,200 members at the beginning of the month)/ 1,200 x 100 = 25% growth rate
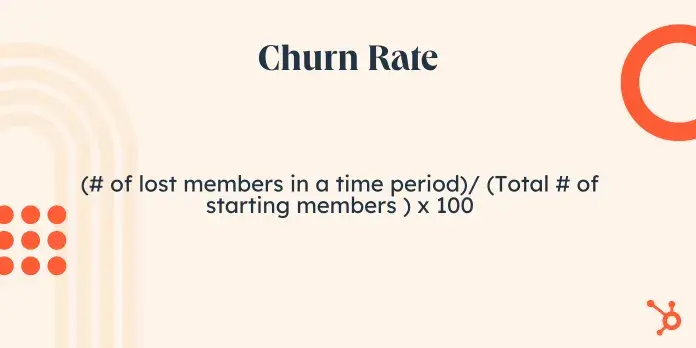
Churn Rate
This is the exact opposite of your growth rate. Churn rate is the number of members who leave your community in a given period of time.
Obviously, you’ll want this to be as low as possible, but for most communities, it’s unrealistic to aim for a churn rate of zero. People leave a community for all sorts of legitimate reasons outside of your control.
That said, if this number jumps or continuously grows over time, it’s a flashing warning sign that something has gone wrong.
Formula: (# of lost members in a time period)/ (Total # of members at the start of time period time period)x 100
Example: (20 members left this month)/ (400 members to start with)x 100= 5% churn rate
New Members vs Churn Rate
If you want to fill a bucket, you have to pour in more water than what leaks out. Your community is the same way.
Comparing the rate of new membership against your churn rate is a great way to take a glance ahead of your growth rate.
A warning: It is extremely easy to get confused when you’re calculating the difference between rates. To save yourself some stress, calculate them as whole numbers instead of percentages.
In other words, instead of (75% - 25%), just do 75-25.
Formula: (Membership growth rate) - (churn rate) / (churn rate) x 100
Example: (25 growth rate) - (5 churn rate)/ (5 churn rate) x 100 = 400% more new members than churn
Engagement Stage Community Metrics
Active Members
The number of active members you have is a good proxy for the health of your community because communities thrive on activity.
You’ll first have to define what makes a member “active.” Is it posting or commenting? Voting in polls? Attending in-person events? It all depends on the specifics of your community.
Any good community management tool should be able to pull the number of active members and how it changes over time.
Jenny Sowyrda notes that HubSpot tracks this number on a weekly and monthly cadence. You may also wish to calculate the quarter-over-quarter (QoQ) or year-over-year changes (YoY), too.
Some social media platforms famously track this number daily, but that’s likely overkill for most communities.
Just remember that seasonality plays a part in the number of active members, and in how active they are, so don’t get too worried if this number rises and falls over time.
For example, it’s not uncommon for the HubSpot Blog to see weekly readership fall around holidays. As long as it comes back the next week, we don’t sweat it.
Average Posts + Comments per Member
An engaged community member is more likely to stick around, but eventually, your group will get too big to check in on individual members.
Instead, an average of engagements per member can tell you a story about general participation.
Something to be mindful of is that a particularly hot topic or viral post can make this number jump like a frog on hot pavement. When that happens, you’ll need to be ready to explain why it’s falling the next time you report on it.
But pay attention to what caused the spike and you just might have a new content strategy on your hands!
Formula: (# of posts/comments)/(Total # of members)
Example: (120 posts and comments)/(50 members) = 2.4 posts/comments per member
Event Participation Rate
If your community doesn’t offer “events” in the traditional sense, you can probably still benefit from this metric.
Events can mean many things, from in-person conferences to live webinars or even on-demand virtual classes.
Heck, my son attends virtual concerts in Animal Crossing, and you better bet your bottom they’re keeping an eye on participation. (The event organizers, that is. Not the digital doggy DJ.)
Formula: (# of participants)/(Total # of members) x 100
Example: (200 participants)/(450 total members) x 100 = 44.4% participation
Impact Stage Community Metrics
Conversion Rate (CVR)
Conversion is usually talked about in terms of monetization — leads, sales, signups, etc. — but it can refer to a member taking any desired action.
Almost every community will have some sort of conversion event, and you’ll need to define what’s important to yours.
Is it signing up for a demo? Taking a class? Subscribing to a newsletter?
As your community grows, you’ll also want to track conversion rates for different types of actions. Each action will represent a different ROI for your team, brand, or company.
In other words, downloading a whitepaper will likely have a different value to you than signing up for a webinar. Knowing the CVR for each will help you lean into more valuable efforts.
Formula: (# of conversions)/(Total # of members) x 100
Example: (20 conversions)/(200 members) x 100 = 10% conversion rate
Advocacy + Referral Rates
92% of people trust the recommendations of family and friends over any form of advertising, according to a recent Nielsen survey.
Referrals and advocacy are the kind of marketing you can’t buy … but you can earn them by fostering a thriving community.
Not only should you be tracking your overall referral rates, you should also be tracking the referral rates for individual campaigns and events.
You may be surprised to find that campaigns that see low conversion are still super valuable because they drive a lot of word-of-mouth.
Formula: (# of referrals)/(Total # of members) x 100
Example: (10 referrals)/(50 members) x 100 = 20% referral rate
Average Response Time
Response time (and its cousins Response Rate and Resolution Rate) is a metric that will be
important for service or support-based communities.
Simply put, it’s the average time it takes for a representative to respond to a question, request, or ticket.
As your community becomes more advanced, it may also be useful to calculate the average response time by channel or by ticket type.
This can quickly identify choke points in your services, as well as strengths that can be shared with other channels.
Formula: (Total time to respond to questions/tickets)/(Total # of questions/tickets)
Example: (10 mins. + 20 mins. + 15 mins.)/ (3 questions) = 15 min. avg. response time
Response Rate
Just to make things confusing, people will use “response rate” to refer to two different metrics.
- The rate at which members respond to a poll or a survey.
- The rate at which your reps respond to questions/tickets from members.
Depending on your type of community, both may be worth keeping an eye on. Thankfully, the formula is the same for both. (Whew!)
During our chat, Jenny Sowyrda mentioned that HubSpot also tracks the percentage of responses that come from external sources versus those that come from HubSpotters.
This is a great idea for product-centered communities, where it’s crucial that information comes from trustworthy sources.
Formula: (# of responses)/ (# of queries) x 100
Example: (20 responses)/ (30 queries) x 100 = 66.6% response rate
Resolution Rate
Similar to response rate, resolution rate is based on the number of tickets closed or the number of answers accepted.
That last word is key if you want your community members to feel satisfied.
Don’t count a query or ticket in your resolution rate until the member considers it resolved.
Formula: (# of resolved queries)/ (total # of queries) x 100
Example: (20 resolved queries)/ (25 total queries) x 100 = 80% resolution rate
Sentiment Analysis
Sentiment analysis refers to the process of pulling out the emotional tone of content in order to better understand your community.
It can give an idea of how your members feel about your brand, the success of an event, or how happy they are with your support efforts within the community.
This isn’t really a metric you can calculate, but it is a KPI you should consider. Many good community management tools will include a sentiment analysis feature.
Community Management Templates
3 templates to help you build, grow, and connect with your community.
- Community Member Journey Map
- Community Member Profile
- Community Launch To-Do List
Download Free
All fields are required.
Form not available
Best Community Metrics for Reporting Upwards
It may seem harsh, but chances are, your boss’s boss isn’t going to look at your reports for more than 60 seconds.
That means you need to limit upward-facing reports to only those metrics that show how your efforts impact broader business goals.
“We align our metrics with what the business cares about,” says Jenny Sowyrda. “Which usually boils down to either making or saving the business money.”
That makes Conversion Rate and Event Participation easy shoe-ins. But what about the rest?
“It is super important to have those early conversations with key stakeholders on what is important data for them,” says Max Pete. “What are their goals and what are they looking for in terms of success metrics?”
In other words, just ask them!
In the meantime, here are some other boss-friendly KPIs they may be interested in:
Net Promoter Score (NPS)
Want to know how your community feels about your brand/product/service? Ask them!
Net promoter score is a metric almost any executive will recognize. It’s based on asking your members a question like “On a scale of 0-10, how likely are you to recommend the community to a friend or coworker?”
You then bucket your responses as Promoters (9-10), Passives (7-8), and Detractors (0-6). Finally, subtract the percentage of Detractors from the percentage of Promoters.
Share of Voice
While Share of Market measures your portion of industry sales, Share of Voice compares your portion of brand awareness.
In other words, when consumers think of your industry, how many of them think of your brand?
It’s usually measured in social mentions, paid ad clicks, or keyword traffic.
As you can imagine, a thriving community full of advocates is a great way to increase your Share of Voice.
Learn more about Share of Voice.
Cost Per Conversion (CPC)
Since communities are gold mines for user-generated content and organic referrals, they’re often more cost-effective than paid marketing campaigns.
The downside? It’s often harder to prove that.
To calculate the CPC of community management, you’ll first need to add up all of the costs associated with running the community. From there, you divide the total expense by the number of conversions attributed to the community.
Now you may be asking, “What if I’m still only tracking foundational stage metrics?”
That’s okay! Christina Garnett recommends being upfront about that during those early stakeholder conversations.
“Setting expectations so leadership knows that KPIs will shift as the community grows is priceless,” she explains.
The Benefits of Measuring Community Management Metrics
Simply put, tracking these metrics will allow you to make decisions that better serve your community and your business.
But data alone isn’t enough. KPIs should always be a starting point for your curiosity in figuring out what works for your community, what doesn’t, and why.
If you do that, you’re almost guaranteed to:
- Turn members into advocates by seeing what they love and doing it over and over again.
- Thrill your stakeholders by identifying what serves their goals and leaning into those efforts.
- Reduce costs by discovering and improving weak points.
- Uncover business insights that almost no other type of marketer gets access to.
And if that’s not enough, they’ll also help you prove the ROI of your community to management. But that’s a blog for another day.
Community Management
-1.png)


![Experts Share Top Tips for Community Management [+ Examples]](https://53.fs1.hubspotusercontent-na1.net/hubfs/53/ft-community.webp)