Web Design Statistics
Mobile Web Design Statistics
1. In May 2023, mobile devices generated 65.49% of global website traffic. (SimilarWeb, 2023)
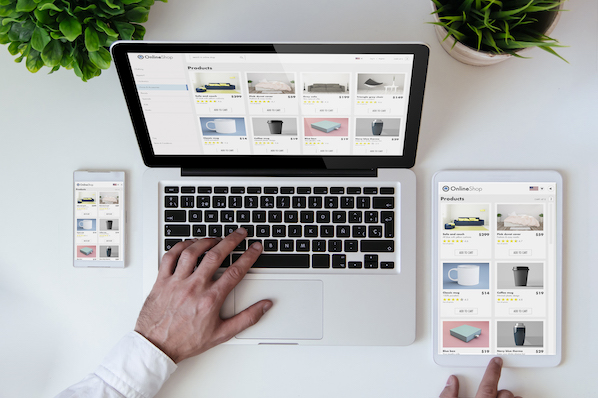
Mobile traffic has been hovering around the 50% mark since the beginning of 2017. That means optimizing your website for mobile devices, and desktops is more important than ever.
It’s also important to consider whether offering a mobile app would provide a better experience to your users.

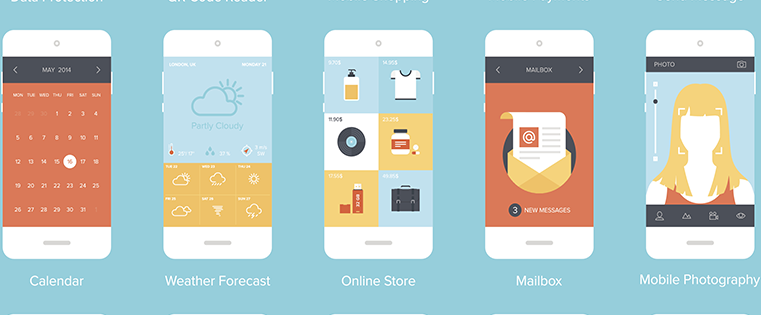
2. 32% of small businesses already have a mobile app, and 42% plan to build one in the future. On the other hand, 26% of small businesses are unlikely to ever release one. (Top Design Firms, 2021)
Some small businesses have already created a mobile app, while others plan to improve their customer service or streamline the purchasing process for their customers.
But over a quarter of some small businesses aren’t planning to — now or ever.
Some don’t have the budget or marketing capabilities to create and promote their app. Others don’t think it makes sense for their business or audience.
Whether your small business should invest in building a mobile app or not depends on a wide range of factors, including your industry, target audience, and budget.
3. The average e-commerce conversion rate on mobile is 2.49% (of completed purchases by visitors), while desktop conversions are 5.06%. (Dynamic Yield, May 2023)
Though desktop comes with higher conversion rates, invest heavily in mobile optimization as well. As mentioned above, mobile traffic share is twice as large (~65% for mobile vs. ~32% for desktop).
If you disregard website mobile optimization, you risk losing revenue and customer loyalty.

4. Mobile drew the largest number of new users at 65%, and mobile generated the highest percentage of returning visitors, at 74%. (Dynamic Yield, 2023)
This finding greatly supports the above. People spend an average of 3 hours and 15 minutes on their phones daily. And 1 in 5 smartphone users spends upwards of 4.5 hours.
They scroll social media, read news, hang out on messengers, watch YouTube, and discover and buy goods.
Think of yourself. How do you use your phone? I check it during small breaks, even when I work on my laptop. I discover new brands thanks to paid ads on Instagram or Facebook.
That said, it’s very important to make web design and UX for mobile users clean, easy to navigate, and memorable.

Responsive Web Design Statistics
5. 73.1% of web designers believe that a non-responsive design is the top reason why visitors leave a website. (GoodFirms, 2021)
Considering that billions of people use mobile devices to access the internet, your website must be optimized for smaller screen sizes and desktops.
In fact, not having a responsive design is rated as a top reason visitors might leave a website, according to a survey of 200+ web designers and freelancers. Other reasons are slow load times, bad navigation, and poor content structure.

6. 53.8% of web designers cite “not being responsive on all devices” as a top reason for a website to be redesigned. (GoodFirms, 2021)
If your website isn’t responsive, it’s time for a redesign, according to that same group of 200+ web designers and freelancers.
The other top reasons — low conversion rate, high bounce rate, and “needs better UX” — could be addressed by a responsive design as well.
Web Design Industry Statistics
7. In 2021, the total number of web developers and designers in the United States was around 191,100. By 2031, this number is projected to reach over 205,000. (U.S. Bureau of Labor Statistics, 2021)
In this study, web developers and designers were defined as those “responsible for the design and development of websites or interfaces including the overall layout, graphics, font type, etc.”
The market is expected to grow by over 21,800 jobs in the next decade.
8. Employment of web developers and digital designers is projected to grow 23% from 2021 to 2031, much faster than the average for all occupations. (U.S. Bureau of Labor Statistics, 2021)
According to the U.S. Bureau of Labor Statistics, the employment of web developers and designers will grow at a much faster rate than the average for all occupations.
The organization believes that demand will be driven by the continued popularity of mobile devices and e-commerce.

9. The median annual wage for web developers was $77,030, and digital designers earned $79,890 respectively in May 2021. (U.S. Bureau of Labor Statistics, 2021)
The median annual wage for web developers and designers was over $77,000 in 2021.
The U.S. Bureau of Labor Statistics defines median wage as “the wage at which half the workers in an occupation earned more than that amount and half earned less.”
In the case of web developers and designers, the lowest 10% earned less than $40,750, and the highest 10% earned more than $146,430.
10. On average, webmasters receive 353,370 unique visitors per month to the primary website they track analytics for. (HubSpot, 2023)
This statistic indicates the level of traffic that website owners or administrators typically experience.
It demonstrates the potential reach and audience size of websites, which can be important for various purposes such as marketing, advertising, and monetization.

11. The most important metrics webmasters track to understand their website performance are sales, leads, and conversion rates (31%), total monthly visitors (30%), and click-through rate (28%). (HubSpot, 2023)
These metrics provide insights into the effectiveness of a website in generating revenue, capturing leads, and engaging visitors.
Monitoring these metrics allows webmasters to benchmark, compare over a time period, and optimize their websites.

Modern Web Design Statistics
11. 94% of first impressions related to your site’s web design. (WebFX, 2021)
A WebFX study discovered that website design is paramount to a business’s overall brand.
That suggests businesses should prioritize website design (or redesign) to meet consumers’ expectations, strengthen their brand identity, and increase purchases alike.

12. When asked what visual elements they value on a company website, 40% of consumers said images, 39% said color and 21% said video. (Top Design Firms, 2021)
Images, colors, and videos are the top visual elements that consumers value on a company website.
Considering that nearly 40% said images and color and 21% said video, your business should prioritize adding images and picking a website color scheme first.
Then, focus on incorporating video and other visual elements mentioned — namely, typography, infographics, and animation.

13. A tall page can skyrocket your conversion rate by 30%. (CrazyEgg, 2015)
Although this study was conducted about seven years ago, it should inspire you to test ideas that could drive more conversions.
Crazy Egg conducted an A/B split test to determine which homepage version was more effective in persuading visitors to become customers.
The challenger homepage they tested was about 20 times longer than the control, outperforming the control by 30%.
This indicates that the longer page was more successful in capturing visitors’ attention and encouraging them to take action.
They had enough space to showcase product value, poke their target audience’s pain points, and convince people to sign up.
14. 42% of people will leave a website because of poor functionality. (Top Design Firms, 2021)
Web design isn’t just about making pretty websites — it’s about making websites that are easy to use and navigate. If yours isn’t, then it’s likely that many visitors will abandon your site. This is why web design services are so essential.
In a survey by Top Design Firms, 42% of respondents said they’d leave a website with poor functionality.
15. 38.5% of web designers believe that outdated design is a top reason why visitors leave a website. (GoodFirms, 2021)
In addition to non-responsive design and functionality issues, web designers cite outdated design as a reason visitors abandon a website. You might be wondering when a design becomes “outdated.”
According to Business 2 Community, the average lifespan for a website is 1.5 to 2.5 years. Past that range, a website must incorporate new design trends and technologies to feel “fresh” and competitive.
16. 39% of consumers appreciate color more than any other component of a website’s design. (Top Design Firms, 2021)
39% of website visitors care about color more than any other component of a website’s design. That means companies should prioritize picking a website color scheme.
Ideally, your color schemes will reinforce your brand, make your site easy to read and navigate, and also look good.
17. Only 8% of consumers notice whitespace when viewing a website for the first time. (Top Design Firms, 2021)
When viewing a website for the first time, only a fraction of visitors notice whitespace. That doesn’t mean it’s not important, however.
This critical design element can help draw visitors’ attention to certain elements, like CTAs, and make it easier for them to understand and digest your content.
18. 26% of consumers prefer primary color schemes, 21% prefer complementary, and 20% prefer analogous. (Top Design Firms, 2021)
Consumers are split about which type of color scheme they prefer: Some want primary. Some want complimentary. Others want analogous.
To understand the difference, you must be somewhat familiar with color theory.
- A primary color scheme is made up of one or more primary colors (red, yellow, and blue).
- A complementary color scheme uses two colors directly across from each other on the color wheel (like orange and blue) and relevant tints of those colors.
- An analogous color scheme is created by pairing one main color with the two colors directly next to it on the color wheel (like green, purple, and blue).
When selecting a color scheme, companies should consider their products, services, and audience.
19. Of consumers visiting a website for the first time, 22% look for eye-catching colors, while 21% will leave a site with “outlandish” colors. (Top Design Firms, 2021)
As 22% of consumers visiting a website for the first time look for eye-catching colors, but 21% will leave one with “outlandish” colors, it’s important to strike the right balance.
To help choose eye-catching — but not garish — colors for your website color scheme:
- Opt for a neutral background color.
- Choose primary and secondary colors.
- Don’t be afraid to look at businesses in your industry for inspiration.
20. When looking at a website for the first time, 38% of consumers look at a page’s layout or navigational links. (Top Design Firms, 2021)
38% of people visiting a website for the first time look at the layout or navigational links on a page. If the layout is confusing or the navigation menu is hard to find, then visitors may leave your website.
Ecommerce Web Design Statistics
21. 21% of cart abandonments are due to complicated or lengthy checkout experiences. (Dynamic Yield, 2023)
As of March 2023, 72.77% is the cart abandonment rate, according to Dynamic Yield. The numbers are paralyzing. Especially given that in 21% of the cases, people give up on their purchases because of cumbersome checkout pages.
So, use heatmaps and session recordings to locate and fix friction points.

22. 23% of small retail businesses don’t have a website. (Digital.com, 2021)
With e-commerce growing year-over-year, it might surprise you that 23% of small retail businesses don’t have a website. Some believe they don’t need one — but they are likely missing out on key opportunities to generate revenue.
According to Statista, revenue from e-commerce in the United States amounted to $431.6 billion in 2020. It’s estimated to increase to $563.4 billion by 2025.
23. Of small retail businesses without a website, 24% responded that they don’t know how to create/run a website. (Digital.com, 2021)
While some businesses doubt the necessity of having an online presence, others simply don’t have the resources to create one. Of small business owners without a website, 24% said the reason was that they don’t know how to create and run one.
The rise of user-friendly and affordable content management systems and website builders could help overcome this objection and get more small businesses online.

24. When hiring an agency or a freelancer, the average cost to build a website is $12,000 to $150,000. (WebFX, 2023)
Several factors can contribute to the cost — the complexity of the website, its functionality, the number of pages, design customization, content creation, e-commerce integration, and split-tests or conversion rate optimization.
Thus, a $150,000 website suggests a more intricate and comprehensive design with extensive customization, advanced functionality, or complex integration.

Need a simple site? Try Content Hub with a very intuitive website builder, hundreds of website themes and templates, and web hosting. HubSpot CMS is already integrated with HubSpot CRM and has a free blog maker.
25. As of May 2023, Amazon was the most popular ecommerce site in the United States and worldwide. (SimilarWeb, 2023)
As Amazon has had unprecedented success in driving traffic to its site, its website can inspire your website’s design.
It’s become the go-to platform for many online shoppers due to its broad assortment of goods, third-party selling, and other design and functionality choices.

26. E-commerce sales grew 7.7% in 2022 year over year and reached $1.03 trillion. (Digital Commerce 360, 2023)
The 7.7% growth indicates a healthy and positive trend in the after-COVID e-commerce industry. More and more consumers are leaning toward online shopping after its booming period during the COVID-19 pandemic.
So, make sure your website is ready for an unparalleled user experience. Otherwise, customers can easily switch to competitors.

27. 60% of consumers rate usability as an important design characteristic for an online shop. (Statista, 2020)
In a survey of almost 1,000 US consumers, 60% stated that website usability is important for them in an online shop. You can improve the usability of your website by using visual hierarchy, colors, and consistency to make it as easy to use as possible.
If you’re unsure where to start, HubSpot’s Website Grader and other usability testing tools can help identify improvement opportunities.
28. 83.5% of designers, developers, and agencies from the web development industry find it hard to gather relevant information and content from clients. (Atarim, 2022)
According to Atarim and their latest case study, gathering content from the client is ultimately the biggest bottleneck in running and completing projects. What’s even more fascinating is that 87.5% still use email to gather that content.
Based on their case study, Atarim created a free ebook that helps digital agencies and individuals resolve this bottleneck.
After going through it, 75.3% of them reported a significant improvement in their ability to gather all necessary content from the client in a much shorter period. You can check out the ebook here.
Preparing for the Future of Web Design
The web design industry is growing, and so are users’ expectations of what websites and online shops look like and are capable of. Will you be prepared to meet them?

Mobile Optimization


![10 Best Mobile Friendliness Tests [+ What Does it Mean to be Mobile Friendly?]](https://53.fs1.hubspotusercontent-na1.net/hubfs/53/mobile-friendliness-test.jpg)