.png?width=112&height=112&name=Image%20Hackathon%20%E2%80%93%20Vertical%20(85).png)
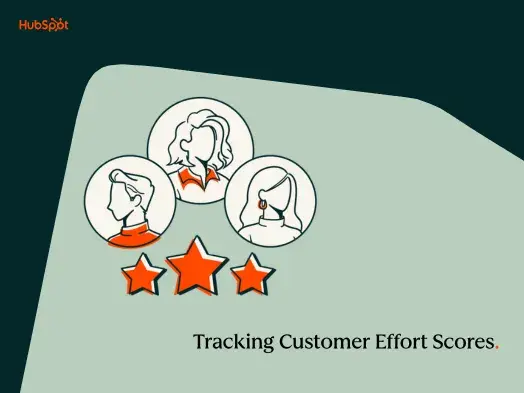
Companies can track CES across pre-sales, onboarding, and support by implementing unified CES surveys through Service Hub. HubSpot connects all touchpoints, which provides a complete effort view and lets teams solve problems wherever they appear in the customer journey. Customer experience teams can then to see patterns and measure the impact of improvements.
Keep reading to see how.
Table of Contents
- What is Customer Effort Score (CES)?
- Why CES Matters
- Why Teams Should Measure CES by Journey Stage
- When to Measure CES
- Comparison Table: CES Tracking Methods by Journey Stage
- How to Measure CES by Stage in Service Hub
- Checklist: Measuring CES
- Tips for Measuring CES at Different Stages
- Frequently Asked Questions
.png)
Free Customer Service Metrics Calculator
Calculate your business's key metrics and KPIs for customer support, service, and success with this free template.
- Customer Acquisition Cost
- Customer Lifetime Value
- Customer Satisfaction Score
- And More!
Download Free
All fields are required.
Form not available
What is Customer Effort Score (CES)?
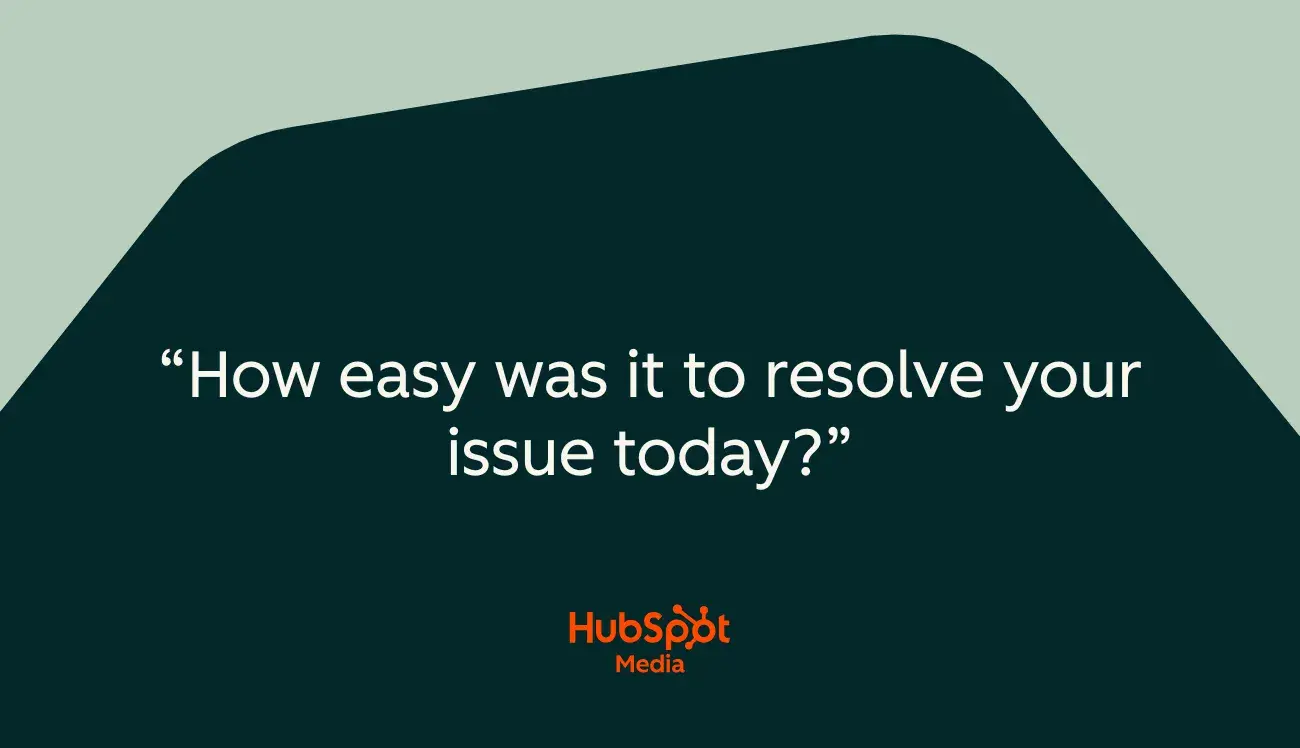
Customer Effort Score measures how easy it is for customers to interact with a business. Typically collected via a short survey, CES questions ask customers to rate the effort required, such as:
- “How easy was it to resolve your issue today?”
Ratings are usually on a numeric scale (e.g., 1–7, where 1 = Very Difficult and 7 = Very Easy). Lower effort scores indicate areas of potential friction.
Effort vs. Satisfaction
While Customer Satisfaction (CSAT) reflects how customers feel about an interaction, Customer Effort Score focuses on how much work they had to put in. Customers may feel satisfied overall, but they still believe the process was harder than it needed to be.
By measuring effort, companies uncover hidden friction points that satisfaction metrics alone might miss.
Why CES Matters
Customer Effort Score is more than a metric. It offers insight that goes far deeper than basic satisfaction scores. The following sections illustrate the practical reasons CES matters most for teams committed to reducing friction and driving retention.

CES pinpoints hidden friction.
Customers don’t just share their points of friction. Service teams need to find these sticking points. Data from the Qualtrics 2026 Consumer Experience Trends report shows that only three in 10 customers will directly share what went wrong after a poor experience, and 30% stay completely silent.
With over a decade in customer support management for B2B SaaS and B2C, I have learned that friction is rarely obvious until you measure effort directly.
At Skybound Entertainment and several startups I’ve worked at, CSAT reviews missed many small pain points, such as delayed account setups or unclear demo scheduling. When I introduced CES surveys, I immediately saw patterns of negative feedback in places CSAT could not reach.
High effort predicts churn and lost revenue.
High effort predicts churn where proactive improvement is needed. Often, users stop responding after facing multiple hurdles, even if support agents work hard.
I’ve found that customers who rated onboarding as “difficult” were much more likely to request refunds or ignore renewal reminders. Automating CES surveys following journey milestones has helped me spot patterns, such as repeat escalations or complicated transaction queries.
Accelerating ticket resolution and reducing effort directly lowers churn rates. Service leaders who focused on ticket reduction in 2023 saw measurable drop in churn and rise in CSAT, proving that reducing effort pays off fast.
One practical tactic: Set up automated alerts for accounts showing multiple low CES scores. This allowed my team to flag at-risk accounts before cancellation requests arrived. Account managers then reached out with personal follow-ups, leading to a reduction in churn rates of 10-15% over roughly six months.
Unified CES workflows accelerate improvement cycles.
Unifying CES data in real time drives exponential improvement. With HubSpot, service teams can consolidate all CES scores and feedback into one dashboard, breaking down journey silos and accelerating targeted fixes.
The payoff is real. 53% of CRM leaders using HubSpot have reduced churn, and 75% have increased retention by centralizing feedback and speeding up resolution.
When CES feedback is shared cross-functionally, product teams update roadmaps, sales refine demo messaging, and support builds smarter self-service tools. Teams stop chasing tasks and start driving results.
Why Teams Should Measure CES by Journey Stage
Customer effort varies by journey stage, which needs unified tracking. Breaking CES down by each stage of the customer journey is the key to moving past generic feedback and into precise, actionable insights. Remember: Measuring customer effort isn’t just about finding out if something is hard. It’s about understanding where, why, and for whom struggles emerge.
Here are some of the impactful benefits I’ve seen from this targeted approach.

Unlocking granular insights drives innovation.
Innovative, stage-specific solutions are born through granularity. Without this level of detail, teams may deploy resources too broadly and miss micro-frictions that create the biggest pain.
In fact, I’ve found that surface-level scores only tell part of the story. By breaking CES out across the journey stage, I’ve been able to identify not just where customers get stuck, but why the same type of problem feels easier for onboarding versus ongoing users.
Stage-level tracking fuels proactive coaching and support.
By mapping effort stage by stage, support teams are ready to solve problems specific to where customers actually get frustrated. This direct approach keeps teams responsive and customers satisfied at every campaign milestone.
In my role at Skybound, I use CES data from each Kickstarter phase to adjust my team’s training and strategy. If effort is high in pre-sales, I revisit how we answer backer questions about project details or payments.
During campaign fulfillment, common support requests (i.e. tracking updates or survey issues) tell me where to update scripts and which workflows need more attention.
Data-driven prioritization that aligns to the bottom line.
In every leadership role, I’ve been responsible for demonstrating ROI from CX initiatives. Measuring CES by stage has turned abstract “improvement” goals into targeted priorities that the whole organization can support.
For example, at Skybound, I tracked CES throughout a Kickstarter campaign. Drops in backer effort during fulfillment correlated with higher campaign loyalty and fewer post-delivery complaints. This gave me a clear case for investing resources into more proactive communications and better logistics support.
Using Customer Effort Score this way, I can speak the language of the business, justify resources, and keep every team focused on changes that actually move the needle.
Free Customer Service Metrics Calculator
Calculate your business's key metrics and KPIs for customer support, service, and success with this free template.
- Customer Acquisition Cost
- Customer Lifetime Value
- Customer Satisfaction Score
- And More!
Download Free
All fields are required.
Form not available
When to Measure CES
Timing CES surveys is critical. The most actionable insights always come from surveying at stages where real-life friction is likely to impact conversions, activation, or retention.
Here is how I break down the timing and approach for each key step.
Measuring CES Before You Make a Sale
Pre-sale effort usually predicts conversion rates better than almost any other metric. When surveys are triggered just after demos or trial sign-ups, teams can catch pain points early. The sales or product teams can then make necessary adjustments to close.
The surveys I oversee always include a question about the ease of getting started and an open field for blockers, such as unclear pricing.
At Trendy Butler, for instance, follow-up surveys triggered right after a customer explored their first box or onboarding quiz helped us spot where onboarding friction was killing sign-ups. Acting on those insights raised first-to-second-box conversions by providing custom welcome guidance and better chat support.
Learn more about mapping pre-sales friction in HubSpot’s customer journey blog.
Measuring CES During Onboarding
New user onboarding is the most vulnerable stage because early frustration leads directly to drop-offs. In fact, 82% of onboarding users expect their problems to be fixed without escalation. Measuring and acting on friction in those first moments ensures customers stay, rather than churn.
In my SaaS roles, we sent CES surveys immediately after training, tutorial completion, or a first-order activation step. Our focus: Ensuring clear setup, smooth account access, and easy-to-navigate resources. I always included a prompt for users to share any blockers or struggles in their own words.
One specific example: while I was working at Yahoo, onboarding surveys exposed repeated confusion with our API documentation. That led to the launch of step-by-step integration guides and recorded walkthroughs, which quickly cut negative onboarding feedback.
Measuring CES During Support Efforts
With consistent support efforts, teams can see process gaps and make adjustments. Looking at support CES data helps support organizations see what really drove repeat contact, escalations, and low NPS from existing customers.
The result: targeted canned response updates and improvements to internal escalation playbooks. The data backs this up. Of leaders using a CRM, 75% see higher retention from better workflow tracking. Surveys at this step show exactly where to focus investments for the most ROI.
At Skybound, every finished ticket generated a survey asking about effort, speed, and whether the user needed to escalate to a manager. For Trendy Butler, surveys sent after live chat or return processing gave visibility into pain points like repetitive requests, unclear return labels, or tracking delays.
Comparison Table: CES Tracking Methods by Journey Stage
|
Journey Stage |
Trigger Point |
Survey Format |
Key Metric |
Pros |
Cons |
|
Pre-Sales |
Post-demo/trial |
Email or in-app |
CES (1-7) + comments |
Early signal of buying friction |
Risk of low response if too frequent |
|
Onboarding |
Post-training/setup |
In-app or email |
CES + context questions |
Stage-specific insights |
Trigger setup complexity |
|
Support |
Ticket close/chat end |
Embedded survey |
CES + ticket metadata |
Real-time feedback |
Lower responses on simple issues |
How to Measure CES by Stage in Service Hub
Tracking CES in HubSpot Service Hub follows a repeatable process. By setting up standardized surveys and automating triggers, service reps can collect consistent feedback across pre-sales, onboarding, and support. Here’s how.
Step 1: Create CES survey templates for each stage.

Start by creating dedicated CES surveys inside Service Hub. Each survey should be tied to a stage of the customer journey:
- Pre-sales: “How easy was it to get the information you needed today?
- Onboarding: “How easy was it to get started with our product/service?”
- Support: “How easy was it to resolve your issue today?”
By building surveys for each touchpoint, service reps ensure results are contextual and comparable. Adding an optional open-text field also helps capture the details behind the score.
Step 2: Customize lifecycle stages to reflect your customer journey.
Standard lifecycle stages may not align perfectly with your business model. Use HubSpot’s lifecycle stage customization to map your customer journey more accurately. For example, a business may use the following journey.
- Leads are nurtured and become customers.
- Customers are onboarded with the software.
- Once onboarded, they’re tagged as active customers.
Having customized stages ensures that CES surveys are triggered at the right moments.
Step 3: Automate triggers based on CRM events.
Once surveys are ready, connect them to automation workflows so they fire at the right time without manual follow-up. For example, teams may have surveys associated with the following events and stages.
- Pre-sales: After a demo is logged in the CRM, a CES survey appears.
- Onboarding: A survey is sent when customers complete onboarding milestones (e.g., first login, training completed).
- Support: A CES survey appears immediately after a ticket is closed.
Automating triggers ensures customers are surveyed while the experience is fresh in their minds — improving accuracy and response rates.
Step 4: Collect and analyze results in a unified dashboard.
HubSpot’s reporting dashboards consolidate survey data into a single view. You can:
- Compare CES by stage (pre-sales vs. onboarding vs. support).
- Filter scores by customer segment, product line, or region.
- Monitor CES trends over time to see if initiatives are improving customer experience.
By bringing CES data into one dashboard, teams avoid working in silos and can see the entire customer journey at a glance.
Step 5: Set up alerts for high-effort responses.
Not all CES scores should be treated equally. Configure workflows so that:
- Low CES scores (high effort) automatically trigger alerts for account managers or support reps.
- Customers with repeated high-effort scores are flagged for review.
- Escalation paths prompt follow-up actions, such as personal outreach or case review.
This ensures that service teams don’t just collect CES data. Instead, they gather insights they can act on in real time to prevent churn.
With this five-step process, CES measurement becomes automated, consistent, and actionable. Instead of scattered surveys or one-off feedback, teams can see exactly how effort changes across the customer journey and take immediate steps to improve it.
Checklist: Measuring CES
- Define CES questions for pre-sales, onboarding, and support
- Build survey templates in Service Hub
- Set workflow triggers for each stage
- Configure dashboards with journey-stage filters
- Set alerts for high-effort responses
- Collect qualitative feedback for context
Review and act on trends regularly - Re-measure after improvements
Tips for Measuring CES at Different Stages
Maximizing the value of Customer Effort Score (CES) surveys requires strategic timing. Automation proves critical for scaling feedback and sending these surveys at the right time.
Here’s how I advise teams building or optimizing their CES program for real impact.
Make surveys relevant and timely.
Timing is everything. I’ve found that surveys sent directly after a demo, onboarding milestone, or support ticket yield the most candid and actionable insights. This quick turnaround uncovers friction right as it happens, not weeks later when memory fades.
Based on my work in SaaS and e-commerce, fast surveys boost response rates and allow my team to immediately address gaps before they create churn. For example, immediate feedback after onboarding lets us fix confusing steps while users are still highly engaged.
Dig into open comments for real causes.
Industry data shows 82% of customers expect their problems solved right away, and over two-thirds are more likely to trust and recommend brands that respond quickly to their input. Sharing comments directly with product and support teams turns qualitative feedback into immediate improvements.
I make it a habit to read open comments every week, not just check the numbers. These honest and sometimes blunt narratives from customers have revealed invisible roadblocks.
Use automation for the heavy lifting.
Automation is critical for scaling feedback without burning out support teams. By tying CES triggers to key lifecycle events, service teams ensure no group or touchpoint is missed.
Automated dashboards help me spot negative trends and high-effort alerts instantly, letting us prioritize which issues get resources fastest. According to recent studies, 92% of CX leaders see faster response and better personalization when they automate their feedback systems.
Encourage cross-team reviews and data-driven decisions.
Customer Effort Score is only as valuable as the actions it inspires. I’ve led cross-team review sessions using actual CES results as the jumping-off point for roadmap, resource, and policy changes. The strongest retention gains and loyalty jumps I’ve seen came when these reviews focused on the full journey, not just recent ticket trends.
For instance, Zendesk’s recent trends report found that companies that make loyalty and first-contact resolution a team sport, not just a support KPI, outperform on every CX metric. Finally, I advocate using these learnings to set specific owner and follow-up actions, never letting CES results get stuck at the PowerPoint review stage.
Frequently Asked Questions
Why not use traditional NPS measurements?
NPS measures loyalty intent, not friction. A customer may recommend a brand but still encounter frustrating experiences during their support journey. Traditional NPS surveys capture overall satisfaction at a single point in time, but they miss the cumulative impact of effort across multiple touchpoints.
HubSpot Service Hub's effort tracking capabilities reveal these hidden pain points by measuring the actual work customers must perform to resolve issues. This granular data helps support teams identify process improvements that NPS surveys would never surface.
How does CES effort compound across touchpoints?
Friction in early stages makes customers less tolerant of issues later. When customers experience high effort during onboarding, they develop lower patience thresholds for future interactions. This compounding effect creates a customer effort debt that accumulates over time.
By measuring effort at each stage, support teams can identify which early experiences create the most significant downstream problems. Service Hub's workflow automation can then prioritize intervention for accounts showing high early-stage effort scores.
When is high effort acceptable?
Acceptable high-effort scenarios typically include: initial system implementations, major version upgrades, custom integrations, and compliance-related processes. In these situations, customers expect complexity but still appreciate streamlined guidance.
Service Hub's knowledge base integration and automated task assignment ensure customers receive appropriate support resources matched to their effort requirements.
Should you measure effort for lost prospects?
Yes, understanding why prospects dropped out can inform improvements to sales processes and increase future conversion rates. Lost prospect effort analysis reveals friction points in the sales funnel that traditional win/loss analysis misses.
Service Hub's conversation intelligence can analyze prospect communications to identify effort indicators. That includes repeated requests for information, confusion about processes, or frustration with evaluation complexity. These patterns help sales teams understand which aspects of their process create unnecessary work for potential customers.
Get deeper insights with CES.
Measuring CES across the entire customer journey provides a clear, actionable view of where customers struggle. Reducing effort leads to higher satisfaction, stronger loyalty, and improved revenue outcomes.
With HubSpot’s Service Hub, organizations can automate CES surveys, unify feedback, and act on insights faster. That creates an effortless experience at every stage.
Start building unified CES workflows today with HubSpot and see how effortless experiences can transform your customer relationships.
Free Customer Service Metrics Calculator
Calculate your business's key metrics and KPIs for customer support, service, and success with this free template.
- Customer Acquisition Cost
- Customer Lifetime Value
- Customer Satisfaction Score
- And More!
Download Free
All fields are required.
Form not available
Customer Service