.png?width=112&height=112&name=Image%20Hackathon%20%E2%80%93%20Vertical%20(85).png)
In this post, I'll explain which customer satisfaction metrics you must focus on to keep your business healthy and customers happy. Then, I'll show you a few examples of companies that are doing this well.
Table of Contents
- What are customer satisfaction metrics?
- What type of metrics measure customer satisfaction?
- How to Give Your Customer Satisfaction Metrics a Boost
- Customer Satisfaction Metrics Examples
What are customer satisfaction metrics?
Customer satisfaction metrics reveal how pleased customers are with your business. If the goal of customer service is to satisfy, metrics help you measure your progress toward that goal.
According to Mario DeAlmeida, Managing Director at HotHeadTech.com, "Today, customer satisfaction metrics are key to understanding customer needs and finding ways to improve the customer experience. They not only assess customer loyalty but identify when customers may be at risk of defecting or are unhappy with your services." DeAlmedia adds, "By analyzing tracked metrics, businesses can gain key insights into customer behavior and make informed decisions about how to improve customer satisfaction."
Let's take a deeper dive into each of these customer satisfaction metrics to understand what they are, what they measure, and how to make data-driven decisions with your newfound insights.
What types of metrics measure customer satisfaction?
- Net Promoter Score
- Customer Satisfaction Score
- Customer Effort Score
- Abandonment Rate
- Customer Health Score
- First Response Time
- First Contact Resolution
- Ticket Resolution Time
- Average Ticket Time
- Customer Retention Rate
- Customer Churn Rate
- Customer Lifetime Value
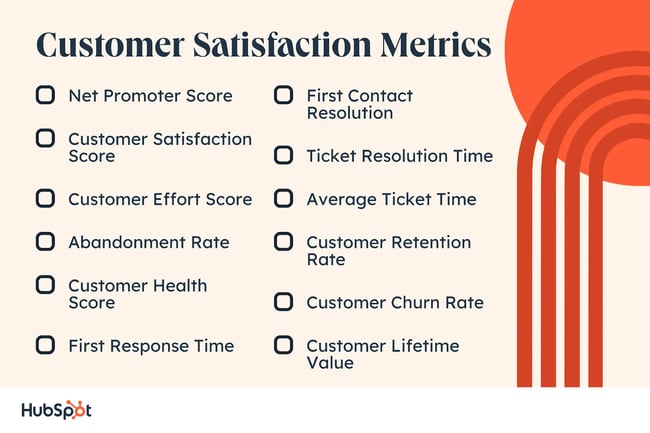
If you're wondering, "What types of metrics measure customer satisfaction?" You're in the right place. I'll walk you through 12 key customer satisfaction metrics your company cannot afford to ignore.
1. Net Promoter Score
Net Promoter Score, or NPS, is an extremely popular metric you use to gauge customer satisfaction. NPS is a simple, one-question survey that provides your business with both quantitative and qualitative data about the customer's experience with your brand.
Having both types of data wrapped into one metric makes it easier for businesses to categorize and identify specific trends in customer reviews.
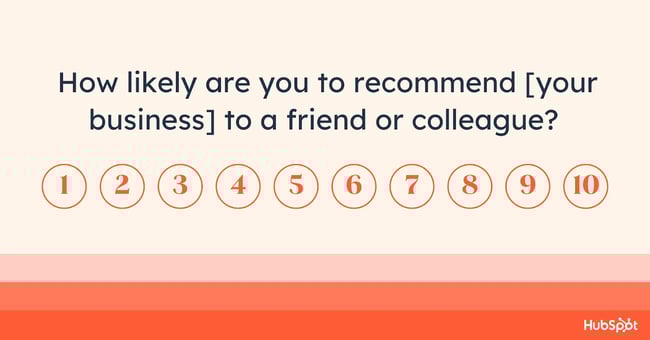
This survey determines how likely customers are to refer your brand to another person. It asks customers to rate their experience on a numerical basis as well as provide a brief explanation for their rating. It's quick enough that you'll get a good number of submissions — and robust enough that you'll gain actionable insights.
You can then organize and review the ratings that are the highest and lowest to see what people like and don't like about your company.
Data from Retently published in 2023 shows that the Insurance and Financial Services industries receive the highest average NPS. The Communication and Media and Internet Software and Services sectors, however, experience the lowest average NPS.
2. Customer Satisfaction Score
You can survey your customers to find your customer satisfaction score (CSAT) to determine customer sentiment.
High levels of customer satisfaction are closely tied to increased revenue through repeat customers or just an overall willingness to pay more for better service. In fact, a report from Exempli in 2022 found that 61% of customers are willing to pay 5% more for a positive customer experience.
Similar to NPS, the customer satisfaction score asks customers to rate their experience on a scale. However, instead of inquiring about referrals, CSAT focuses on a specific product, service, or customer interaction. Because of this, your CSAT is one of the most fundamental surveys used to measure customer satisfaction.
Unlike NPS, CSAT enables businesses to ask multiple questions, each regarding different aspects of the customer experience. You can then obtain customer feedback about specific features of your product or service.
3. Customer Effort Score
Measure how user-friendly your products and services are with a customer effort score (CES). A CES is gathered with surveys, typically a one-question prompt that displays immediately after a customer performs an action.
For example, ecommerce sites may ask customers how difficult it was to locate and purchase an item they just bought on the site. With this information, you can adjust your website or app to remove roadblocks impeding on the customer's journey.
Customer effort scores are valuable because they give your company immediate feedback regarding the usability of a product or service. It's closely related to customer retention, too — 60% of consumers have switched to a different brand or company due to a negative contact center experience.
Many customers who are experiencing difficulty using your product will be reluctant to provide feedback that specifically addresses their pain points. Instead, they'll give up and cancel their subscription without ever telling you why, or they'll say your product is too confusing.
Since customer effort scores are proactive, you can reach out to these customers and correct usability issues before people begin to churn. And that's a win for customer retention.
4. Abandonment Rate
Abandonment rate is the percentage of customers who terminate an interaction with your company before an action or request was completed.
Depending on your business and the services you offer, abandonment rates can measure a few different things.
Most companies that have a call center will measure the queue abandonment rate for customer service calls or chats. For instance, LiveChat reports that 24.8% of customers drop out of a customer service queue before connecting to an agent.
If your company has an ecommerce site, you can also measure the abandonment rate of shopping carts on your online store. Baymard Institute reports an astonishing 70% average abandonment rate for ecommerce shopping carts, mostly due to a long or difficult checkout process or surprise fees.
Abandonment rates inform you about the quality of a customer's interaction with your business, regardless of the product or service they're using. By comparing the abandonment rates of different components of your business, you can determine if you're providing a consistent, predictable omnichannel experience for your customers.
If your rates are high, you can pinpoint where exactly customers are dropping off and remove any roadblocks that may be preventing their success.
5. Customer Health Score
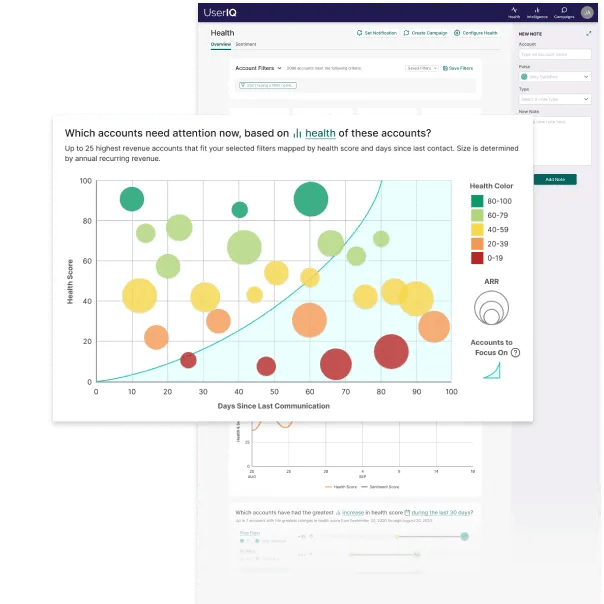
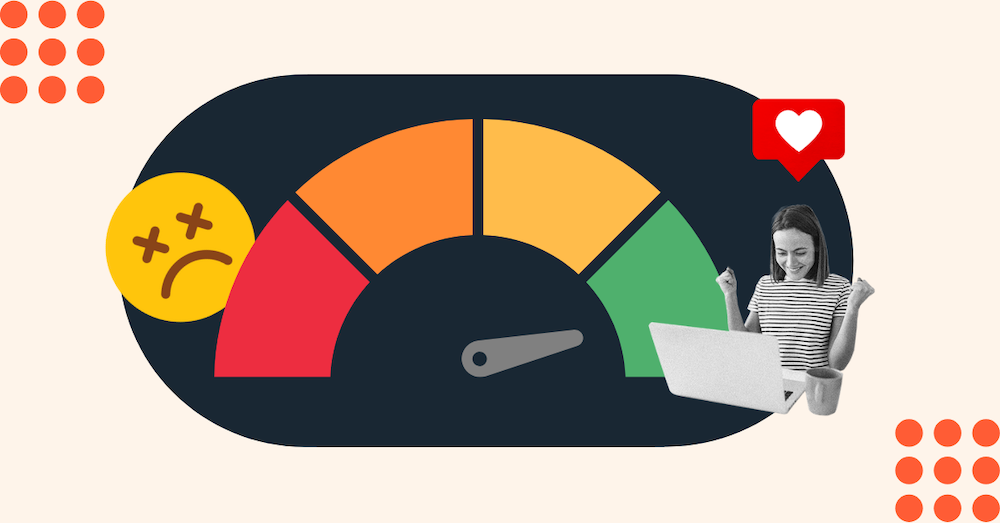
A customer health score provides an overall summary of a customer's satisfaction with your business. It combines all of your historical data — like CES, CSAT, and more — on the customer and displays a color that symbolizes how the customer feels about your company.
Green means they're content, yellow means there's room for improvement, and red means they're at risk to churn.
80% of consumers say that experience matters just as much as the products and services provided. An overall health score that combines multiple metrics is critical for maintaining an overall picture of your customer satisfaction rates.
Your customer-facing employees can use this to ensure they're providing the best service to customers who have had poor experiences with your company.
With customer health scores, you can also make efforts to retain customers who are in the yellow or red. Marketing, sales, and customer service teams can target these customers and provide offers that improve their opinion of your business.
If successful, these customers can be converted into customer advocates who will refer your company to other potential leads.
For example, George Fraguio, VP of Lending at Vaster Capital, highlights the importance of customer loyalty programs in assessing customer health:
"If you offer customer loyalty programs, observe how many of your customers opt for them and how often they use them. This will reveal not only your customer acquisition and retention rate, but how loyal these customers are. If they are willing to sign up for a customer loyalty program, this means that they are truly invested and committed to sticking around on a long-term basis."
6. First Response Time
First response time is the amount of time it takes for a customer to receive a response or acknowledgment from a customer service team.
How quickly you respond to a customer service inquiry has a direct correlation to how satisfied your customer will be. LiveChat reports that companies using its software reply within 40 seconds on average.
When a customer receives a response within five seconds, the average CSAT is 85%. When it takes more than two minutes for a response, the CSAT drops to 60%.
7. First Contact Resolution
Your first contact resolution rate highlights how often support cases are closed on their first attempt.
94% of consumers expect a reply to their requests within 24 hours, a timeframe which is significantly shorter (less than one hour) when the customer has made contact specifically through digital channels.
If a case is not resolved quickly, or if a customer needs to revisit the problem, it could hurt customer satisfaction. Getting this number as close to 100% as possible should be a top priority for support.
Choose the number of tickets/incidents from a specific period — one year, one month, all time, etc. — and be consistent in entering the metrics from that time for accuracy.
8. Ticket Resolution Time
This customer satisfaction metric measures how long it takes your company on average to resolve a customer service complaint. Measure the duration of time between when a customer submits a request to when you close the ticket.
Research from LiveChat reveals that customer satisfaction decreases with longer ticket resolution times, but only slightly. While you should track and aim to decrease ticket resolution time, it's not as impactful as first response time and first contact resolution.
9. Average Ticket Time
Unlike ticket resolution time, average ticket time measures how much active time it took your team to resolve a complaint.
This is important to help you understand how effective your team is and how to appropriately staff your customer support team. To measure this, you can take your total labor hours for a given week and divide that by the number of complaints resolved.
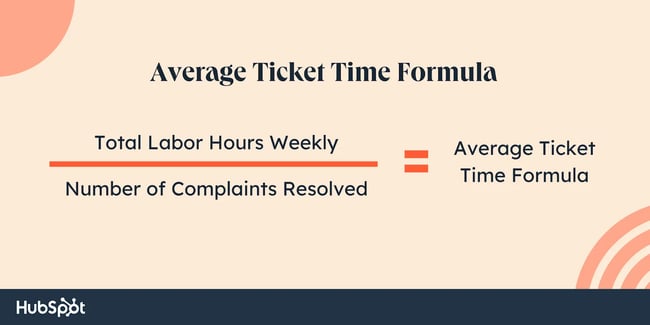
For instance, if you had one full-time employee and two part-time employees, you may have 80 labor hours. If you resolve 40 tickets in a week, your average ticket time is two hours.
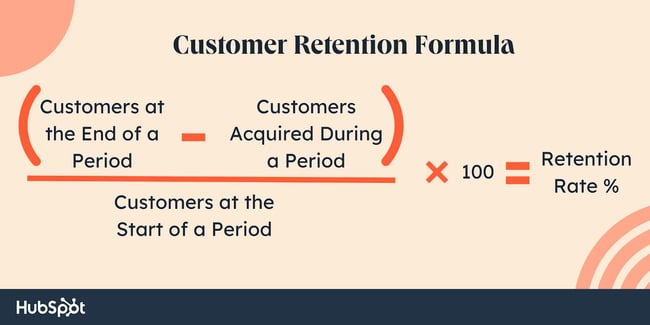
10. Customer Retention Rate
Customers are more likely than ever to switch brands or services if they are not happy with the product, service, or experience. In Sitecore's 2022 brand authenticity research, 66% of customers said they have committed to never purchasing from a brand again after a negative experience.
One excellent metric for measuring customer satisfaction is your customer retention rate.
This rate, expressed as a percentage, shows how many customers you've retained over a given period. The higher your rate, the more satisfied you can presume your customers are.
To calculate this, take your number of customers at the end of a period and subtract new customers acquired during that period. Then, divide this by the number of customers you had at the start of that period, multiply it by 100, and you have your customer retention rate.
11. Customer Churn Rate
The opposite of customer retention is customer churn, measured with a percentage that shows the rate by which you're losing customers. Since new customer acquisition is expensive, you want to keep this number low.
Customer churn and retention can vary greatly by industry. For instance, the Energy/Utilities industry has the lowest average churn rate at 11%, according to CustomerGuage. In other words, they enjoy the highest customer retention rate at 89%.
High customer churn can be due in part to customer support, but it can also be due to factors like pricing or product quality. If you see your customer churn percentage inching up, that's a clue that you need to investigate what's impacting your customer satisfaction.
12. Customer Lifetime Value
You already know how valuable it is to retain your customers. But customer satisfaction isn't just important for touchy-feely reasons: There are real financial impacts stemming from customer satisfaction.
There are a few different equations used to calculate customer lifetime value (CLV), but one simple way to do it is to multiply the average annual revenue per customer by the average lifespan of a customer.
For instance, if your average customer stays for 36 months and provides $12,000 in revenue a year, then your CLV would be $432,000.
Calculate your CLV to prove to your company just how much customer support adds to the bottom line.
How to Give Your Customer Satisfaction Metrics a Boost
According to the Customer Service Report 2023 by LiveChat, the average customer satisfaction score dropped by more than 11% between 2018 and 2022 — now averaging 73%.
Industries and consumer patterns have experienced enormous changes over the past three years, and as a result, customers have higher expectations than ever.
Let's consider some stats from Genesys' State of Customer Experience report:
-
Companies report that their average queue wait time is 10 minutes, yet only 2% of customers say that a 10-minute wait is acceptable. (In fact, 50% of customers find any wait longer than five minutes unacceptable.)
-
Between 2017 and 2021, customer interactions in messaging, mobile apps, chatbots, and social media more than doubled.
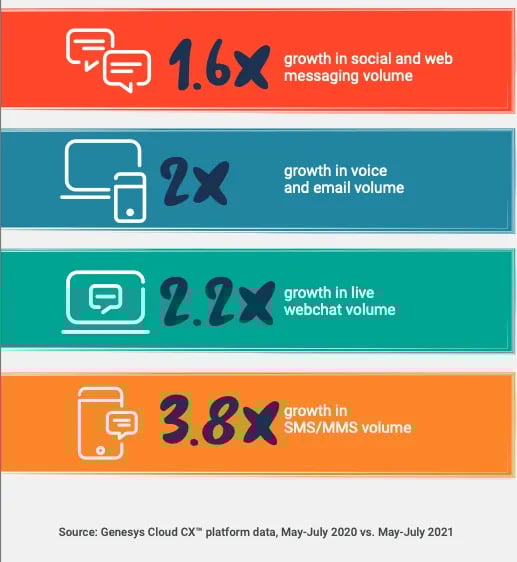
The channels customers prefer for customer support are changing. If your team isn't prepared for the influx of customers requesting live assistance, you could experience low customer satisfaction metrics.
Trends from Glimpse show that the hunt for improved customer satisfaction metrics is on the rise. Search terms such as "customer happiness," "CSAT score," and "NPS number" rose by 16%, 18%, and 8% within the last year respectively.
You can work with the existing resources on your team to not only measure customer satisfaction but improve your customer service, too. Read on to find out how.
1. Improve your first response time.
People might think they can do several tasks at the same time, but can they do them all effectively? Not usually. But sometimes, it's necessary in customer service.
Let's say you're talking or live chatting with one customer — Ben. You dove into his case and you were eager to resolve it as soon as possible.
But then, along comes another customer — Kate — and she really needs to know if you can send her an invoice for your product ASAP.
The best thing you can do in this situation is to take a break from Ben's case to answer Kate: "Hi Kate, yes, I can do it for you. Give me a moment so I can download the invoice for you."
You then go back to Ben, but in the meantime, you also download Kate's invoice.
Why is it so important to answer Kate so quickly? First response time is important for building trust and not overusing the customer's patience. It is a first step that contributes tremendously to the customer's overall experience.
That's one of the things customers love most about website chats and self-service options. 34% of customers report the most significant benefit of self-service support is the quick response times.
Even if you can't solve every customer's needs immediately, the initial response and acknowledgment of their presence are essential to satisfying your customers.
2. Prioritize first contact resolution.
Research shows that there's a disconnect between a customer's and a company's priorities in a customer service interaction.
While customer service teams report prioritizing professionalism, speed, and trustworthiness, customers prioritize first contact resolution (54%) most.
 Image source
That's an important fact that deserves highlighting. For a long time, customer service team members believed that a quick handle time made customers happy — but the data proves something else.
Overall, resolution time does not have a significant impact on customer satisfaction. The more important factor is that the issue is resolved without a lot of back-and-forth or multiple tickets.
3. Build a customer service strategy for the future.
A lot of customer support teams start hiring more reps when things start picking up — and when more customer tickets are coming in. But that isn't always the right approach to hiring to meet customer demand.
This strategy can work in the short term. However, when your organization attains hyper-growth, you'll see customer churn increase when there aren't enough reps to meet demand.
Instead, plan to scale your team before the demand storm arrives — use this formula to figure out exactly how many reps you need.
Another key element of a customer service strategy is the ability to adapt to consumer preferences. We've shown how quickly channel preferences can change: Be willing to adjust your service model to adopt new technology and practices.
4. Adopt customer feedback tools.
To gather feedback and track all these metrics, you'll need customer feedback software to create surveys and compile reports with customer insights.
Customer feedback tools should be powerful, easy to use, and integrate with existing tools like your CRM. The good news is that you can get started tracking customer satisfaction with our free customer satisfaction survey templates.
When you're ready to deploy a customer satisfaction strategy at scale, look for more sophisticated analytics tools. For example, HubSpot's Service Analytics tools provide key insights on rep performance, customer satisfaction scores and support interactions through out-of-the-box reports.
5. Center your business around customer experience.
The Flywheel model is a concept that describes the momentum your business will gain when your entire company is aligned around the customer experience.
There are three parts to the flywheel: attracting customers, engaging them, and finally, delighting them. When all three of these pieces are in motion, you'll notice great improvements in your customer satisfaction metrics.
To get your flywheel spinning, take a look around your company and ask yourself:
-
Are your marketing, sales, and service teams aligned and focused on the customer?
-
Where might the customer experience the most friction when they do business with you?
Understanding the answers to these questions will help you solve for the customer and delight them during every interaction.
Now that you understand the customer satisfaction metrics, you might be wondering, "How exactly do I collect the data?"
Well, there are a variety of ways you can measure customer satisfaction metrics to see if your efforts are actually fulfilling the needs of your customers. (Psst: Keep reading to take a look at some examples of how role model businesses keep an eye on these metrics.)
6. Leverage artificial intelligence (AI).
You can leverage artificial intelligence (AI)-powered chatbots to provide customers with a delightful experience they'll recall months after their question is resolved. There are a few reasons it's wise to invest in an AI chatbot if you're looking to boost customer satisfaction metrics.
For starters, the chatbot, which will be trained on large data sets to recognize patterns and comprehend language, can take on some of the 'easier' questions customers have. This frees up customer service reps to handle the more difficult inquiries that require human interaction. The result is a better first response time.
Additionally, AI chatbots can provide assistance for your customers 24/7, including when your customer service representatives are off the clock. This means your customers will have their questions answered when they need them which, again, can reduce friction.
If you're interested in how using an AI chatbot can give your customer service metrics, you owe it to your business and your customers to give it a try.
Customer Satisfaction Metrics Examples
Finally, I'll walk you through some examples of how leading companies use customer satisfaction metrics to inform how they can better delight customers.
The Hustle
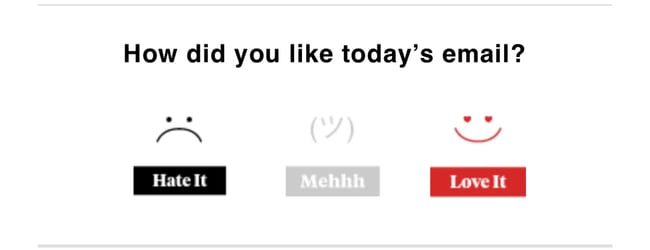
Look no further for a great example of customer satisfaction metrics than The Hustle's newsletter. Each newsletter includes a section at the end asking for feedback on the content.
When the user clicks an option, they're prompted to share more about their experience. The Hustle's team can then review the responses and measure how satisfied their readers are.
The metrics measured in this example are the customer satisfaction score and customer health score.
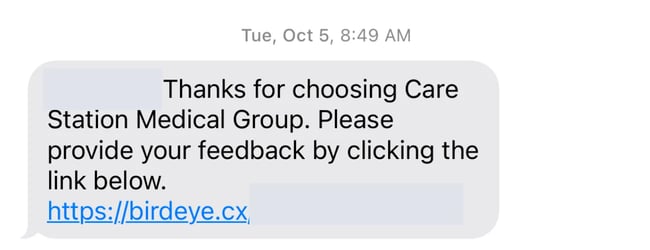
Care Station Medical Group
SMS isn't just for promoting new products and services. You can use this method of gathering customer satisfaction feedback to monitor your customers' experience.
In the example below, Care Station Medical Group sent this patient a survey to complete. The survey measures several customer satisfaction metrics like the customer effort score and net promoter score.
Measuring Customer Satisfaction
These metrics should provide you with a complete picture of customer satisfaction at your business. And, if you can come up with the right strategy that provides effective customer service, you will significantly improve customer satisfaction.
Net Promoter, Net Promoter System, Net Promoter Score, NPS and the NPS-related emoticons are registered trademarks of Bain & Company, Inc., Fred Reichheld and Satmetrix Systems, Inc.
Editor's note: This post was originally published in May 2019 and has been updated for comprehensiveness.

Customer Satisfaction

![Big Brands That Lost Customers' Satisfaction [Where CX Went Wrong + Data]](https://53.fs1.hubspotusercontent-na1.net/hubfs/53/companies%20that%20lost%20customers_featured.png)

![23 Excellent Customer Satisfaction Survey Examples [+ Templates]](https://53.fs1.hubspotusercontent-na1.net/hubfs/53/customer-satisfaction-survey-example_0.webp)


![How To Design Customer Satisfaction Surveys That Get Results [+ Templates]](https://53.fs1.hubspotusercontent-na1.net/hubfs/53/customersatisfactionsurvey.webp)