Today, I'll walk you through the answers to your most pressing questions about net promoter scores. You'll get the answer to your question, "What is a good net promoter score?" You'll also learn how to calculate your NPS and the benchmarks you should hit.
What is a Net Promoter Score?
A Net Promoter Score (also called an NPS score) is a metric used to measure how likely a customer is to recommend your business to another person. You calculate the score by asking the simple question: "On a scale of 1-10, how likely is it that you would recommend us to a friend or colleague?"
From there, you're able to sort your customers into different categories. These include:
-
Promoters - Customers who actively recommend you and have positive feelings about your company or product.
-
Passives - Customers who use your product but won't promote you. They can best be described as having neutral feelings about your company or product.
-
Detractors - Customers who have negative feelings about your company or product and will not promote you.
Your customers' answers are aggregated into a score that reflects your customer base's overall satisfaction. I'll share exact calculation below.
It's unrealistic to expect your business to satisfy every customer so much to the point of making everyone a promoter. No matter what practices, beliefs, or objectives you follow, someone in the world will disapprove.
As Taylor Swift famously sang, "The haters gonna hate, hate, hate, hate, hate." The point of your NPS is to focus on doing the best you can do for your customers. Of course, you hope that most will come to be promoters or, at least, passives.
It would waste time and energy to try to change the minds of every detractor. You can typically determine which detractors are stuck in their mindset and can never be swayed. However, there are also some who might have had just one bad experience and are still on the fence. Those are the detractors on which you can focus your energies.
NPS should be taken with a grain of salt. There are a lot of factors that are out of your control. Sometimes, your best loyal customers simply forget to score your company, while one dissatisfied customer decides to give you a whopping zero.

Free Net Promoter Score (NPS) Kit
Take control of your customer loyalty metrics with our complete NPS template + calculator.
- Easy-to-use NPS calculator
- Score interpretation tool
- Copy-and-paste survey template
- And more!
Download Free
All fields are required.
Form not available
How to Calculate NPS
Fred Reichheld from Bain & Company first coined the concept of NPS. Reichheld divided the scores range into different categories and formulated it as:
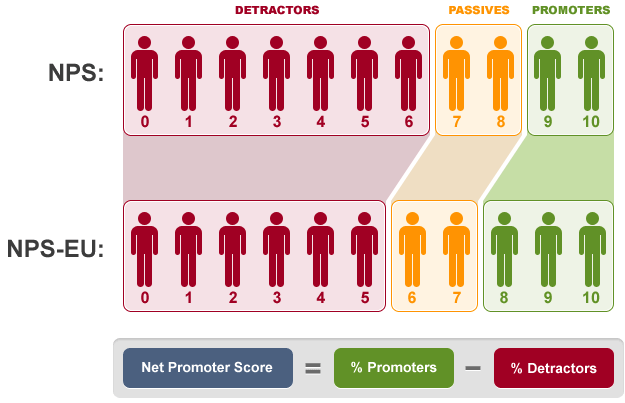
Net Promoter Score = % Promoters – % Detractors
Based on the number a customer selects, they are placed into the following categories:
- Promoters: Customers who give a score between 9-10. They are loyal customers with a high lifetime value who will also refer prospects to help the company grow.
- Passives: Customers who give a score between 7-8. They are relatively satisfied customers who may stay or move on to a competitor if the offer is right. They wouldn't go out of their way to refer prospects.
- Detractors: Customers who give a score between 0-6. They are dissatisfied customers who may damage your brand reputation by writing negative reviews or spreading negativity through word-of-mouth.
Here's a visual representation of the NPS formula for better understanding:
From the formula given above, the lowest possible score is -100 if every customer is a detractor. The highest possible score is 100 if every customer is a promoter — but both scores are unrealistic and rare.
Let's say GoDaddy sends out this email to 100 customers to rate their service on a scale of 0-10.
.webp?width=450&height=418&name=godaddy%20(1).webp)
After capturing the responses from 100 customers, the outcome is:
-
40 customers rated it between 9-10.
-
35 customers rated it between 7-8.
-
25 customers rated between 0-6.
Using the formula, the NPS score is = (40%-25%) = 15%
Hence, the net promoter score was 15, which means that there are more promoters than detractors.
Here's the thing: How "good" your NPS score is depends on what industry you're in. In other words, you need to take industry benchmarks and averages into account to get a clear picture.
Free Net Promoter Score (NPS) Kit
Take control of your customer loyalty metrics with our complete NPS template + calculator.
- Easy-to-use NPS calculator
- Score interpretation tool
- Copy-and-paste survey template
- And more!
Download Free
All fields are required.
Form not available
NPS Scores by Industry
If you want to know how good your NPS score is, you'll need to understand benchmarks in your industry.
For example, a good NPS score for a health insurance company may be lower than that of a luxury resort chain. I'm never excited to talk to my insurance provider, but I am stoked about my next hotel stay.
Theoretically, any score higher than the average competitive set is considered good. By prioritizing customer experience more than your competitors, you can grow faster and build stronger customer relationships.
By comparing your NPS scores with the competitors, you can analyze where you stand in the competitive landscape. This helps you understand where you lead and the areas you need to improve.
Here are the NPS benchmark scores in 2022-23, sorted by industry:
As you can see from the data, a "good" NPS score really does depend on your industry. Find your industry in this list to see the average within your field:
-
Department/Speciality Stores: 59
-
Smartphones: 56
-
Brokerage/Investments: 49
-
Computers/Tablets: 47
-
Online Entertainment: 45
-
Online Shopping: 45
-
Auto Insurance: 39
-
Drug Stores/Pharmacies: 38
-
Cell Phone service: 37
-
Credit Cards: 37
-
Banking: 35
-
Shipping Services: 35
-
Home/Contents Insurance: 32
-
Travel Websites: 31
-
Life Insurance: 31
-
Health Insurance: 30
-
Hotels: 29
-
Software & Apps: 27
-
Airlines: 22
-
Rideshare & Food delivery: 20
-
Cable/Satellite TV Services: 6
-
Internet Service: 6
From the above data, I drew some highlights for the average NPS scores in 23 industries:
-
The average NPS scores in 2022 were slightly higher for most industries than in 2023. Department and Specialty is a B2C industry that scored the highest NPS score with a +1 change in 2023.
-
The top 3 NPS scorers include Department and Speciality, Smartphones, and Investment.
-
Compared to 2020 data, the average NPS benchmarks had higher aggregate and saw a positive impact on most industries, with none below zero. However, some industries ascended in NPS scores.
-
Hotels saw the most noticeable decline from 49 in 2022 to 29 in 2023. The other industries with a staggering decline were Software and Apps (from 41 to 27), Airlines (from 45 to 22), and Rideshare and Food Felivery (from 31 to 20).
-
Shipping Services witnessed a noticeable increase from 2022 (from 27 to 35). Cable and TV, as well as the Internet industry, increased from negative NPS scores to above 5 in 2023.
In a nutshell, I concluded that detractors are more likely to score a company than promoters and passives. While some industries have scored decently, some have dropped drastically due to inflation.
Whatever the case, most of these industries have room to improve. The light at the end of the tunnel? There's a growth opportunity.

What is a good Net Promoter Score (NPS)?
Technically, any score above zero can be considered a "good" score, as this implies that you have more promoters than detractors. 50 and above is excellent. 70 and above is the best of the best, although achieving either of these is both outstanding and rare.
A completely average Net Promoter Score would be zero. That would imply that the business has as many detractors as they do promoters. Try to refrain from thinking of average NPS scores as bad or good — they're just average. However, this does demonstrate room to improve. If you find that your business has average NPS scores, this is a sign that you should continue to invest in the customer experience so loyalty can improve.
Since there isn't a universal standard for NPS, most companies compare their scores to other businesses in their industry. This gives them an idea of how good their customer experience is compared to their competitors.
If they see that their score is falling short, they can analyze the top performers in their industry and adapt their customer service approach.
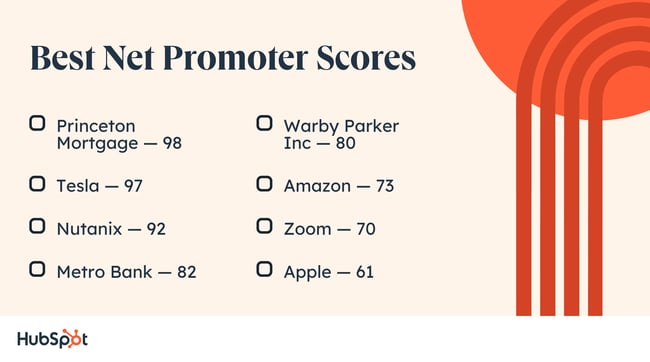
To better understand good NPS, let's look at the companies with the best Net Promoter Scores in their industry this year. As you can imagine, you can learn a lot by looking at businesses with the highest NPS scores.
Best Net Promoter Scores
- Princeton Mortgage — 98
- Tesla — 97
- Nutanix — 92
- Metro Bank — 82
- Warby Parker Inc — 80
- Amazon — 73
- Zoom — 70
- Apple — 61
1. Princeton Mortgage — 98
Princeton Mortgage has the highest NPS score in the finance industry as of 2023. Founded in 1983, the company is a mortgage lending service backed by a 100-year-old, real-investment and insurance company. The company has a market cap value of over $200 million.
2. Tesla — 97
Tesla Inc. is an electric vehicle company headquartered in Austin, Texas, and its customers are among the most loyal in the auto industry. Its NPS score of 97 reflects that most customers are promoters, while 3% are passives and detractors.
3. Nutanix — 92
Nutanix is a SaaS-based company that specializes in providing enterprise cloud platforms. Founded in 2009, Nutranix sells software, cloud services, and software-defined storage. The company saw a market cap value of around $5.75 billion in 2023.
4. Metro Bank — 82
Metro Bank is a popular investment bank in the United Kingdom, which was founded in 2010. It was the first new high street bank to launch in the UK in the last 150 years. It specializes in various banking and mortgage services, including Bank accounts, savings, mortgages, insurance, and borrowing. As of 2023, Metro Bank generated a market cap value of $152.64 million.
5. Warby Parker Inc — 80
Warby Parker Inc. is the largest retailer of prescription glasses, contact lenses, and sunglasses. It was founded in 2010 as an online retailer but now also operates retail stores. Today, the company owns over 200 physical retail stores across the U.S. and Canada.
6. Amazon — 73
Amazon is a multinational retailer largely known for its vast online marketplace, cloud computing services (Amazon Web Services), and streaming media. Founded in 1994, Amazon is a renowned marketing leader with the largest collection of products globally. The current market cap value of Amazon stands at $1.56 trillion.
7. Zoom — 70
Zoom's high NPS can be attributed to its user-friendly interface, reliable performance, and swift response to the increased demand during the COVID-19 pandemic. The platform's commitment to continuous improvement, responsive customer support, and diverse features have collectively contributed to a positive user experience and widespread satisfaction.
8. Apple — 61
Apple is much more than a tech company providing just hardware and software. Instead, Apple considers the entire user experience and maps out every step in the customer journey. This has helped them create not only ground-breaking products but also innovative customer service experiences.
For instance, the "Genius Bar" is an excellent example of how Apple invests in its customers beyond the point of purchase.
Clearly, based on the competitive set above, getting a good score — let alone excellent or more — is difficult. It's an accomplishment to be in the positives. For example, it's extremely rare for a U.S. presidential candidate, even one who ends up winning, ever to break zero. This is because many people have differing opinions about politics.
So, even if your company's NPS isn't as high as you expected, it doesn't necessarily mean it's bad. An average score can still mean you're creating a positive customer experience. But it also means you can continue to grow — and you should!
.png)
Free Customer Service Metrics Calculator
Calculate your business's key metrics and KPIs for customer support, service, and success with this free template.
- Customer Acquisition Cost
- Customer Lifetime Value
- Customer Satisfaction Score
- And More!
Download Free
All fields are required.
Form not available
How to Snag a Great NPS Score
So, what's the secret sauce that'll help land you on the list of companies with the highest NPS scores? The reality is that there isn't one — just that your business commits itself to creating an unforgettable experience for its customers. A customer-centric mindset can ensure you set clear goals and values for your customer support, service, and success teams.
Let's look at some actionable tips to improve your NPS score and compete within your industry.
Close the loop with customers.
Every large organization and enterprise does this. Bain & Company considers "closing the loop" to be the central element of the Net Promoter System.
That doesn't merely mean sending an email that you have recorded their feedback but also reaching out to them through modes of communication. You can use emails, phone, SMS, or other direct modes to collect feedback.
This becomes imperative when there are more passives and detractors. Try to gather as much information in the survey when a customer rating goes below 8. Then, follow up with them individually. When the customer feels heard, they might have a change of heart and consequently turn into a loyal one.
Train your team around NPS.
Everyone on the team should know the NPS system and ways to measure, improve, and analyze the scores. Organizations should focus on winning over promoters, creating strategies to convert detractors into passives, and educating their teams about the NPS tools.
To add further, keep the brainstorming sessions a priority. Reichheld considers these short sessions as "hurdles" — meetings that are usually 15 to 30 minutes long.
Make the necessary organizational changes.
NPS analysis allows organizations to analyze the loopholes and customer pain points and determine which department has more detractors than the promoters. It might not be just a department but a product or the customer journey that's leading to lower NPS scores than average.
If necessary, be ready to change the company policy, messaging, and structure, which might be a major issue of concern. Re-track the NPS and notice if the changes made impact the NPS.
Use NPS to Grow Better
Once you analyze NPS data and (hopefully) find many happy promoters, don't stop there. Open up a dialogue with happy customers and see if you can engage them in a referral program to keep them satisfied — and acquire more customers in the process.
Net Promoter, Net Promoter System, Net Promoter Score, NPS and the NPS-related emoticons are registered trademarks of Bain & Company, Inc., Fred Reichheld and Satmetrix Systems, Inc.
Editor's note: This post was originally published in October 2019 and has been updated for comprehensiveness.
Nps
![How I calculate net promoter score [formula & examples]](https://53.fs1.hubspotusercontent-na1.net/hubfs/53/%5BUse-Oct-14-2025-10-16-33-2257-PM.webp)


.jpg)


![NPS Question: The Secret to Getting It Right [+ 5 Best Practices]](https://53.fs1.hubspotusercontent-na1.net/hubfs/53/nps%20question_featured-1.jpg)