
What is social media analytics?
Social media analytics is the process of gathering and analyzing data and reports based on metrics from one or multiple social media accounts.
Social media analytics provides insight into several essential factors directly tied to your marketing efforts and business success.
Here’s a list that explains the importance of social media analytics:
- Develop a deeper understanding of who your target audience is and where they spend their time
- Identify which social platforms receive the most significant amount of trafficAudit all your social channels and see how they compare to the average social media benchmarks
- Determine what type of social content leads to the most conversions, engagements, etc.
- Discover what type of social media post has the most significant reach and resonates best with your audience on specific platforms.
- Learn about what is and isn’t working in terms of social media campaigns and ads among your audience during their life and after they wrap up.
- Develop a more robust social media strategy for your business’s specific goals related to things like your marketing, sales, and service efforts.
The State of Social Media in 2025
Explore the top trends in social media for brands to know and optimize your social strategy.
- AI Content Creation
- Community Building
- Social Media Shopping
- Social Vs. Search Engine
Download Free
All fields are required.
Social Media Analytics Reports
Social media analytics reports provide an overview of specific metrics and data points — such as engagements and impressions — related to the content you share on various social media platforms.
Simply put, reports are how you’ll review your social media analytics.
Social media analytics tools (which we’ll review next) make the creation of reports simple — some of these resources provide reports from one social platform at a time. In contrast, others offer reports from multiple social media.
Either way, social media analytics reporting tools are typically customizable — meaning you can view and pull the data and reports that matter most to you and your business.
With the tools we will review below, reports can be automatically made and shared for you. But here are some of the unique aspects of social media analytics reports that you can typically customize:
- Statistics and data points that matter to you will be displayed in the report
- Time frame (weekly, monthly, quarterly, yearly, campaign start to end)
- Progress growth (i.e., how you’ll share your progress growth over time through a report — typically, either in the form of a snapshot or a comparison of stats in a given period).
Learn how to create impactful monthly reports to show ROI on your social media efforts.
As stated, your reports will be unique based on the analytics software or tool you use. However, let’s look at some of the most common social media analytics reports you may come across or create at some point.
Types of Social Media Analytics Reports
Let's look at HubSpot's social media analytics reporting options to give you some different reports available in commonly-used tools .
1. Audience Analytics Report
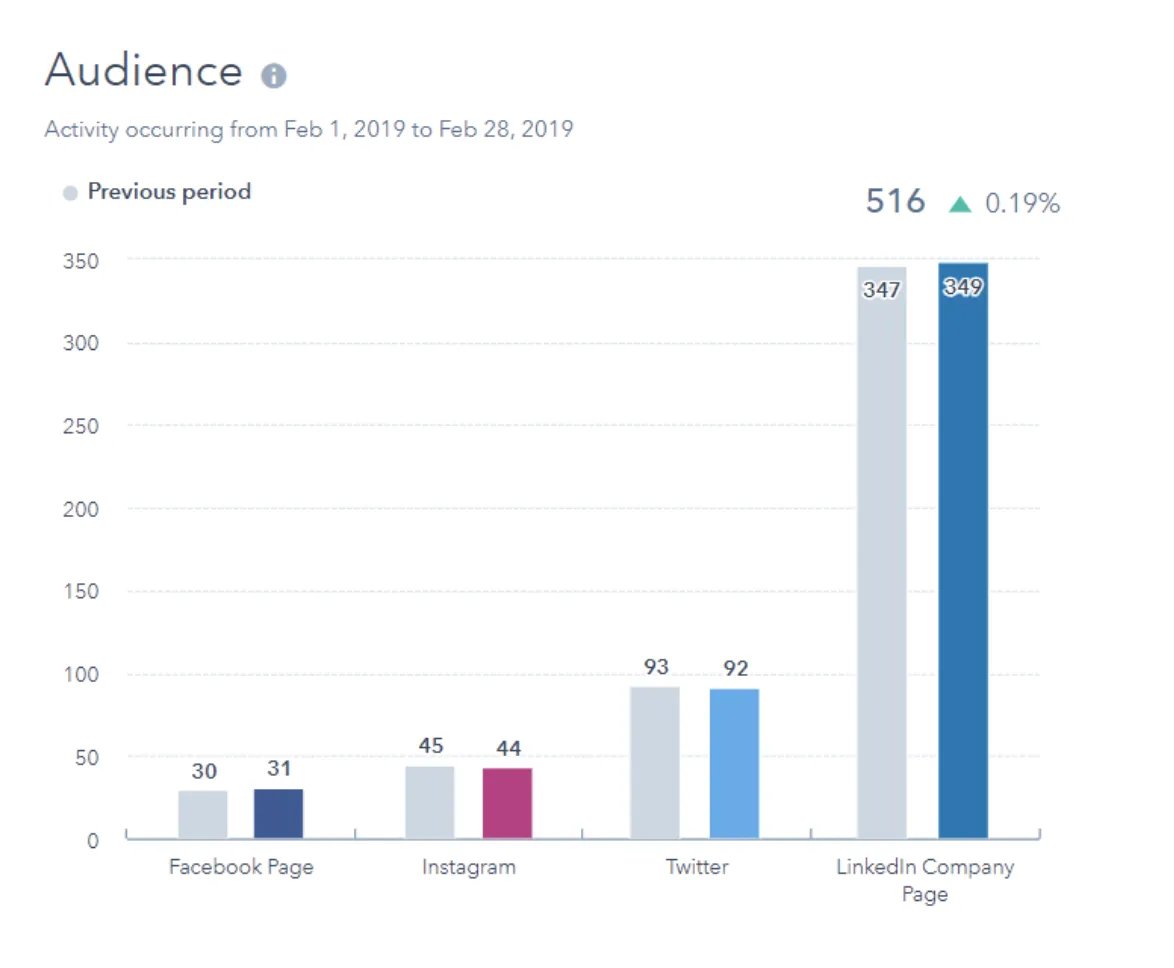
The Audience report displays your current number of followers for each social account compared to the number you had in a previous period.
2. Published Posts Analytics Report
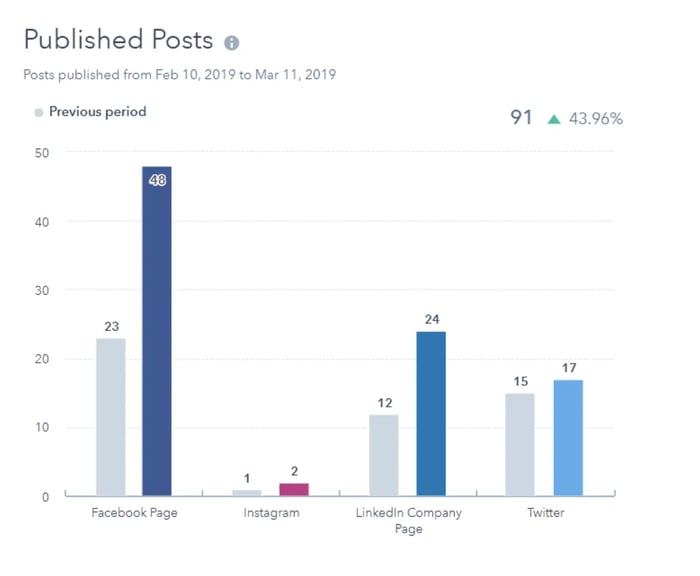
The Published Posts report shows the number of social posts published across your social accounts during a specific period.
3. Interactions Analytics Report
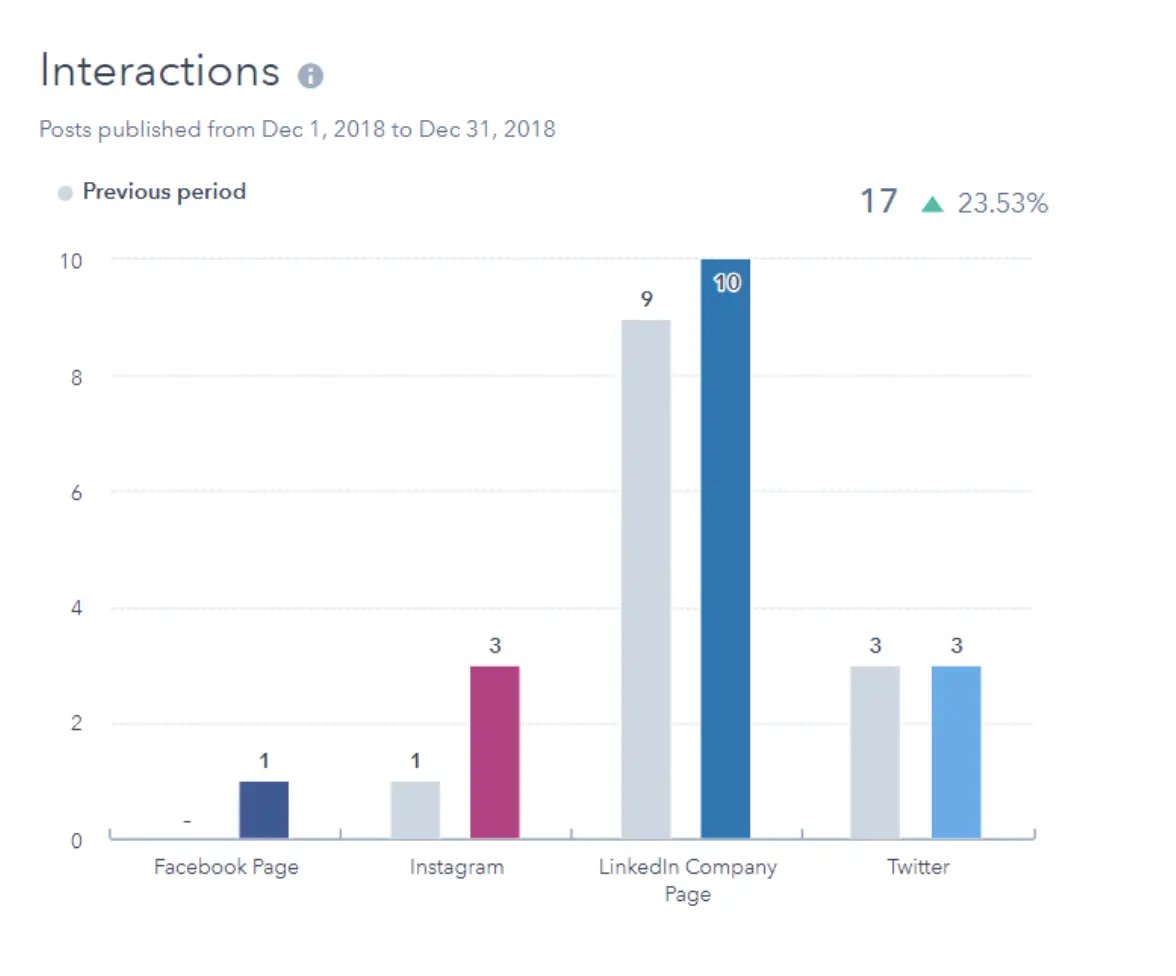
The Interactions report displays the number of likes, reactions, and comments on your posts across multiple platforms.
4. Clicks Analytics Report
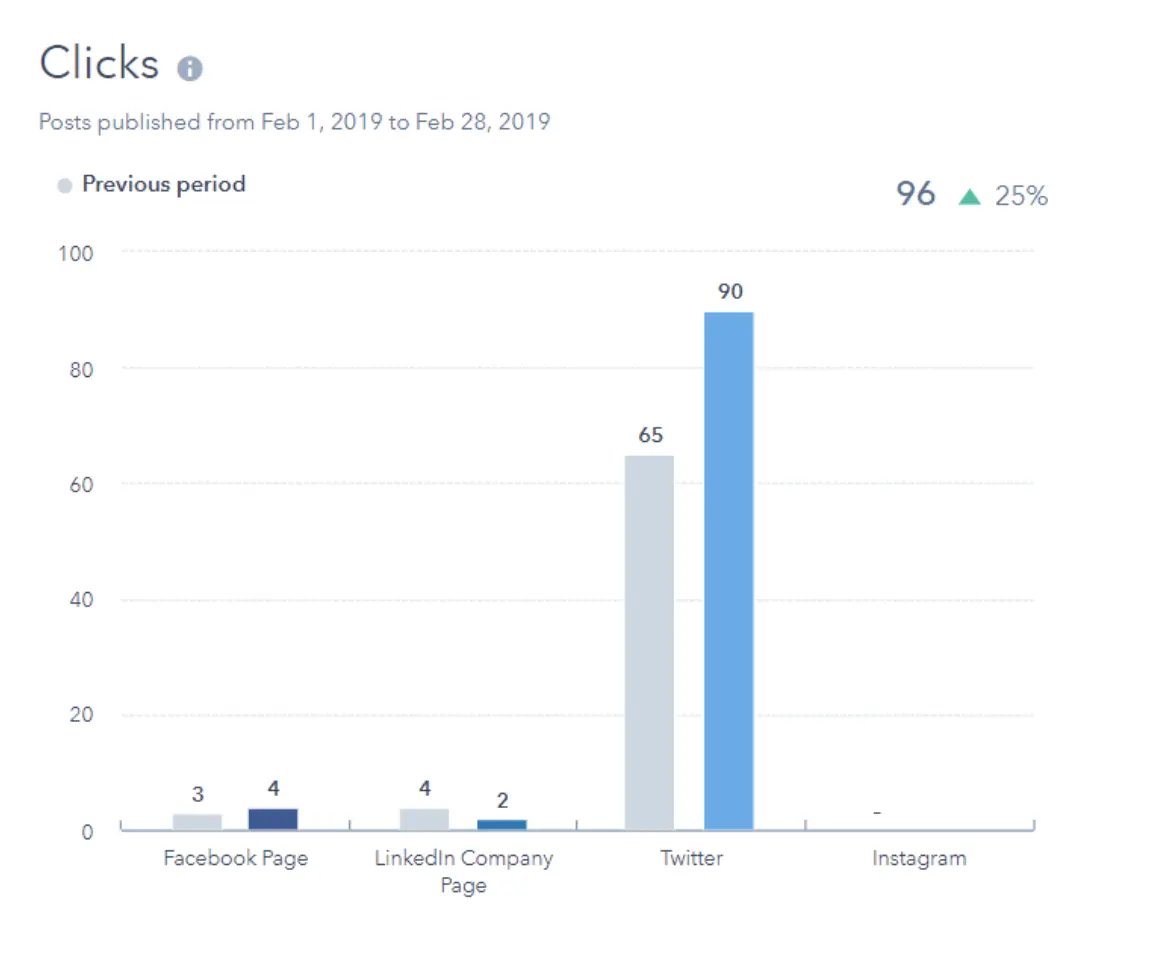
The Clicks report displays how many clicks you get on your social posts published through HubSpot.
5. Shares Analytics Report
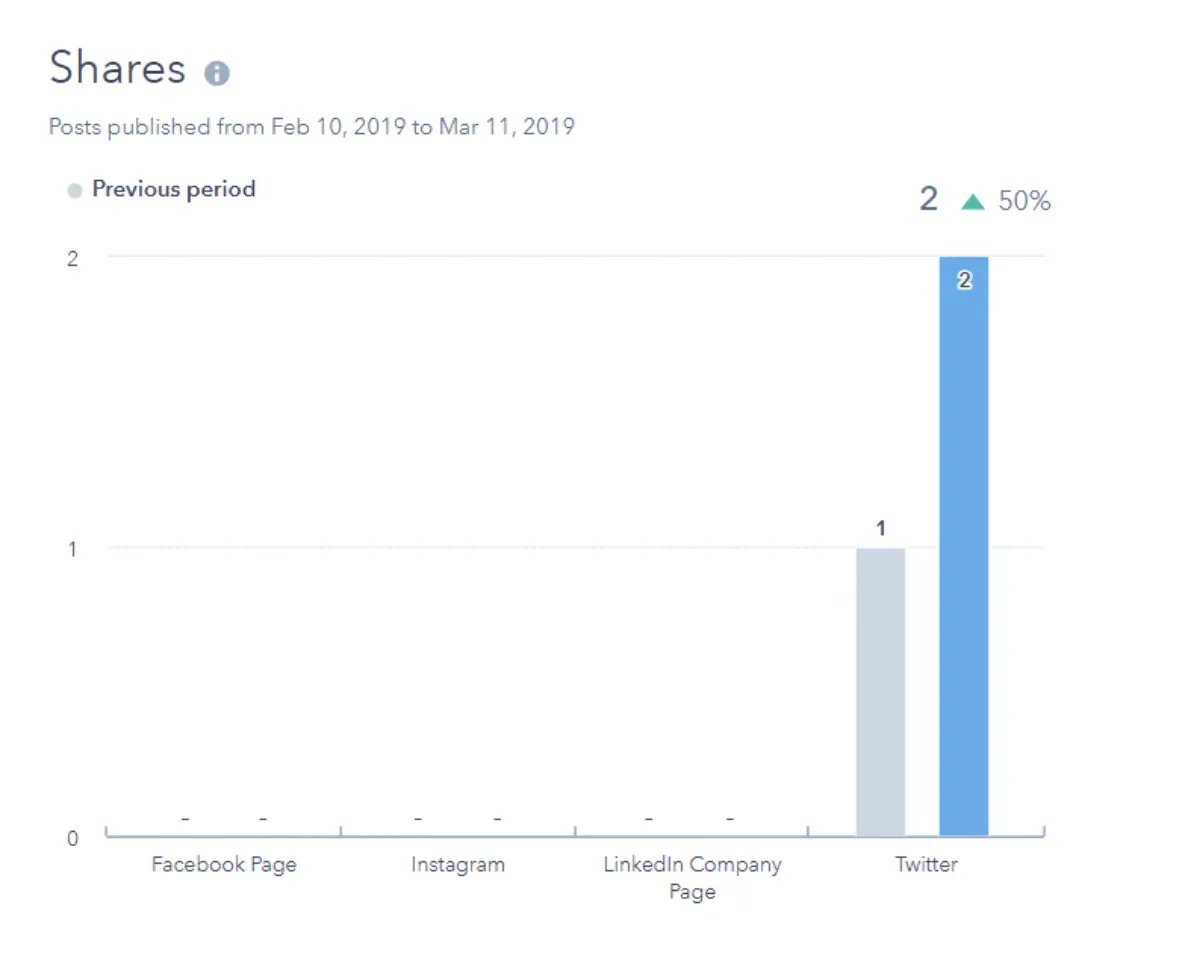
The Shares report displays the number of posts your audience members shared.
6. Impressions Analytics Report
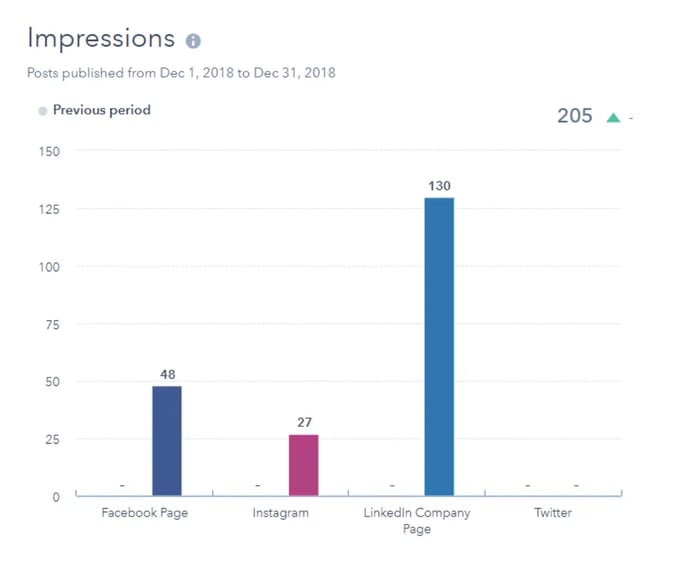
The Impressions report shows the number of views that posts on your LinkedIn, Facebook, and Instagram pages received.
7. Sessions Analytics Report
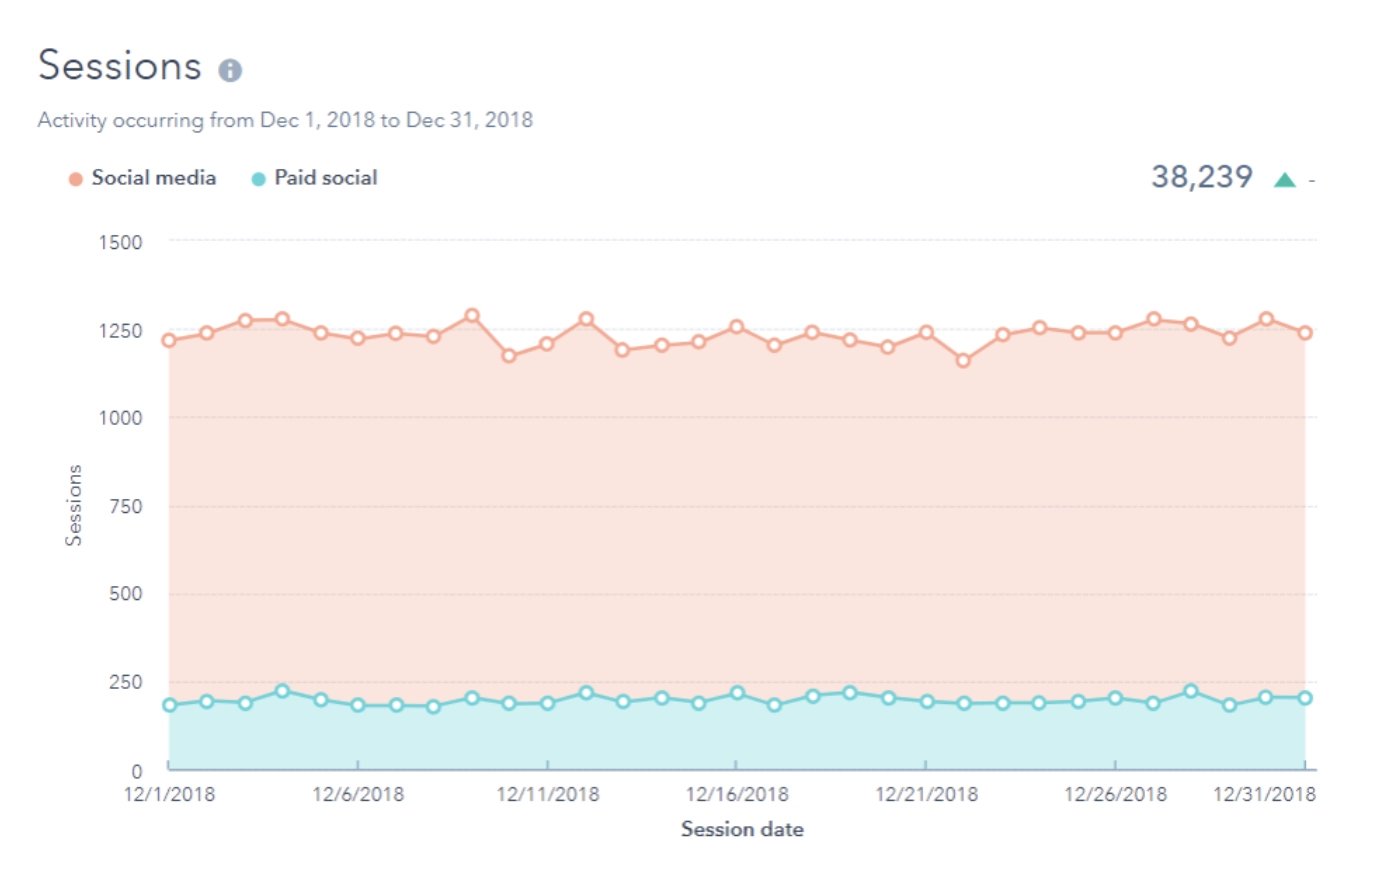
The Sessions report displays how many web sessions on your site took place within a given period driven by social media.
8. New Contacts Analytics Report
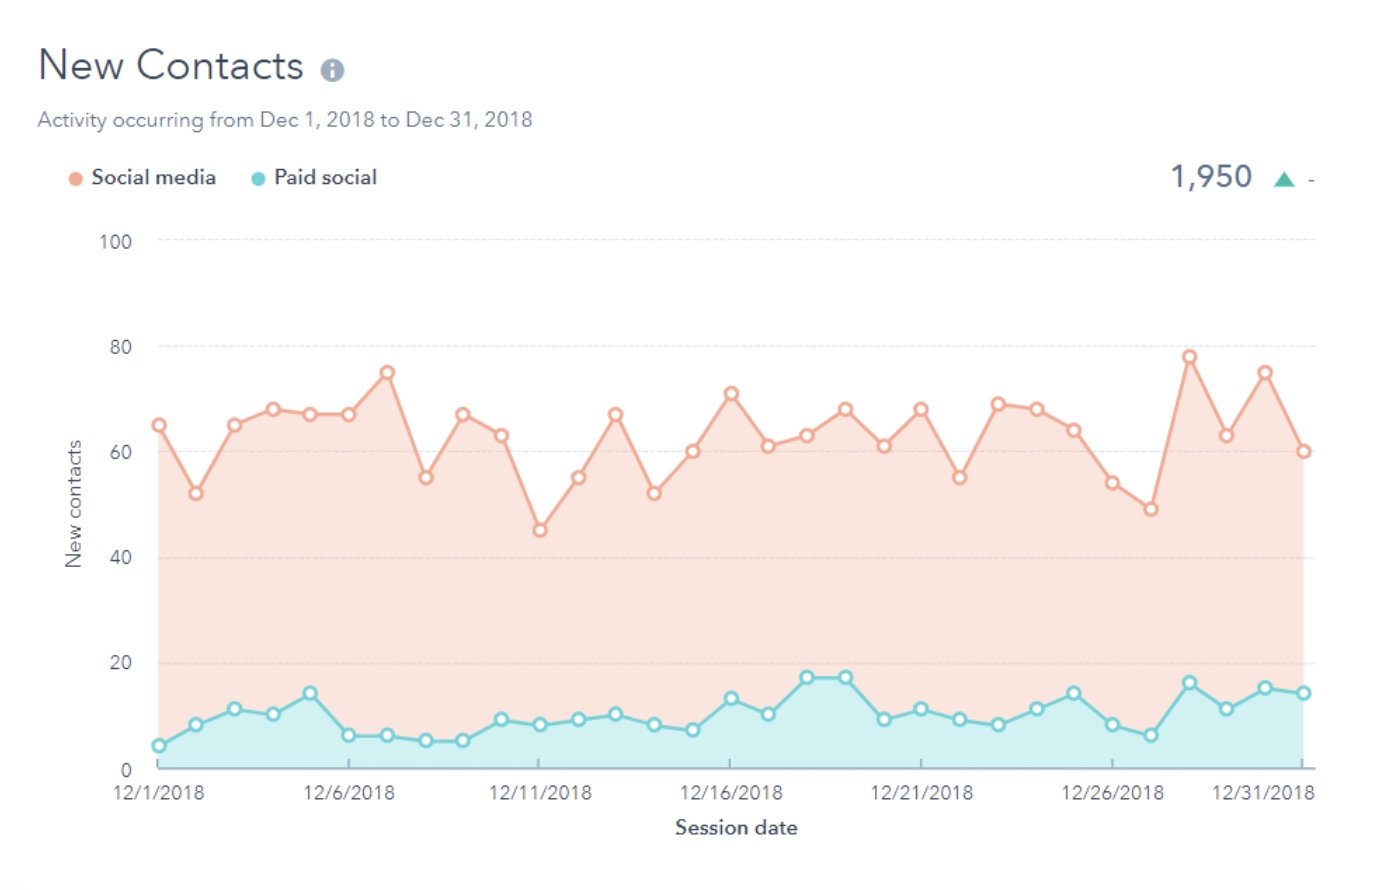
The New Contacts report displays how many new contacts have been created in HubSpot due to web sessions driven by social media within the selected period.
Now you may be wondering what tools are available to help you pull these reports and data — next, we’ll cover some of your options.
Best Social Media Analytics Tools
There are many social media analytics tools available today, which is why identifying the right one for your business can seem daunting. We’ve compiled the following list of seven of our favorites to help get you started.
1. HubSpot Social Media Software
HubSpot Social Media Software gives insight into the customer journey through integrated analytics tools.
These help you understand which marketing tactics work best among your audience, determine how your marketing efforts impact your bottom line, and learn about your search engine optimization (SEO)-related ROI.
Try HubSpot's social media tools free for 30 days.
In addition, HubSpot’s Social Media Software has several a resources available for you to implement in your strategy.
These resources include social media analytics report templates, free social media analytics tools, and social media courses.
Note: HubSpot also integrates with other analytics software, like Oktopost.LinkedIn, Facebook, Instagram, and YouTube are powerful platforms HubSpot can integrate with.
To learn more about HubSpot integration, visit our integrations marketplace.
2. TweetDeck
TweetDeck is an analytics tool used for Twitter. It works in real-time to help you view and analyze your Tweet engagement, organization, management, and tracking on the platform.
3. Buffer
Buffer provides an in-depth look at how you can strategize to grow your brand on social media.
The software does this by measuring your performance on various social platforms, creating detailed reports about the data points that matter to you, and recommending ways to improve your reach, engagement, and more.
4. Mentionlytics
Mentionlytics is an all-in-one social media monitoring tool that helps businesses understand how audiences feel about their brand, competitors, or industry.
The AI-powered software tracks mentions on social media platforms and provides in-depth sentiment analysis in all languages. Their Social Intelligence Advisor, SIA transforms countless volumes of data into straightforward insights, giving recommendations for social media growth, like best posting times.
Mentionlytics allows you to measure your online brand performance and your marketing campaign performance effortlessly, using critical metrics like reach, engagement, and follower growth. Keyword and hashtag analysis, share of voice, and market trends analysis give you a clear overview of your online presence and help you take actionable steps to improve it.
5. Meltwater
Meltwater is a powerful social media analytics tool that helps organizations monitor and analyze online engagement and brand presence across multiple platforms. It provides real-time insights, enabling businesses to monitor trends, measure campaign performance, and better engage with their audience. By leveraging Meltwater’s data and advanced analytics, companies can make informed decisions and optimize their social media strategies for better engagement and growth.
6. Rival IQ
Rival IQ is all about bringing a competitive lens to your social media analytics, helping you benchmark against your main competitors or even your whole industry on Facebook, Instagram, Twitter, TikTok, YouTube, and LinkedIn.
AI insights and post tagging make it easy to adapt your social strategy in real time and create bespoke analysis.
You can explore Rival IQ’s powerful competitive social media analytics without leaving HubSpot using Competitor Streams.
7. Hootsuite
Hootsuite allows you to create customized social media reports using over 200 metrics across your social channels and campaigns.
These reports are easily shareable with members of your team and your clients to keep everyone on the same page and prove ROI.
8. Sprout Social
Sprout Social provides a look into your customers' needs through the conversations your customers and followers are having on social media.
The software also measures your specific content and campaign work across various platforms and channels to determine what’s working best among audience members and what should be improved upon.
(Note: Sprout Social is another social media software integrates with HubSpot.)
9. Mention
Mention is a tool that allows your company to monitor, listen, and analyze your posts and your interactions with and among audience members via different social channels and platforms.
The software also makes creating automated reports to share this data with fellow employees or clients easy.
Next, look at applying these tools and resources in your day-to-day work by reviewing the steps in tracking social media analytics (also known as your social media analytics strategy).
How to Track Social Media Analytics
- Set SMART social media analytics goals.
- Determine which social media analytics tools you’ll use.
- Implement your social media analytics tools of choice.
- Measure the success of your social media analytics efforts.
- Make necessary social media analytics adjustments.
Work through the following steps to begin tracking your social media analytics and gaining a better understanding of which parts of your processes are working and which need to be modified. Again, you can think of this as your social media analytics strategy.
The State of Social Media in 2025
Explore the top trends in social media for brands to know and optimize your social strategy.
- AI Content Creation
- Community Building
- Social Media Shopping
- Social Vs. Search Engine
Download Free
All fields are required.
1. Set SMART social media analytics goals.
Create and set SMART goals to help you achieve your social media analytics goals.
By ensuring your goals are SMART, they’ll be Specific, Measurable, Attainable, Relevant, and Time-bound and you’ll be able to focus your strategy to reach or even exceed your expectations efficiently.
First, ask yourself, “What do I want to learn from my social media analytics?” Then, dive into each part of the SMART goal. Here’s an example of a SMART plan related to your social media analytics strategy for reference.
Use a free template to help you create SMART goals and achieve them.
- Specific: I want to use social media analytics to identify specific data points related to my marketing tactics to determine which posts and campaigns work best in reaching and engaging our audience members.
- Measurable: I want to be able to identify some specific data points to accomplish this goal.
- Attainable: I will identify three specific data points to help accomplish this goal.
- Relevant: These data points will help my team, and I measure our success in reaching and engaging our audience members across social media channels and identify gaps or areas for improvement in our social media strategy.
- Time-bound: I want to identify these specific data points over the next month.
This way, in four weeks, we can use them to measure our success in reaching and engaging audience members across social channels and identify gaps and areas for improvement in our social media strategy.
2. Decide which metrics you’ll focus on and track.
Now it’s time to decide which social media metrics you will track. There are several commonly-tracked social media metrics for your consideration.
Metrics may vary by social platform and which analytics tool you choose. But here are some all-encompassing metrics applicable to virtually every social channel and analytics tool to get started.
- Reach is the total number of people who have seen your content.
- Engagements are all interactions, including shares, likes, and comments.
- Impressions are the number of times content is displayed on someone’s feed.
- Mentions are when audience members or other companies reference your business and brand on social media.
- Social ROI provides insight into whether your investment in your social media marketing results in an increase or decrease in customers, sales, brand awareness, and customer loyalty.
- Social listening is when you monitor conversations about your business and brand on social media to see what customers and audience members say about you.
- Likes are when an audience member taps (or double taps) on your social content to show they’re a fan of your post.
- Retweets/shares/reposts are when audience members post your business's published content on their profiles.
3. Determine which social media analytics tools you’ll use.
Next, determine which social media analytics tools you’ll use — we covered some popular choices above, but you can always review other options through a simple Google search.
Before deciding on which tool or tools you’ll use, think about the following questions:
- Do you want a tool or software to help you manage your social media analytics across multiple channels and platforms (e.g., Twitter, Facebook, LinkedIn) or just one (e.g., Twitter)?
- Which metrics did you decide to track (as discussed above)?
- What is your budget? Do you need a tool with flexible pricing options and features that you can add to or remove over time? (To find this information, review the pricing pages like this page on Sprout Social’s website.)
- Which tools and software options are suited to help you achieve your SMART goals? (Check out feature pages for this type of information, like this page on Oktopost’s website.)
- Do you want your tool to integrate with your team's more powerful software to run your business (such as HubSpot’s CRM, for example)?
4. Measure the success of your social media analytics efforts.
Once you implement your social media analytics software, you’ll be able to measure the success of your efforts.
To do this, you'll need to use the analytics tool you implemented. Depending on your software, you can create customized reports and dashboards or pull the specific details about data points you care most about.
In addition to applying your tools to help measure your success, you may also consider your answers to the following questions:
- Did you achieve your SMART goals?
- Did the metrics you chose to focus on tell a story helpful for your business?
- Did the software or tool you implemented support your business needs?
5. Make necessary social media analytics adjustments.
Once you measure the success of your social media analytics efforts, you’ll be able to determine whether or not any part of your strategy needs to be changed or updated.
Maybe you realize one of your data points isn’t providing the level of insight into your marketing efforts across social platforms, so you need to identify a new one to measure.
Maybe your software doesn’t allow you to customize cross-channel reports how you want to, so you must implement a new tool.
Or, if you’re happy with how your social media analytics reporting and strategy is working, be sure to revisit your system in the future to ensure it continues to meet your expectations.
The State of Social Media in 2025
Explore the top trends in social media for brands to know and optimize your social strategy.
- AI Content Creation
- Community Building
- Social Media Shopping
- Social Vs. Search Engine
Download Free
All fields are required.
Begin Tracking and Applying Social Media Analytics
By tracking and applying social media analytics to your strategy, you’ll be able to reach your audience more effectively.
And when you do this, you’ll see improvements in factors directly tied to your ROI, like engagement, conversions, loyalty, and more.
Consider which tools and software are best for you and determine how you’ll track your social media analytics to create deeper relationships with your customers and followers.
Editor's note: This post was originally published in March 2020 and has been updated for comprehensiveness.
Social Media Analytics
![How to Create a Social Media Report in 7 Simple Steps [+ Free Templates]](https://53.fs1.hubspotusercontent-na1.net/hubfs/53/social-media-report-1-20240724-2630720-1.webp)
![How to measure social media marketing ROI [with expert advice]](https://53.fs1.hubspotusercontent-na1.net/hubfs/53/social-media-roi.png)


![Blog Conversations Don't Lead to More Views or Links [New Data]](https://53.fs1.hubspotusercontent-na1.net/hubfs/53/analytics-1.jpg)


![What Makes Top Company Blogs So Successful? [New Data]](https://53.fs1.hubspotusercontent-na1.net/hubfs/53/Inboundrank_data/Blogging_data_top_10.png)