.png?width=112&height=112&name=image%20hackathon%20%E2%80%93%20square%20(62).png)

These first steps led to a five-year career in administration, specializing in sales and compliance across both the public and private sectors. It was hard. It was busy. It was mentally draining. But honestly? I gained SO much experience that I still rely upon heavily today — especially when it comes to collating, understanding, and visualizing data.
Here are the types of charts and graphs I've used most, plus when they're most effective.
Table of Contents
- Why Data Visualization Matters
- Charts vs. Graphs: What’s the Difference?
- Different Types of Graphs for Data Visualization
- The Four Basic Types of Charts
- Different Types of Charts for Data Visualization
- How to Choose the Right Chart or Graph for Your Data
- 5 Questions to Ask When Deciding Which Type of Chart to Use
.png)
Free Excel Graph Templates
Tired of struggling with spreadsheets? These free Microsoft Excel Graph Generator Templates can help.
- Simple, customizable graph designs.
- Data visualization tips & instructions.
- Templates for two, three, four, and five-variable graph templates.
Download Free
All fields are required.
Form not available
Why Data Visualization Matters
If you’re in content strategy like me, you’ll know not a week, nay, a day, goes by that you don’t have to examine some chart or graph to understand what is and isn’t working about a campaign, channel, or tactic. And that’s not to mention the age-old challenge of reporting on marketing data to various stakeholders. (Who may or may not understand what the flip you’re talking about, might I add.)
Short story shorter, if you feel like you’re drowning in data in your day-to-day role, that’s because you kinda are. In fact, the volume of data in 2025 is almost double the data we created, captured, copied, and consumed in previous years. It goes without saying, but I’m going to say it louder for the folks at the back anyway: How you visualize all that data is key to driving business success.
For a start, different types of graphs and charts can help you:
- Motivate your team to take action.
- Impress stakeholders with goal progress.
- Show your audience what you value as a business.
Data visualization also builds trust and can organize diverse teams around new initiatives. Now, let's talk about the types of graphs and charts that you can use to grow your business.
Charts vs. Graphs: What’s the Difference?
A lot of people think charts and graphs are synonymous (I know I did), but they’re actually two different things.
Charts visually represent current data in the form of tables and diagrams. But graphs are more numerical in data and show how one variable affects another.
For example, in the famous sitcom, How I Met Your Mother, Marshall creates a bunch of charts and graphs representing his life. One of these charts is a Venn diagram referencing the song “Cecilia” by Simon and Garfunkel.
Marshall says, “This circle represents people who are breaking my heart, and this circle represents people who are shaking my confidence daily. Where they overlap? Cecilia.”
The diagram is a chart, not a graph, because it doesn’t track how these people make him feel over time or how these variables are influenced by each other.
It may show where the two types of people intersect, but not how they influence one another.

Later, Marshall makes a line graph showing how his friends’ feelings about his charts have changed in the time since presenting his “Cecilia” diagram.
Note: He calls the line graph a chart on the show. That’s acceptable because the nature of line graphs and charts makes the terms interchangeable. I’ll explain later, I promise.
The line graph shows how the time since showing his Cecilia chart has influenced his friends’ tolerance for his various graphs and charts.

I can’t even begin to tell you all how happy I am to reference my favorite HIMYM joke in this post.
Now, let’s dive into the various types of graphs and charts.
Different Types of Graphs for Data Visualization
1. Bar Graph
Want to avoid clutter when a single data label is long? What about if you need to compare over 10 items? In these cases, I highly recommend using the tried-and-true bar graph.
Fun data factoid alert: A vertical variant of the example below would be a column graph. Stay tuned for more fun factoids about all things data.

Best Use Cases for This Type of Graph
I love bar graphs because they can help you track data changes over time. In my experience as a former office administrator and content strategist, here’s why I love them: Bar graphs are excellent when you need to highlight big changes in data or to show how one group compares against other groups.
Here’s an example of how that works in practice. When I worked as an administrator in the education sector, I often had to compare success rates between different cohorts of learners. The most common comparison would be between cohorts of students who were taught by different tutors.
More specifically, I’d need to compare things like learner completion rates between cohorts. If some tutor’s learner cohorts were consistently overdue to complete their education programs, I could quickly identify this and present it to senior leadership using a bar graph. We could then discover the key blockers and offer support when needed.
On the other hand, if some tutors were incredibly effective at getting their learners to complete tasks on time, I could visualize this through the bar graph. We could then dig into what made them so successful. This activity allowed us to share these learnings with the team — a rising tide lifts all boats, after all!
In the example from DataHero above, the bar graph compares the number of customers by business role. I’ve shared it because hopefully you can see what I mean about how easy it is to compare groups. For example, I can use the graph to see at a glance that there are more than twice as many customers per role for individual contributors than for any other group.
A bar graph also makes it easy to see which group of data is highest or most common. At the start of the pandemic, I was working as a baby content strategist. I noticed that my client’s website traffic saw a big jump. That’s because most of the world was hunkered down at home, not just looking for ways to pass the time, but trying to purchase products they’d usually find in real life. I used a bar graph to analyze monthly traffic for online businesses, which made it easier to see and showcase the jump.
Other use cases for bar graphs include:
- Product comparisons.
- Product usage.
- Category comparisons.
- Marketing traffic by month or year.
- Marketing conversions.
Design Best Practices for Bar Graphs
I recommend using consistent colors throughout the chart, selecting accent colors to highlight meaningful data points or changes over time.
I also suggest using horizontal labels to improve its readability, and starting the y-axis at 0 to appropriately reflect the values in your graph.
Remember: Oftentimes, you’re not the only one looking at the data. You’ll likely need to present it to non-technical stakeholders in a way that clearly tells the story (i.e., what the data is actually saying.) Long and skinny? You don’t want too much visual clutter or noise on your graphs. This looks fancy, but it detracts from the story you’re trying to tell.
2. Line Graph
A line graph reveals trends or progress over time, and you can use it to show many different categories of data. I will typically use it when tracking a continuous data set. Quite frankly, it’s one of the best graphs for this.
Fun data factoid alert: The terms “line graph” and “line chart” are interchangeable. That’s because the very nature of both is to track how variables impact each other, particularly how something changes over time. Yeah, it confused me, too.

Best Use Cases for This Type of Graph
Line graphs help users track changes over short and long periods. Because of this, I tend to lean on bar graphs to highlight big changes. However, I find that line graphs work best for picking up on the small details. Big data reveals can come in small packages — don’t sleep on the smaller changes, folks.
Consider the example recently shared by Ryan Jones, the marketing manager at SEOTesting, via LinkedIn. I love that it perfectly encapsulates how line graphs can highlight small anomalies (in this case, in web traffic) that can lead to quick fixes, which can yield big results. You can also rely on the same graph to track how these changes perform over time!
<iframe src=“https://www.linkedin.com/embed/feed/update/urn:li:share:7363141799101505536” height=“1019” width=“504” frameborder=“0” allowfullscreen=“” title=“Embedded post”></iframe>
I also use line graphs to help me compare changes for more than one group over the same period. And for measuring how different groups relate to each other. When I was in business development, for example, I’d use a handy line graph to compare and report on sales rates for different products or services over time.
For the customer service folks among you, I recommend using these charts to measure service channel performance. So, say, a line graph that tracks how many chats or emails your team responds to per month.
Design Best Practices for Line Graphs
- Use solid lines only.
- Don’t plot more than four lines to avoid visual distractions.
- Use the right height so the lines take up roughly 2/3 of the y-axis' height.
Free Excel Graph Templates
Tired of struggling with spreadsheets? These free Microsoft Excel Graph Generator Templates can help.
- Simple, customizable graph designs.
- Data visualization tips & instructions.
- Templates for two, three, four, and five-variable graph templates.
Download Free
All fields are required.
Form not available
3. Bullet Graph
A bullet graph reveals progress towards a goal, compares this to another measure, and provides context in the form of a rating or performance.

Best Use Cases for This Type of Graph
In my experience, at least, you likely won’t be relying on this kind of graph as much as a bar or line graph. Still, I always find them handy to have in my data toolkit.
For example, when I worked in the business development sector of the education industry, I was involved in a lot of contract tendering. If you’re not in the know, that means I put bids together to win funding for my employer. Nine times out of 10, this meant bidding on contracts to deliver apprenticeship and work-based programs to the government and broader public service sector.
To be in with a chance of even being considered for the first stage of tender, I had to demonstrate our organization’s success rates. This meant sharing learner program completion, retention, and satisfaction rates. The real kicker? I had to share these metrics for multiple years and ideally show improvement across each.
I found bullet graphs to be extremely helpful in visualizing the story I was trying to tell. In other words, we set ourselves a goal that was mapped on the bullet graph, and we were taking steps to improve that specific success metric.
The image example above shows the number of new customers against a set customer goal. That’s another cool way you could use a bullet graph. As I mentioned earlier, bullet graphs are ideal for comparing performance against goals like this.
These types of graphs can also help teams assess potential roadblocks, as they allow for the analysis of data in a concise visual display. With this in mind, I’ve also used bullet graphs to plan team workload as a manager.
In this case, I’d visualize actual weekly team capacity against a set goal of team availability. The goal would typically be around 80% of actual productive work time and 20% for admin and giving your brain a rest from deep focus. (Rest actually enables deep work, FYI.)
Why’d I do this? Well, there is nothing that can grind team productivity to a halt quicker than having key members overloaded, while others are sitting twiddling their thumbs. If you can visualize team capacity data, it’s much easier to identify when this is the case, start digging into the details, and re-allocate workload when needed.
Need more examples? No sweat! I could also create a series of bullet graphs measuring performance against benchmarks or use a single bullet graph to visualize these KPIs against their goals:
- Revenue.
- Profit.
- Customer satisfaction.
- Average order size.
- New customers.
I promise that seeing this data at a glance, alongside each other, can help teams make quick decisions.
As I also shared above, bullet graphs are one of the best ways to display year-over-year data analysis. Bullet graphs can also visualize:
- Customer satisfaction scores.
- Product usage.
- Customer shopping habits.
- Social media usage by platform.
Design Best Practices for Bullet Graphs
- Use contrasting colors to highlight the progression of the data.
- Use one color in different shades to gauge progress.
4. Column + Line Graph
Column + line graphs are also known as dual-axis charts. They consist of a column and line graph together, with both graphics on the X-axis but occupying their own Y-axis.

Download our FREE Excel Graph Templates for this graph and more!
Best Use Cases for This Type of Graph
I find that these graphs are best for comparing two data sets with different measurement units, such as rate and time.
As a marketer, I typically track two trends simultaneously, such as website impressions versus clicks. In this case, column + line graphs help to visualize these data trends over time. That’s because there is space to present website impressions as columns over different years, alongside a line graph demonstrating how impressions and website clicks relate to each other across these years.

The example of a column + line graph above should make this easier to follow. Can you see in the example how it uses columns to chart the average number of cars sold against the average price per car? Meanwhile, the line graph helps to visualize how these relate to each other over time.
Design Best Practices
Use individual colors for the lines and columns to make the graph more visually appealing and to differentiate the data further.
The Four Basic Types of Charts
Before we get into charts, I want to touch on the four basic chart types that I use the most. Most of the others that follow are variants of these basic structures.
1. Bar Chart
Bar charts are pretty self-explanatory. I use them to indicate values by the length of bars, which can be displayed horizontally or vertically. Note: Vertical bar charts are sometimes called column charts.

2. Line Chart
I use line charts to illustrate changes in values over continuous measurements, such as time, generations, or categories. For example, the chart below shows the changes in ice cream sales throughout the week.

3. Scatter Plot
A scatter plot uses dotted points to compare values against two different variables on separate axes. I generally use them to show correlations between values and variables in my reporting. For example, tracking marketing channels or campaigns against the revenue generated.

4. Pie Chart
Pie charts are graphical representations that display data in a circular (pie-shaped) format, with each slice representing a percentage or portion of the whole.

Different Types of Charts for Data Visualization
To better understand chart types and how you can use them, I’ve provided an overview of each.
1. Column Chart
You can use a column chart for multiple use cases. However, I recommend using a column chart to display a comparison among different items or to illustrate the comparison of items over time. As a marketer, you can use this format to view revenue per landing page or customers by close date, for example.

Best Use Cases for This Type of Chart
I use both types of column charts (column and bar) to display changes in data. The main difference, of course, is that column charts show information vertically while bar charts show data horizontally.
But I've noticed a quirk: Column charts are best for negative data.
Let’s take the warehousing industry as an example. Most warehouses need to track the number of accidents on the shop floor. When the number of incidents falls below the monthly average, a column chart can make that change easier to see in a presentation.
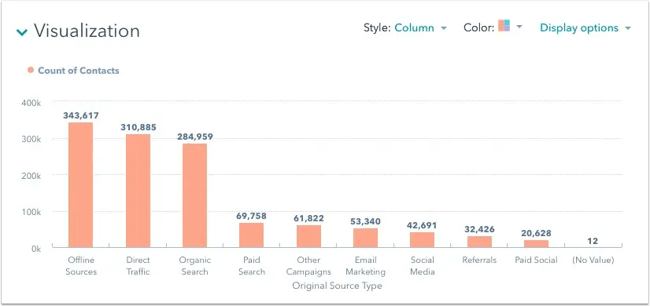
I personally love to use column charts to visualize the number of contacts I’ve generated for clients via different marketing channels. Using this reporting technique, I can quickly see which marketing channels have brought the most contacts. The next stage is to examine each channel in terms of its marketing campaigns. These can also be broken down via a column chart.
Pro tip: If you’re a HubSpot user and want to do the same, head to the custom report builder and select “vertical bar chart.”
Returning to the “customers by close date” example, this column chart measures the number of customers by close date. Can you see how easy the column chart makes it to see the data changes over a period of time? Well, this means that they have many use cases, including:
- Customer survey data, such as showing how many customers prefer a specific product or how much a customer uses a product each day.
- Sales volume, like showing which services are the top sellers each month or the number of sales per week.
- Profit and loss, showing where business investments are growing or falling.
Design Best Practices for Column Charts
- Use consistent colors throughout the chart, selecting accent colors to highlight meaningful data points or changes over time.
- Use horizontal labels to improve readability.
- Start the y-axis at 0 to accurately reflect the values in your chart.
Free Excel Graph Templates
Tired of struggling with spreadsheets? These free Microsoft Excel Graph Generator Templates can help.
- Simple, customizable graph designs.
- Data visualization tips & instructions.
- Templates for two, three, four, and five-variable graph templates.
Download Free
All fields are required.
Form not available
2. Area Chart
Okay, an area chart is basically a line chart, but I swear there's a meaningful difference…
Unlike a line chart, the space between the X-axis and the line is filled with a color or pattern. As you can see in the example below, this difference is helpful to show part-to-whole relationships. Think showing individual sales reps’ contributions to total sales for a year, for example.
As for me, I like to use area charts to analyze both overall and individual trend information.

Best Use Cases for This Type of Chart
I like to use the mighty area chart to show changes over time. In my experience, they work best for significant differences between data sets. Thus, they help me visualize larger trends.
For example, the chart above shows users by creation date and life cycle stage. A line chart could show more subscribers than marketing-qualified leads. However, here’s why I’d use an area chart instead: As you can see above, it highlights the significant difference in the number of subscribers compared to any other group.
These charts make the size of a group and how groups relate to each other more visually important than data changes over time.
Area charts can help your business to:
- Visualize which product categories or products within a category are most popular.
- Show key performance indicator (KPI) goals vs. outcomes.
- Spot and analyze industry trends.
Design Best Practices for Area Charts
- Use transparent colors so information isn’t obscured in the background.
- Don’t display more than four categories to avoid clutter.
- Organize highly variable data at the top of the chart to make it easy to read.
3. Stacked Bar Chart
I suggest using a stacked bar chart to compare multiple items and illustrate the composition of each item being compared.

Best Use Cases for This Type of Chart
I find these charts are most helpful when a group starts in one column and moves to another over time.
Let’s take spotting the difference between a marketing-qualified lead (MQL) and a sales-qualified lead (SQL) as an example. If, like me, you’ve had to do this multiple times, you’ll know this shift is sometimes hard to see. However, the chart above helps stakeholders view these two lead types from a single perspective — specifically, when a lead transitions from MQL to SQL.
That’s why I find stacked bar charts incredible tools for visualizing marketing data. They make it simple to add a lot of data on a single chart or to make a point with limited space.
Another reason I love these charts is that they can show multiple takeaways. That means they’re ideal for quarterly meetings… You know the ones — you have a lot to say, but not a lot of time to say it. Yikes!
Preparing for a planning or strategy meeting? Stacked bar charts may just be your new BFF. This is because these charts can display a lot of information simultaneously, without being so cluttered that it becomes confusing. They also make it easy to focus on one stack at a time or move data as needed.
The horizontally stacked chart below is an example of how I’d typically present multiple data sources in a content strategy meeting. The chart displays multiple marketing channels (i.e., email vs. paid) as well as how different lead capture methods performed across each channel.
The crux? You can quickly compare how marketing channels perform against each other across multiple pieces of content marketing. I use this chart to gain a broad view of marketing campaigns and their individual results.

Pro tip: Hey HubSpot user! You can access stacked bar charts using the custom report builder. Head to “horizontal bar chart.”
You can also use these charts to:
- Show the frequency of survey responses.
- Identify outliers in historical data.
- Compare a part of a strategy to its overall performance.
Design Best Practices for Stacked Bar Charts
- Best used to illustrate part-to-whole relationships.
- Use contrasting colors for greater clarity.
- Make the chart scale large enough to view group sizes in relation to one another.
4. Mekko Chart
Also known as a Marimekko chart, I generally use this type of chart to compare values, measure the composition of each, and display data distribution across them.
Mekko charts aren’t the most widely used. I’d put that down to folks viewing them as needing more effort to understand. However, I’d push back on that criticism and recommend viewing Mekko charts as similar to stacked bars. The difference? The Mekko’s X-axis can capture another dimension of your values — instead of time progression, like column charts often do. For example, in the graphic below, the X-axis compares the cities to one another.
Furthermore, I’d argue that using another chart type would make it more difficult to visualize all the data needed to show how asset managers are distributed globally.

Best Use Cases for This Type of Chart
I personally use Mekko charts to show growth, market share, or competitor analysis.
For example, the Mekko chart above shows the market share of asset managers grouped by location and the value of their assets. This chart clarifies which firms manage the most assets in different areas. It’s also easy to see which asset managers are the largest and how they relate to each other.
As I mentioned earlier, Mekko charts can appear more complex than other types of charts. Yes, we want to make data easy to interpret visually. But sometimes we have complex data that requires a more complex chart. Such is life! The difference maker is how you use each chart type. In the case of the Mekko, I recommend using it in situations where you want to emphasize scale or differences between groups of data.
Other use cases for Mekko charts include:
- Detailed profit and loss statements.
- Revenue by brand and region.
- Product profitability.
- Share of voice by industry or niche.
Design Best Practices for Mekko Charts
- Vary your bar heights if portion size is a key point of comparison.
- Don’t include too many composite values within each bar. Consider reevaluating your presentation if you have a lot of data.
- Order your bars from left to right in such a way that exposes a relevant trend or message.
5. Pie Chart
Remember, a pie chart represents numbers in percentages, and the total sum of all segments must equal 100%.

Best Use Cases for This Type of Chart
The image I’ve shared above shows another example of customers by role in the company.
The bar chart example I shared earlier highlights that there are more individual contributors than any other role. However, this pie chart clearly shows that they account for over 50% of customer roles.
In terms of marketing activities, I use pie charts to visualize the sources of website traffic. These types of pie charts are usually broken down into “Organic,” “Direct,” “Social,” “Referral,” and “Other.”
Pie charts make it easy to see a section in relation to the whole, so they are good for showing:
- Customer personas for all customers.
- Revenue from your most popular products or product types in relation to all product sales.
- Percent of total profit from different store locations.
Design Best Practices for Pie Charts
- Don’t illustrate too many categories to ensure differentiation between slices.
- Ensure that the slice values add up to 100%.
- Order slices according to their size.
6. Scatter Plot Chart
As I mentioned earlier, a scatter plot or scattergram chart illustrates the relationship between two variables. It can also reveal distribution trends.
I recommend using this chart when there are multiple data points and you want to highlight similarities within the dataset. More specifically, I find this useful when looking for outliers or understanding the distribution of the data.

Best Use Cases for This Type of Chart
Marketers, have you ever found yourself in a situation where you have too much data to quickly identify a pattern? If, like me, you answered “YES,” through tear-soaked eyes, you need scatter plots in your life. I love using these charts to illustrate relationships between two large datasets.
In the example above, this chart illustrates the relationship between customer happiness and the time it takes for them to receive a response.
The scatter plot chart below illustrates the relationship between offering larger discounts and profit.
Pro tip: As a HubSpot user, I access this in the custom report builder by selecting “scatter plot” as my chart type.

This type of chart makes it easy to compare two data sets. Other use cases might include:
- Employment and manufacturing output.
- Retail sales and inflation.
- Visitor numbers and outdoor temperature.
- Sales growth and tax laws.
Try to choose two data sets that already have a positive or negative relationship. That said, I would also add that this type of chart makes it easier to see data that falls outside of normal patterns.
Design Best Practices for Scatter Plots
- Include more variables, such as different sizes, to incorporate additional data.
- Start the y-axis at 0 to accurately represent the data.
- If you use trend lines, only use a maximum of two to make your plot easy to understand.
7. Bubble Chart
A bubble chart is similar to a scatter plot in that it can show distribution or relationship. The difference? There is a third data set shown by the size of the bubble or circle.

Best Use Cases for This Type of Chart
In the example above, the number of hours spent online isn’t just compared to the user’s age, like it would be on a scatter plot chart. Instead, bubble charts go one step further. In the chart I shared above, you can also see how the sex of the user impacts time spent online.
That said, I recommend bubble charts if you need to see the rise or fall of trends over time. It also allows you to add another option when trying to understand the relationships between different segments or categories.
For example, if I wanted to launch a new product, I might use this chart to quickly assess the new product’s cost, risk, and value. I could then focus my energies on a low-risk new product with a high potential return.
You can also use bubble charts for:
- Top sales by month and location.
- Customer satisfaction surveys.
- Store performance tracking.
- Marketing campaign reviews.
Design Best Practices for Bubble Charts
- Scale bubbles according to area, not diameter.
- Make sure labels are clear and visible.
- Use circular shapes only.
8. Waterfall Chart
I use a waterfall chart to illustrate how an initial value changes in response to intermediate values — either positive or negative — and ultimately results in a final value.
In short, I will use this chart to reveal the composition of a number. To showcase how different departments influence overall company revenue and lead to a specific profit number, for example.

Best Use Cases for This Type of Chart
As a marketer, I love waterfall charts. That’s because they make it easier to understand how internal and external factors impact a product or campaign as a whole.
In the example above, the chart progresses from the starting balance on the left to the ending balance on the right. Factors in the center include deposits, transfers in and out, and bank fees.
A waterfall chart works great for an example like this, as it offers a quick visual. This makes complex processes and outcomes easier to see and troubleshoot. Another example is a SaaS company measuring customer churn. I suggest this format to visualize changes in new, current, and free trial users or changes by user segment.
You may also want to try a waterfall chart to show:
- Changes in revenue or profit over time.
- Inventory audits.
- Employee staffing reviews.
Design Best Practices for Waterfall Charts
- Use contrasting colors to highlight differences in data sets.
- Choose warm colors to indicate increases and cool colors to indicate decreases.
Free Excel Graph Templates
Tired of struggling with spreadsheets? These free Microsoft Excel Graph Generator Templates can help.
- Simple, customizable graph designs.
- Data visualization tips & instructions.
- Templates for two, three, four, and five-variable graph templates.
Download Free
All fields are required.
Form not available
9. Funnel Chart
A funnel chart illustrates a series of steps and the corresponding completion rates for each step. I recommend using this type of chart when tracking the sales process. As for the next suggestion, it will come as no surprise to the marketers among you. You can also use this chart to track the conversion rate across multiple pages or steps.

Best Use Cases for This Type of Chart
As I mentioned earlier, the most common use case for a funnel chart is to illustrate a marketing or sales funnel. For example, I will use this chart to help me create content that targets prospects at different stages of the sales funnel, i.e., to help guide them through the buyer’s journey.
Still, there are many other ways to use this versatile chart.
If you have at least four stages of sequential data, this chart can help you easily see what inputs or outputs impact the final results. For example, I will use a funnel chart to help me identify areas for improvement in a buyer journey or shopping cart workflow. I do this because it can help pinpoint major drop-off points.
Furthermore, as illustrated in the example above, a funnel chart makes it easy to visualize the ratio of impressions to clicks, the source of those clicks, and the actions taken by site users.
Other options for these types of charts include:
- Deal pipelines.
- Conversion and retention analysis.
- Bottlenecks in manufacturing and other multi-step processes.
- Marketing campaign performance.
- Website conversion tracking.
Design Best Practices for Funnel Charts
- Scale the size of each section to accurately reflect the size of the data set.
- Use contrasting colors or one color in graduated hues, from darkest to lightest, as the size of the funnel decreases.
10. Heat Map
I suggest using a heat map to show the relationship between two items and provide rating information. That could be information such as high to low or poor to excellent. The rating information is displayed on the chart via varying colors or saturation.

Best Use Cases for This Type of Chart
In the example I’ve shared above, you can see that the darker the shade of green shows where the majority of people agree.
I really like heat maps because with enough data, they can make a viewpoint that might seem subjective more concrete. In practical terms, this makes it significantly easier for a business to act on customer sentiment. I also like heat maps because they allow you to quickly spot outliers in data.
There are many uses for these types of charts. I’ve worked with multiple tech companies that use heat map tools to gauge user experience for apps, online tools, and website design.
And while it’s not in chart format per se, I really love how Ben Goodey, the founder of Spicy Margarita Content, recommends using heat mapping to record user sessions as part of your content monitoring process.
According to Goodey, “It’s incredibly insightful to watch a visitor navigate your content and will likely change how you approach content creation in the future.” I think this shows how heat mapping, in general, can help you visualize user data and make more informed decisions.
Another common use for heat map charts is location assessment. If you’re looking for the ideal location for your new store, these maps can give you an idea of what the area is like in ways that a visit can’t convey.
I also love using heat maps to help identify patterns — in the example from Ben Goodey above, this could mean spotting trends in web user behavior. More specifically, they’re well-suited for analyzing trends that change rapidly, such as ad conversions. They can also help with:
- Competitor research.
- Customer sentiment.
- Sales outreach.
- Campaign impact.
- Customer demographics.
Design Best Practices for Heat Maps
- Use a basic and clear map outline to avoid being distracted from the data.
- Use a single color in varying shades to show changes in data.
- Avoid using multiple patterns.
11. Gantt Chart
The Gantt chart is a horizontal chart that maps the completion of different tasks over a specified period of time.
Fun data factoid alert: The Gantt chart dates back to 1917. Cut to 2025, and it’s still as relevant as ever.

If, like me, you’ve project managed before, then you’ll know that you have a ton of plates spinning at any one time. Add managing resources alongside tasks to a project, and it becomes ever more complex.
That’s why I cannot overstate this: Gantt charting is one of the most important tools for project managers. That’s because it brings all the completed and uncompleted tasks into one place and tracks the progress of each.
While the left side of the chart displays all the tasks, the right side shows the progress and schedule for each.
This chart type allows you to:
- Break projects into tasks.
- Track the start and end of the tasks.
- Set important events, meetings, and announcements.
- Assign tasks to the team and to individual team members.
Best Use Cases for This Type of Chart
Gantt charts are ideal for analyzing, roadmapping, and monitoring progress over a specified period. The chart example I’ve shared above divides the different tasks involved in product creation. As you can see, each of these tasks has a timeline that can be mapped on the calendar view.
From the vision and strategy to the seed funding round, the Gantt chart helps project management teams build long-term strategies. The best part? You can bring the stakeholders, project team, and managers to a single source of data.
Given the above, I cannot recommend Gantt charting enough for agencies, specifically.
Project management in general = spinning plates.
Project management in an agency setting = spinning plates across multiple clients, who sometimes have multiple projects each.
It can be a real hair-puller.
I’ve previously written about my preferred project management process for agencies. I break this down into nine stages, and I highly recommend using a Gantt chart to document both the planning and monitoring and control steps in the process. The former provides a clear road map of the project for everyone involved. The latter helps you track progress and identify blockers that could cause delays.
Pro tip: Look for a project management software that includes Gantt charting. This will prevent you from having a gazillion data sources and spreadsheets all over the place. If I can say one thing about project management, everyone really needs to be singing from the same hymn sheet — aka working from a single data source.
You can use Gantt charts in various tasks, including:
- Tracking employee records as a human resource.
- Tracking sales leads in a sales process.
- Plan and track construction work.
Design Best Practices for Gantt Charts
- Use the same colors for a similar group of activities.
- Make sure to label the task dependencies to map project start and completion.
- Use light colors that align with the texts and grids of the chart.
12. Treemap
A treemap is a chart that represents hierarchical data in, you guessed it, a tree-like diagram. As evident from the name, treemaps have data organized as branches and sub-branches.
The data in the chart is nested in the form of rectangles and sub-rectangles. Each of these rectangles and sub-rectangles has different dimensions and plot colors which are assigned w.r.t to the quantitative data.

Best Use Cases for This Type of Chart
If you need to compare different products within a category or subcategory, I think treemap charts are ideal. Looking at the above example, the products are divided by revenue.
In this case, the four parent categories are Fruits, Vegetables, Dairy, and Meat. This is followed by subsequent sub-categories or sub-products. The dimensions of these rectangles are in proportion to their numerical quantity and other rectangles in the same category.
The colors of these rectangles are plotted as per the revenue generated. I find treemap charts most helpful when differentiating between products that belong to the same group but are divided into separate sub-groups.
One thing I will say is that if you have too many categories and subcategories, treemaps can be tricky to understand. However, I’d argue that this is the same for any chart that needs to display complex data.
This form of mapping chart is best used:
- When there are hundreds of categories and even deeper layers of sub-categories. For example, Total votes cast w.r.t. States.
- To study the data with respect to only two quantitative values.
- To compare the performance of products and identify similarities and anomalies within a single or multiple categories.
Design Best Practices for Treemaps
- Use contrasting and bright colors to highlight differences between sub-categories.
- Organize the rectangles in order of larger area to smaller in size (i.e., from top to bottom).
- Mark down each rectangle with text or numbers to make it easy to read.
13. Donut Chart
A donut chart functions the same as a pie chart. The difference is that many folks prefer a donut over a pie chart because the missing center makes the difference in data quantities more apparent. (I mean, really, asking us to choose between donuts and pie, in this, the year 2025?!)
Anywho, some folks might find pie charts a little more confusing at first glance because the human eye might not be able to discern the difference in size between each slice. On the other hand, donut charts force your eye to look at the length of the perimeter, making it easier to discern size.

Download our FREE Excel Graph Templates for this graph and more!
Best Use Cases for This Type of Chart
I generally use donut charts for the same use cases as pie charts. Still, I tend to prefer the former because of the added benefit that the data is easier to read. Another benefit of donut charts is that the empty center leaves room for extra layers of data, as seen in the example above.
With all this talk of layers, centers, and donuts, is anyone else hungry? Just me… okay then.
Design Best Practices for Donut Charts
Use varying colors to better differentiate the data being displayed.
Pro tip: Make sure the colors are in the same palette so viewers aren’t put off by clashing hues.
14. Sankey Diagram
A Sankey diagram visually represents the flow of data between categories, with the link width reflecting the amount of flow. It’s a powerful tool for uncovering the stories hidden in your data. As data grows more complex, charts must evolve to handle these intricate relationships. Sankey diagrams excel at this task.
That said, this is probably my least favorite chart. I just don’t like the way the chart looks, and it makes it harder for my brain to decipher what the data is telling me. But that is purely subjective! There is definitely a time and a place for Sankey diagrams.

You can get external tools to help you create Sankey charts. Some even offer up to eight levels that provide multiple perspectives for analyzing your data. Many also allow you to customize your Sankey charts and every component, including nodes, links, stats, text, colors, and more.
I think to make the Sankey chart work, you do need a tool that makes even the most complicated data sets manageable and easy to interpret. Otherwise, you’re looking at a lot of data without that much control over how it’s presented. I know, I know, can’t you say that for any chart? Yes, but look at the diagram above, people. Its Facebook relationship status is set to “it’s complicated.”
Best Use Cases for This Type of Chart
I would personally avoid these diagrams (as I said above, this is purely subjective.) But if you were to use a Sankey diagram, I’d recommend using it to visualize all types of data that contain a flow of information. It beautifully connects the flows and presents the data in an optimum way.
Here are a few use cases:
- Sankey diagrams are widely used to visualize energy production, consumption, and distribution. They help track how energy flows from one source (such as oil or gas) to various uses (heating, electricity, transportation).
- I’ve also seen businesses use Sankey diagrams to track customer interactions across various channels and touchpoints. It highlights the flow of users through a funnel or process, revealing drop-off points and success paths.
- In supply chain management, these diagrams illustrate the flow of resources, products, or information between suppliers, manufacturers, and retailers, identifying bottlenecks and inefficiencies.
Design Best Practices for Sankey Diagrams
When using a Sankey diagram, aim to maintain simplicity while focusing on accuracy in proportions. Clear labeling and thoughtful color usage are also key factors to consider. Plus, I suggest emphasizing the logical flow direction and highlighting significant flows to enhance the visualization.
How to Choose the Right Chart or Graph for Your Data
Anyone who’s been in marketing for a hot minute — especially in a role that involves reporting — will testify that data visualizing can get messy. If, like me, you run campaigns across multiple marketing channels and clients, then you know that it also means working with multiple data sources.
To top it off, each marketing channel has its own little quirks. For example, you might be using WordPress’s built-in analytics to visualize blog traffic. Or maybe, like me, you prefer the level of detail that Google Analytics 4 (GA4) gives you regarding revenue generated from organic efforts.
That’s not to mention social media, where each channel has its own set of data. Then, further still, you might use a social scheduler which ALSO offers data insights.
I won’t lie, when I first started as a baby marketer, I found managing all these complex content assets overwhelming. Maybe you’re also asking the same questions I did.
What should I be tracking?
What matters most?
How do I visualize and analyze the data so I can extract insights and actionable information? Well, let me take you by the hand, friend, and walk you through it.

1. Identify your goals for presenting the data.
Before creating any data-based graphics, I ask myself: Do I want to convince or clarify a point? Am I trying to visualize data that helped me solve a problem? Or am I trying to communicate a change that’s happening?
If I’m trying to convince, I might use something like a pie or donut chart. I might use either chart to show stakeholders why we should be more invested in one content channel over another, for example. That’s because I can use the trusty pie or donut chart to highlight at a glance which channel has generated the most [insert chosen metric that moves us closer to business objectives here.]
If I’m trying to communicate a change that’s happening, well, that depends on the specific change. For tasks such as communicating a weekly schedule change or reallocating work between team members, I’ll use the Gantt chart. If I’m trying to show an internal change in marketing or sales trends over time, well, it’d likely be time to break out the bar graph.
Either way, a chart or graph can help compare different values, understand how different parts impact the whole, or analyze trends. Charts and graphs can also be useful for recognizing data that veers away from what you’re used to or help you see relationships between groups.
So, clarify your goals, then use them to guide your chart selection.
Free Excel Graph Templates
Tired of struggling with spreadsheets? These free Microsoft Excel Graph Generator Templates can help.
- Simple, customizable graph designs.
- Data visualization tips & instructions.
- Templates for two, three, four, and five-variable graph templates.
Download Free
All fields are required.
Form not available
2. Figure out what data you need to achieve your goal.
As I’ve covered throughout this article, different types of charts and graphs use different kinds of data. On the one hand, graphs typically represent numerical data. On the other hand, charts are visual representations of data, and they don’t have to use numbers.
So, while all graphs are a type of chart, not all charts are graphs. (I know, I know, if your brain is hurting, you’re not alone, mine is too.)
That means if your goal is something like “to better understand customer experiences,” then you might want to gather qualitative data. This would involve running customer interviews that investigate the experiences, feelings, and behaviors of folks who use your products or services.
If your goal is something like “to show the growth of a metric over time,” you’ll need quantitative data. For example, data on website traffic from GA4 or Google Search Console (GSC).
The crux? If you don’t already have the kind of data you need to meet your goal, spend some time collating your data before building your chart … enter step three.
3. Gather your data.
In my experience, most businesses collect numerical data on a regular basis. However, you may need to put in extra time to collect the right data for your specific chart or graph.
Besides quantitative data tools that measure traffic, revenue, and other user metrics, you may also need some qualitative data. This isn’t true for every business, but I have noticed that quantitative data is often more difficult to obtain. Maybe this is because there is such an emphasis on the cold, hard facts that numbers are perceived to show. As they say, the numbers don’t lie, or at least, we think they don’t.
But I am a firm believer that people’s experiences (including your customers) don’t lie either.
Long story short? Alongside a little extra time, you may need to put in a little extra persuasion power to gain clearance to spend time on qualitative data collection. Furthermore, you’ll likely need to invest some effort in creating resources to capture this data as well. (Believe it or not, some businesses still don’t have customer interview templates or similar!)
I’m a big fan of gathering the following for data visualization:
- Interviews.
- Quizzes and surveys.
- Customer reviews.
- Reviewing customer documents and records.
- Community boards.
4. Select the right type of graph or chart.
Choosing the wrong visual aid or defaulting to the most common type of data visualization could confuse your viewer or lead to mistaken data interpretation. Additionally, a chart is only useful to you and your business if it clearly and effectively conveys your point.
So yes, I am biased, but here’s my biggest pro tip: I really recommend going back through the different use cases that I’ve outlined against each of the graphs and charts above. You might find a hidden gem of a chart type that will catch a client’s eye, or you might avoid a data visualization disaster.
Once you’re done that, I also recommend asking yourself the questions below to help find the right chart or graph type.
Download the Excel templates mentioned in the video here.
5 Questions to Ask When Deciding Which Type of Chart to Use

1. Do you want to compare values?
Charts and graphs are perfect for comparing one or many value sets, and they can easily show the low and high values in the data sets. To create a comparison chart, use these types of graphs:
- Column
- Mekko
- Bar
- Pie
- Line
- Scatter plot
- Bullet
2. Do you want to show the composition of something?
Use this type of chart to show how individual parts make up the whole of something, like the device type used for mobile visitors to your website or total sales broken down by sales rep.
To show composition, use these charts:
- Pie
- Stacked bar
- Mekko
- Area
- Waterfall
3. Do you want to understand the distribution of your data?
Distribution charts help you to understand outliers, the normal tendency, and the range of information in your values.
Use these charts to show distribution:
- Scatter plot
- Mekko
- Line
- Column
- Bar
4. Are you interested in analyzing trends in your data set?
If you want more information about how a data set performed during a specific time, there are specific chart types that do extremely well.
You should choose one of the following:
- Line
- Dual-axis line
- Column
5. Do you want to better understand the relationship between value sets?
Relationship charts can show how one variable relates to one or many different variables. You could use this to show how something positively affects, has no effect, or negatively affects another variable.
When trying to establish the relationship between things, use these charts:
- Scatter plot
- Bubble
- Line
Put these new types of charts and graphs into action.
Whether you’re using data to persuade, solve a problem, or communicate a business change, how you present your data matters. In my experience, not everyone in a quarterly meeting will understand the ins and outs of the work you do — whether that’s marketing, sales, service, or something else. However, some of the uninitiated in the room may also be key decision-makers. That means you need to visualize your data in a way that anyone could quickly understand.
Hopefully, the information I’ve shared above, alongside my personal experiences, has helped you think along the right lines. So, use bar graphs to show data changes over time. Scatter plot charts to show the relationship between two different variables. And Gantt charts (also known as the Project Manager’s best friend) to map different tasks completed over a period of time. (Those are just three of the EIGHTEEN examples in total, phew!)
Now, the next step is for you to experiment with the best graphs or charts for your project. They don’t need to be fancy. First, focus on a data visualization resource that clearly and visually conveys your point. If you nail that, then you might consider adding a little more razzle-dazzle to your business reports and presentations.
Editor's note: This post was originally published in November 2020 and has been updated for comprehensiveness.
Free Excel Graph Templates
Tired of struggling with spreadsheets? These free Microsoft Excel Graph Generator Templates can help.
- Simple, customizable graph designs.
- Data visualization tips & instructions.
- Templates for two, three, four, and five-variable graph templates.
Download Free
All fields are required.
Form not available
Data & Analytics

-Dec-04-2025-05-17-34-7864-PM.webp)


![What is a marketing plan & how to write one [+ examples]](https://53.fs1.hubspotusercontent-na1.net/hubfs/53/marketing-strategy-examples-1-20240801-4880441-1.webp)