 The Web has been overrun by infographics, or that’s what it sometimes seems like as you scroll through your favorite blogs and social media sites. Infographics can be a dynamic way to deliver information. They offer great ways to illustrate points that can get lost in a block of text, and some graphic artists can render incredibly striking images despite the rather limited canvas. But truth be told, there can be too much of a good thing, as Rand Fishkin, the face of Moz, pointed out in a very insightful Whiteboard Friday video not too long ago.
His point: Infographics have become the Parmesan cheese to the Internet’s spaghetti. People seem to believe that they can add as much as they want and still come out with a great product. However, infographics, like Parmesan, should be used sparingly lest you overwhelm the main dish. Marketers are very busy pushing others to embed and share the infographics. This may also lead to a subpar execution of the information.
A much better way to use illustrations is to employ visual assets — photos, charts, visual representations of concepts, comics or annotated screenshots used to make a point. Visual assets complement a story rather than telling the story entirely like an infographic does. Fishkin lays out some sound reasoning for making the switch to visual assets. Still, there are some cases where an infographic is still the best choice. Here’s a look at the pros and cons of using visual assets instead of infographics.
Pro: Keep It Focused
Many infographics are so long that by the time you get to the end, you’ve forgotten what you’re reading about. They lack the focus of a compelling long-form story. One advantage to visual assets is that they are shorter, and thus by nature more targeted to the content you’re providing. One example might be a picture of a relevant person, place or thing, which adds a personal touch to a story without spiraling into dozens of irrelevant facts. Another might be a simple diagram explaining how two things relate to one another.
Con: Limited Scope
Of course, “focused” can also be a euphemism for “limited.” Showing a few pictures does not have the same visual impact as conveying the point behind a statistic. For example, one popular infographic tool has become showing just how many 1 in 100 (or 1 percent) is by showing 100 of something and then putting one of them in a contrasting color. No matter how many times it’s repeated, this is a visually arresting gimmick. It can be one of many in an infographic, whereas visual assets are limited to making one point at a time.
Pro: More Link Opportunities
Most visual assets can be linked to individually. That aspect of visual assets offers a lot of opportunities for linking back. It allows for a few per page as opposed to just one per page for most infographics.
Con: Fewer Embeds
One reason why infographics have become so popular is because they are so easy to embed on other pages. You simply grab the code, slap it on the new page and voilà: instant share. That’s not so easy to do with visual assets. Individually embedding them is a pain, and they don’t usually do well as standalones without an explanation. They then fail to convey the full story because they’re really only one component of the point that’s being made. Therefore, it doesn’t make much sense to embed them.
Pro: Better Quality
Since infographics became so popular, there’s been a definite decline in the quality of work being offered. People are so eager to grab traffic from infographics that they don’t put the time and effort into making them really good. This isn’t usually the case with visual assets. They are smaller and thus easier to seek out and incorporate into a post. In the case of charts or smaller graphics, they don’t take nearly as much time to put together as a full infographic. There are also a lot of great ways to produce them for free.
Con: Less Visual Engagement
There’s no denying that an infographic really draws the reader in with its diverse content: different fonts, varying sizes and illustrations just to name a few. They attract the readers’ eyes and allow them to take in all of the information that’s been packed into the graphic. That’s certainly a disadvantage for visual assets. They’re simply not as visually appealing on their own because they usually illustrate one point instead of multiple points. Even if you have a multitude of visual assets on one page, they don’t have the same cumulative effect as an infographic. They don’t draw the eye in as smoothly as infographics do.
Pro: Fewer of Them
When something becomes so ubiquitous on the web, it’s easy to overlook and ignore. That’s what’s happening with infographics. They’re so common that many people look right past them when a link marked “infographic” pops up on their newsfeed. They know that at worst it’s link bait or at best it’s warmed-over information provided in a new format. Visual assets don’t carry the same baggage. They’re not the focus of the post, but rather used to enhance the ideas that are already there. They don’t have to carry as much of a load.
Pro: Easier to Produce
Making a good infographic is very time-consuming. From the idea and research stage to the illustration stage to the proofreading and marketing, an infographic may have dozens of man hours behind it, whereas the same information can be conveyed with just a couple hundred words and a picture if you’re using visual assets.
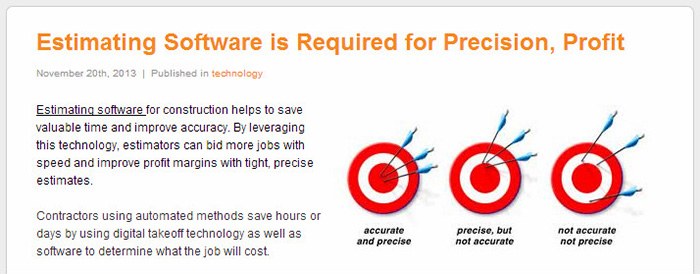 Overall, visual assets have a lot of things going for them, but they can have just as many downsides. They are very effective at getting across a specific idea, but on their own they probably would not inspire someone to share a post. Consider this post on Maxwell Systems’ blog, Construction Biz Wiz. The visual asset is very simple: three targets showing different combinations of precision and accuracy using arrows. These two words taken on their own can be a little hard to understand, but with this image, the concept becomes clear as day. It’s essential to the post. At the same time, no one could be expected to share this post because of an image of different arrangements of arrows on targets — it makes no sense on its own. This is great, but the visual asset serves the blog post alone. It would not make sense taken out of context and embedded elsewhere.
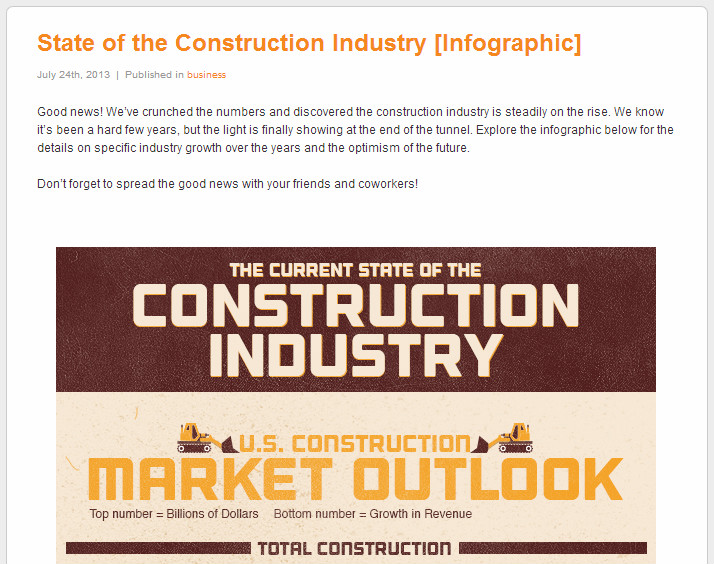 In contrast, consider an infographic Maxwell Systems produced in July, The Current State of the Construction Industry. This infographic examines different types of construction and their revenue and growth over recent years. Because it is tightly focused around this topic and self-contained, it is easy to share, and the graphic found reasonable success within its highly specialized niche. However, note that the infographic makes up almost the entire post, being introduced by a single paragraph — besides the image, there is not much substance to the blog post.
Obviously, infographics and visual assets work best in different situations. Before you decide what to use, consider the following questions. Is there enough visualizable data to create a full infographic? Is it something interesting enough in general or to a niche that someone would want to embed on their own site instead of simply sharing it on social media? Or is it a highly technical topic that would best serve your visitors by being mainly text with a few explanatory images? Finally, what does your budget allow for?
Where do you stand in the infographics vs. visual assets battle? Have you taken advantage of both forms of content? Share your thoughts in the comments below!
Visual Content