Sales Hub has a lot of features to help you build a sales forecast, including a dedicated forecasting tool. But the quality of your sales forecast depends entirely upon the quality of the data in your CRM. Use these six reports to check the quality of your sales data and find places to make improvements.

Start Simple With the Deal Forecast
The standard, default forecast inside Sales Hub is the deal forecast. To use it, select the time period you’re interested in (a month, quarter, or year). It looks at all the deals with close dates in that period and does a little math to predict how much revenue you’ll get from those deals.
Here’s how it works: Every deal stage in your pipeline has a “win probability” percentage. For example, a stage near the end of your sales process like “Contract Sent” might have a win probability of 90%, while a stage near the beginning of your process like “Appointment Scheduled” might have a probability of 10%. The weighted pipeline forecast report takes each deal’s amount and multiplies it by the win probability of the deal stage the deal is in. So a $100 deal with a 60% probability of closing will be counted as $60, while a $100 deal with a 75% probability will be counted as $75. Deals that have already been won are counted at full value. These adjusted values all get added together, and there’s your weighted forecast.
 This is a good place to start with forecasting in Sales Hub. Generating this report doesn’t require any work from you or your reps, and it’s usually pretty accurate — if your deal stage probabilities are accurate.
How can you tell if they’re accurate? Glad you asked. There’s another report that will help with that.
Set Your Deal Stage Probabilities With the Deal Funnel Report
To make your deal stage probabilities accurate enough to generate a good forecast, there are two steps you need to take. First, you need to make sure your deal stages represent the most important milestones in your sales process. If you have any doubts about that, check out this blog post that walks through the process. Once you’ve done that, you can use the deal funnel report to fine tune your deal stage probabilities.
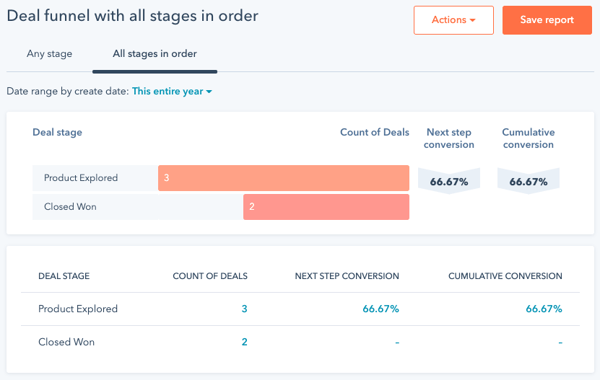
The deal funnel report shows the conversion rate between each stage in your pipeline. That’s nice, but what we really need to see is what percentage of deals in each stage are eventually won. Luckily, you can filter this report to see the conversion rate between any two stages. So you can select any deal stage and Closed Won to see what percentage of the deals that enter that stage have eventually been won.
If you’ve designed your sales pipeline well, that conversion rate will hold fairly stable. So if you use that conversion rate as the deal stage’s win probability, you’ll get a pretty good forecast — if the deals in your pipeline represent real business opportunities and not just the hopes of your sales team.
How can you tell the difference? By using a clever combination of workflow automation and Sales Hub reports.
Two Reports That Identify Stale Deals
Good pipeline hygiene is a hard thing to maintain. It’s natural for salespeople to focus on their most promising opportunities — deals that lose momentum can sometimes get forgotten. To prevent these deals from cluttering up your pipeline and throwing off your reports, you need to put systems in place to call attention to them.
One way to do that is to create a Stale Deals workflow. This is a deal-based workflow that assigns a task to the deal owner and to the sales manager anytime a deal gets stuck partway through the pipeline. The intention, here, isn’t to get anyone in trouble but to make sure these deals get the attention they need. If a deal hasn’t been updated in a while, either the rep needs to move it to Closed Lost, or the manager needs to coach the rep through whatever complications they’re facing. Automatic tasks can help these actions happen sooner rather than later.
But how does the workflow know when a deal is stale? There are probably a lot of ways you could define a stale deal, but here are three especially good indications:
Close Date in the Past
First, if the close date is in the past and the deal is still open, something is clearly wrong. So having our Stale Deal workflow assign tasks anytime an open deal passes its projected close date is a great plan.
Longer-Than-Average Time in a Deal Stage
Second, if a deal has been in a particular deal stage longer than average, it’s probably a good idea for the rep and manager to discuss what’s going on. So we could have our Stale Deal workflow assign tasks when a deal’s stage hasn’t been updated after a certain number of days — but how many days? Well, that will vary from one pipeline to the next, and that’s why Sales Hub has a "time spent in deal stage" report.
 The time spent in deal stage report shows the average number of days deals spent in each deal stage during the selected time range. Look at this for whatever time range makes the most sense for your sales cycle and see what the numbers say. You might pick the stage with the biggest average and use that as a baseline. Remember, the nature of an average is that some deals will spend more time and some deals will spend less time than the number you see in the report — you might want to round up a little in your workflow triggers. Or, you may want to notify people as soon as a deal passes that average. Decide what you think will be most helpful for your team and go with that.
Open Longer Than Expected
The third indication a deal might be stale is if it’s been open for longer than you’d typically expect a deal to be open. Maybe its close date is still in the future, and maybe it hasn’t been in its current stage for all that long, but it was created so long ago that it’s now outside of the normal length of your sales cycle. To include these deals in your workflow, you’d enroll deals whose create date is more than a certain number of days in the past — and there’s a report that will tell you how many days that is. The deal velocity report will show you the average number of days from create date to close date for deals that are won and deals that are closed.
 For our Stale Deal workflow, we’re interested in the average amount of time won deals are open. It isn’t unusual for lost deals to stay open longer because sales reps, whose livelihood depends on an optimistic outlook on life, often hold on to deals much longer than they should. So if a deal has been open longer than the average won deal, there’s an ever increasing likelihood that that deal will ultimately be lost. Having a workflow that automatically assigns tasks when a deal has been open longer than the average won deal is a good way to identify deals that are in trouble.
Using these reports and a little bit of automation not only ensures you’ll have a more accurate forecast, but it increases the opportunities for sales managers to coach their reps, which could ultimately lead to deals being won.
Use Deal Push Rate to Coach Your Reps
Stale deals aren’t the only thing throwing off your forecast. Pushed deals also cause trouble. A pushed deal is one that your team thought would close last month, but now they’re saying it’ll close this month. (Or, if you go by quarters, they thought it would close last quarter, but now it’s scheduled to close this quarter.) Whereas a stale deal might just be forgotten, pushed deals are being actively held onto by their owners. This is a great opportunity for sales managers to get some coaching in.
How do you identify pushed deals? With the Deal Push Rate report. This report shows how many deals each salesperson has pushed from one period to the next.
 You can click into each bar of the report to see a list of individual deals, a great agenda for your next meeting with that salesperson.
Go Deep With a Manual Forecast
If you use the reports we’ve covered so far, your weighted pipeline forecast will give you a pretty good idea of what your revenue will be like at the end of this period, but you can go deeper with the forecasting tool inside Sales Hub.
The forecasting tool gives you a forecast for each paid Sales Hub user in your account, and it breaks that forecast into three categories: commit, best case, and pipeline.
Commit is the most conservative forecast and only looks at the deals that are almost certain to close.
Best case includes all of the deals in the commit category as well as some other deals that are expected to close, if everything goes as planned.
Pipeline is the total value of all the deals with close dates in the current period.
 With this report, you can view individual reps to see the deals they’re working on. This is an excellent way to run one-on-one meetings with reps.
 In this view, you can add next steps for each deal. This is stored in a deal property and as the rep works the deal, they can always see what their next step should be and update it as things change.
The amounts you see in the forecasting tool aren’t weighted — these are raw totals of the value of the deals in each category, and the deals are put in those categories based on your team’s confidence in each deal.
How does Sales Hub know how confident your team is about a particular deal? There are two different options, or you can do a hybrid between them.
The simplest way is to assign forecast categories (commit, best case, pipeline) based on deal stage. You can have the forecast tool do this automatically, and it will use the close probability of each stage to assign it to a category. You can also manually adjust the mapping to put specific stages into each category. Either way, this essentially turns the forecast in the forecasting tool into a weighted pipeline forecast, which, as you now know, isn’t a bad way to go.
But if your team’s willing to take a slightly more hands-on approach, you can add another layer of nuance to your forecast that yields more insights than a standard weighted forecast. The trick, here, is to have each rep manually update the forecast category for each of their deals.
Now, you might be thinking, “No way. I don’t want to add any more administrative burdens to my sales team!” and that’s a completely reasonable response. But the reality is that this doesn’t have to mean a lot of extra work for your reps, and there can actually be big benefits for them and your company as a whole. Here’s how:
In your deal pipeline, just like you can set the close probability for each stage, you can also set required properties for each stage. If you do that, then every time a deal moves into that stage, a popup will show up for the rep to fill in the required information. This is a great tool for making sure important information is collected at crucial moments in your sales process. It takes very little effort from your sales team to fill in the properties, and it helps them stay on top of important details.
If you make the forecast category a required property for every stage in your deal pipeline, then every time your reps move a deal forward, they’ll be asked to categorize their forecast confidence. Selecting one of three values from a dropdown takes almost no effort from the rep, and it gives them an opportunity to reflect for a few seconds on how they feel about the deal. On the other end of things, this transforms the forecasting tool into a dashboard that shows each rep’s own assessment of how they’re performing during the current period.
As an added benefit, the standard weighted deal forecast can be filtered by any deal property. This mean, if your reps are updating forecast categories manually, you can filter the report by those categories to create a conservative forecast and a best-case forecast in addition to the standard weighted pipeline forecast.
If you want a hybrid approach between having forecast categories that are tied to deal stages and having forecast categories that are set by reps, you can do that, too. Even when the system automatically assigns forecast categories based on deal stages, your reps can manually overwrite a category in the forecast category property. This way, the weighted forecast is your baseline, but your reps can adjust it based on what they know from interacting with the deal’s stakeholders.
