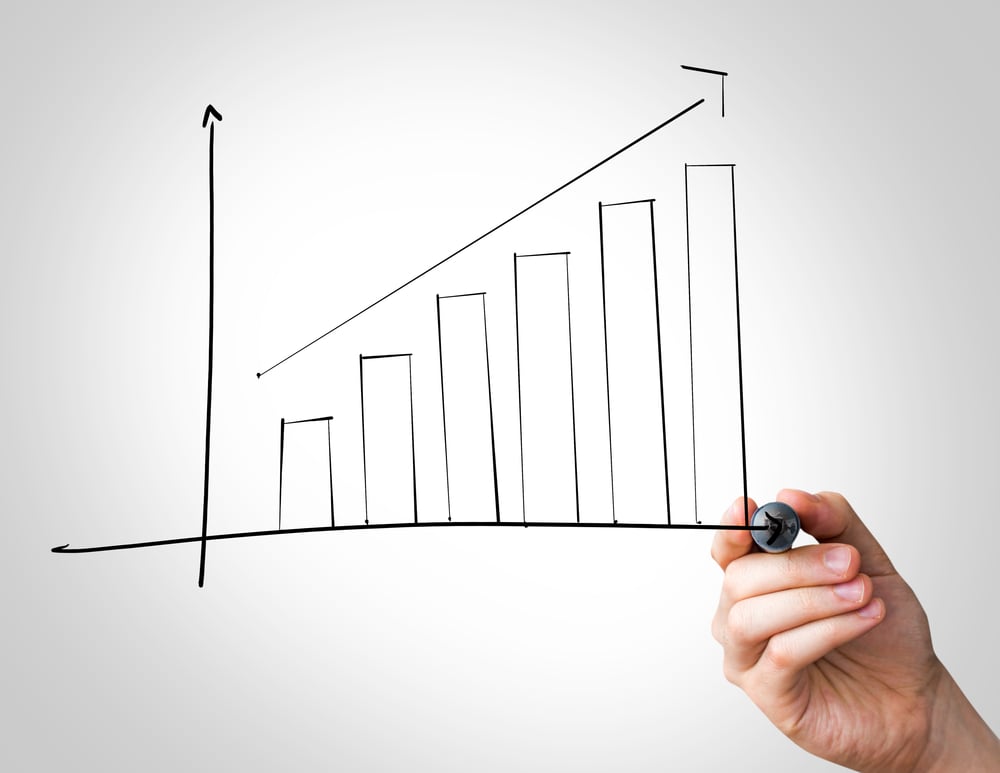
 Your data is only as good as your ability to understand and communicate it. Simply filling out a table with a set of numbers and calling it a day won’t do you or your team much good, particularly in a marketing meeting. You need to be able to understand and effectively communicate the story behind those numbers. Still feeling unsure? Here's three reasons to use data visualization in your next marketing meeting.

Before we get too in the weeds, let's start with a simple question:
What is data visualization?
Data visualization refers to showcasing data, numbers, and statistics through images and charts (similar to those you would see on any of your HubSpot dashboards or in the Reports Library).
When you display data visually, you’ll be able to more easily tease out meaningful patterns from a set of otherwise indecipherable numbers, and it makes it easier to draw conclusions and make informed decisions.

Data visualization is especially helpful when you’re presenting data to others. It’s much easier for people to understand data when it’s presented visually—which makes it easier to make your point or persuade someone, too.
Scientists, for example, can use it to predict illness outbreaks. Farmers can use it to map out agricultural trends. Marketers, by contrast, can use data visualization to showcase the results of campaigns.
So why use it in your marketing meetings in particular?
1. Data visualization adds credibility
Data visualization can help you uncover patterns, correlations, and outliers. As a result, when done correctly, data visualization can help you effectively communicate insights to your boss, your team, or your company in meetings.
It can also demonstrate that your marketing team is continuing to make data-backed decisions. You can also use data to showcase that you are holding your team accountable and ensuring that every member is continuing to execute their initiatives with excellence.
Keep in mind, you want to hold true to your data. If your data is at all misrepresented or presented ineffectively, you and your team will lose out on key insights and understandings—which hurts both your message and your reputation. Not a ideal situation to be in when you're trying to get buy in from key stakeholders.
2. Data visualization encourages audience engagement
Data visualization is especially helpful when you’re presenting data to others. It’s much easier for people to understand data when it’s presented visually—which makes it easier to make your point or persuade someone, too.
Clean, compelling, and credibly sourced visuals draw your audience into the content, encouraging them to explore the data. Both static and interactive data visualizations invite readers to examine the data and to derive the deeper meaning. This fosters a more personal, significant, and active interaction that enhances any type of content.
At the same time, well-designed visualizations do the heavy lifting for your audience. A statistic might be relevant, but simply reading those numbers won’t do the trick. Letting your audience really see the data—and what it means—increases comprehension and retention, making a more lasting impact on your audience.
3. Data visualization increases impact
Well-designed visualizations do the heavy lifting for your audience. A statistic might be relevant, but simply reading those numbers won’t do the trick. That is to say, numbers alone won’t necessarily make the desired impact if your audience can’t interpret them. That’s why data visualization is key.
Letting your audience really see the data—and what it means—increases comprehension and retention, making a more lasting impact on your audience.


