Picture this: You’re ready to publish the first of your many HubSpot landing pages for a product rebrand. All your long work days and endless meetings now culminating in a single click: Update.

But what’s this? An error upon hitting Update?
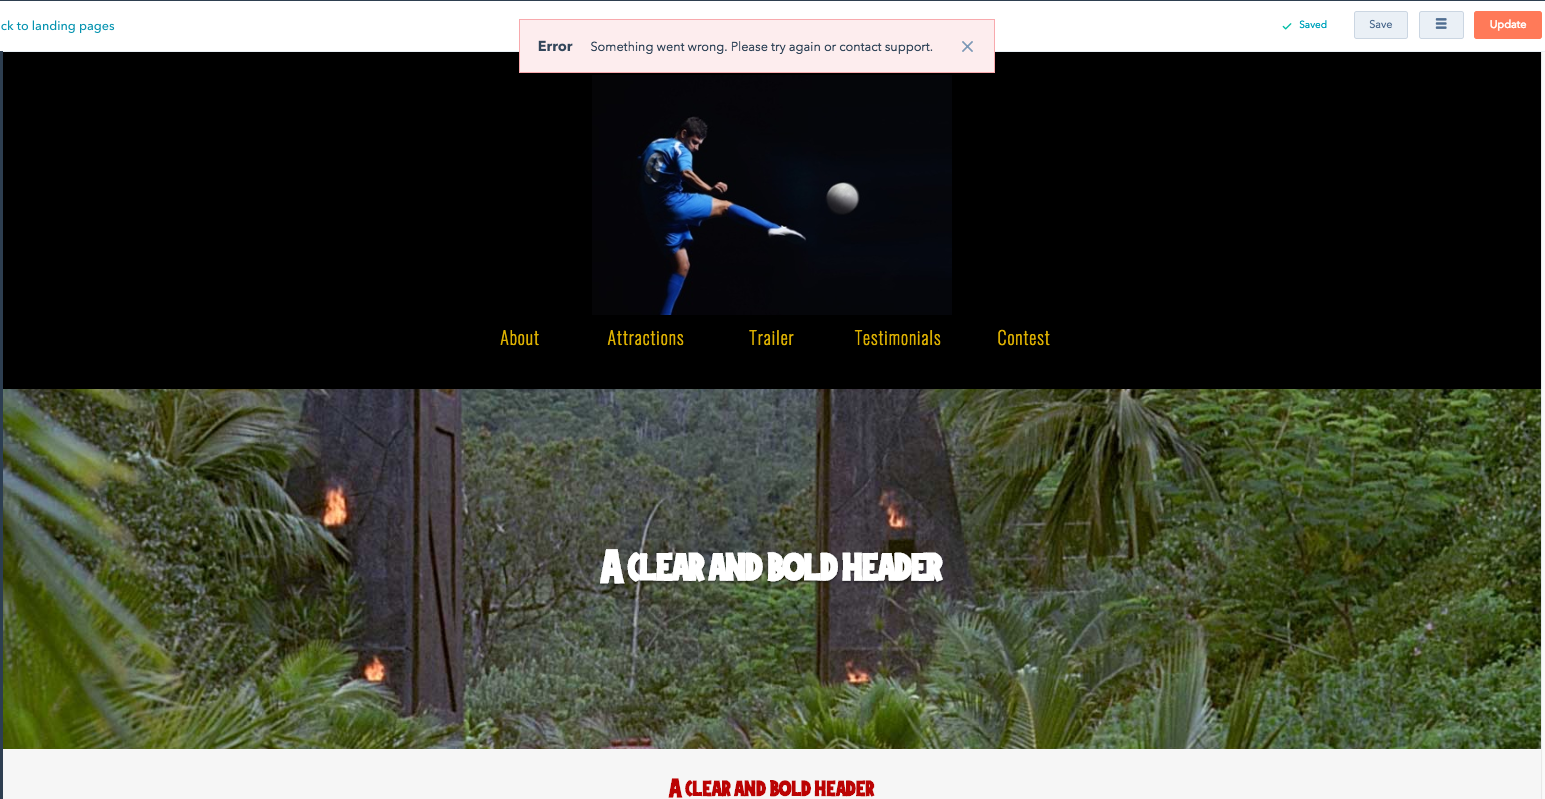
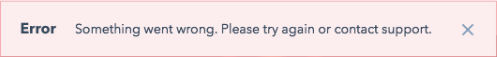
Something went wrong. Please try again or contact support.
Despite trying again, the error message pops back up. It’s 8:30 in the morning, and the page needs to be live by 10. Plus you’re out of coffee. What else could go wrong?
Most of the time, HubSpot gives clear and actionable error messages. But occasionally you’ll still see a vague one.
While HubSpot’s support team is always happy to help in these situations, you can sometimes get a more detailed error message by using the network panel in your browser, which may help you resolve the issue without even needing to pick up the phone. You may even be familiar with this method if you’ve ever checked to make sure your tracking code is firing properly.
Below we’ll walk through the steps of using the browser’s network panel to see what’s causing the issue and then take the steps to resolve it.
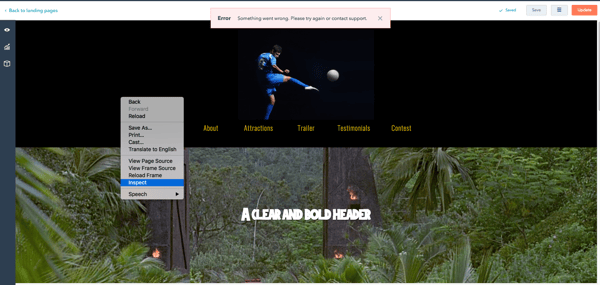
Step 1: Inspect the Page
On the page with the error message, right-click the page and choose Inspect in the dropdown menu.
Step 2: Select the Network Tab
The browser’s network tab is a way to look directly at what’s happening behind the scenes of a page. It shows us not only the type of data being requested and passed as we interact with the page, but it also lets know if there are any actions that are failing. After selecting Inspect, a new window will appear. In this new window, click the Network tab. Then, select the XHR filter option. This will hide everything except API requests.
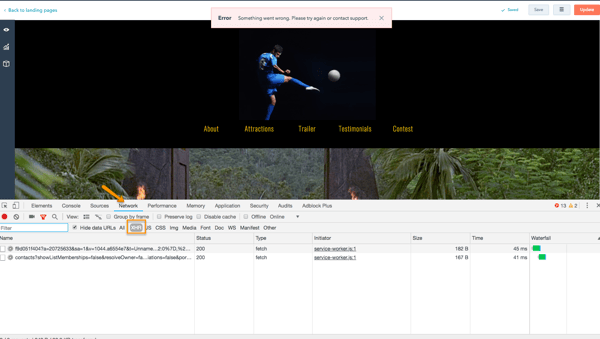
Step 3: Refresh the Page
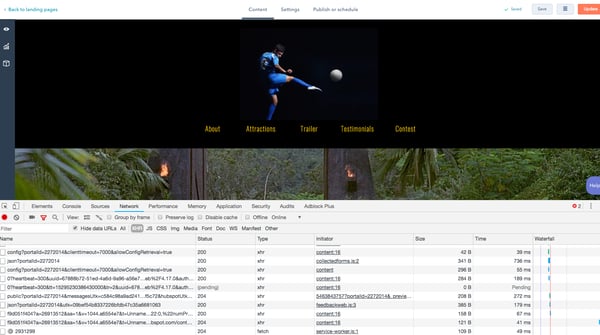
Click the Refresh button in your browser. Since the Network tab will only show us the requests that occur after the tab has been opened, we’ll need to refresh the page so that we can view the error as it occurs. As the page reloads, you’ll see various API requests populate the panel. It should look something like this:
Step 5: Re-create the Error
In order to understand what’s causing our error, we’ll first need to go through the same steps we took to get the error so that we can watch the request happen in real time. In this case, to recreate the error we’ll click Update again. By re-creating the error, we’ll see exactly which request is causing the issue.
Step 6: Find the Red-Line Item in the Network Panel
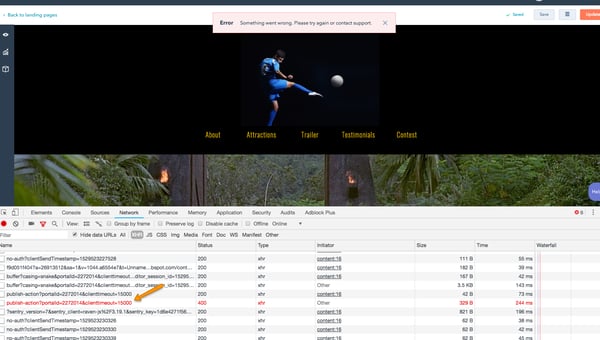
This is the error that occurs when clicking Update in HubSpot. The status is 400, which is the error code for "bad request." Everything else has the status 200, which is the code for "OK," meaning nothing went wrong for those other requests.
Step 7: Preview the Error Details
Click the red-line item to see the error details.
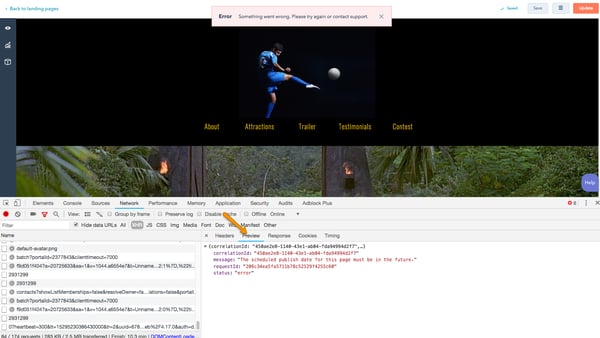
Clicking that line item will open a new frame on the right-hand side, and in this frame you’ll see a few tabs: Headers, Preview, Response, Cookies, and Timing. In this case, stick with Preview since this contains the basic information.
Step 8: View the Error Message
While in some cases you won't see a specific message here, in this case, you’ll see the following:
"The scheduled publish date for this page must be in the future."
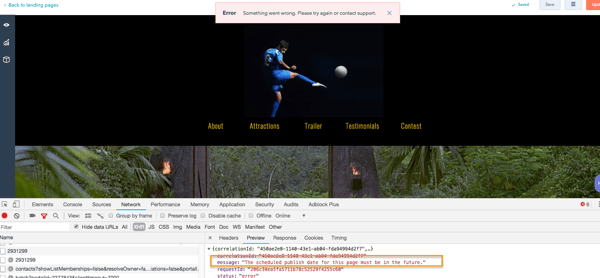
This message gives a clue—it reveals that the publish date for the page is being set incorrectly.
To check the publish date, click the Publish or Schedule tab at the top of the page editor. This is where you can choose whether to publish a page immediately or schedule the publishing for a future time. When scheduling the page, we’ll need to be sure that the scheduled time is not set in the past, since pages can only be published at future times. In my case, this was the source of the error: I had set the scheduled publish time to be in the past. Once I set this to a time in the future, I was able to publish the page.
Phew!
Thanks to the network panel, you were able to take a look under the hood, diagnose the issue, and put a fix in place. What a rush! Your page is now scheduled.
You can use this troubleshooting method not only in HubSpot, but across other apps and websites as well. If you ever run into an error while filling out a form somewhere or while bulk ordering coffee grounds for the office, you now have one more technique in your toolkit to assess the situation.
Want to learn more about the network panel? Check out Google’s documentation here for a deep dive into technical troubleshooting in your browser. Or, see another example of using the network tab on our community post here.

![Troubleshooting Guide for Email Design Issues [Support Series]](https://53.fs1.hubspotusercontent-na1.net/hubfs/53/Hand%20typing%20on%20keyboard%20with%20digital%20tech%20icons%20and%20symbols-1.jpeg)
![3 Service-focused Workflows to Empower Your Support Team [Support Series]](https://53.fs1.hubspotusercontent-na1.net/hubfs/53/service%20button.jpeg)
![How to Add Your Branding to a Marketplace Template [Support Series]](https://53.fs1.hubspotusercontent-na1.net/hubfs/53/Support/Support%20Series%20User%20Blog%20folder%20copy%202.png)
![Creating a Custom Date-Based Property Report [Support Series]](https://53.fs1.hubspotusercontent-na1.net/hubfs/53/Support/HubSpot%20Support%20Series%20Horizontal-603978-edited.png)
![How to Update an Incorrect PDF Title [Support Series]](https://53.fs1.hubspotusercontent-na1.net/hubfs/53/HubSpot%20User%20Blog/Photo%20editors%20using%20laptop%20in%20meeting%20room%20at%20office-1.jpeg)