UX, or user experience, focuses on the end user’s overall experience, including their perceptions, emotions, and responses to a company’s product, system, or service. UX is defined by criteria including: ease of use, accessibility, and convenience. Together, these individual factors contribute to the customer's overall experience.
The concept of UX is most often talked about in terms of tech, such as smartphones, computers, software, and websites. This is why UX is not only a fairly new field, but also a variable one — it changes quickly due to technology advancements, new types of interactions, and user preferences.
It’s no secret that customers today want quick and simple ways to meet their needs and solve their pain points. That’s why UX matters so much.
Whether or not you’re in tech, the company you own or work for most likely has a website. Well, customers could write you off in a matter of seconds if they don’t find your website useful and easy to use. In fact, most website visitors determine whether or not they want to leave within a minute of opening a page.
.png)
Free UX Research Kit + Templates
3 templates for conducting user tests, summarizing your UX research, and presenting your findings.
- User Testing Template
- UX Research Testing Report Template
- UX Research Presentation Template
Download Free
All fields are required.
Form not available
Follow along to learn more about the importance of the emerging field of UX, what today's designers are being hired to do, and why every type of business can benefit from thoughtful UX design.
UX design is about creating products "that provide meaningful and relevant experiences to users," according to the Interaction Design Foundation. Within UX design, there are a few different categories.
1. Interaction Design
A subset of UX design is interaction design (IxD). It is defined as ... yup, you guessed it... the interaction between a user and a product — the goal of that interaction is for it to be pleasant for the user.
2. Visual Design
In visual design, creators use illustrations, photography, typography, space, layouts, and color to enhance user experience. To have successful visual design, artistic design principles including balance, space, and contrast are crucial. Color, shape, size, and other elements also impact visual design.
3. User Research
User research is the last major element of UX design. User research is how companies determine what their customers and users want and need. At its core, your website should solve a problem, and so this is an important step in determining what exactly your users require. Without it, your designs are simply guesses.
4. Information Architecture
Designers use information architecture to structure and label content so that users can find information easily. Information architecture is used on websites, smartphones, apps, and even in the physical places we go to. Ease of use and discoverability are two important factors of information architecture, which is why it is so closely related to UX design.
Think about the New York City Subway map. This is a great example of information architecture that helps people understand how to get from one place to the next. According to the Information Architecture Institute, "If you’re making things for others, you’re practicing information architecture."
Source: NYC Subway Guide
UX Design Principles
UX is an ever-changing field, but the fundamental UX design principles remain the same. Designers also have to determine what they want in terms of visual balance. Being clear and concise is crucial … less is more! You want your design to be intuitive, and most importantly, your design should meet the user’s needs.
While UX is subject to trends and new technology, there are a few core principles that stay the same. These help designers look at various problems through a methodology that's consistent and focused.
- Be contextual: You want individuals to know exactly where they are in their user journey. They should never feel lost or overwhelmed. Your design is there to guide them along their journey.
- Be human: No user enjoys feeling like they are interacting with a machine. You’ll gain the trust of the end-user if you show them your brand’s personality and approachability.
- Be findable: Users don’t want to waste time. With a successful UX design, your work will be easy to find and navigate.
- Be easy: Being consistent and straightforward will go a long way with your users. You build relationships with your users by providing them with enjoyable and easy experiences.
- Be simple: No fluff, tangents, or unnecessary descriptions. Get to the point. Let’s be honest here … these days, everyone has a short attention span.
These principles will guide you at every stage of the UX design process. Let's walk through what each of those stages entails below.
UX Design Process
There are typically several stages of the UX design process to consider. UX design takes a human-centered design approach during all these stages. This is about considering the needs of the people you are designing for, coming up with a wide range of solutions to resolve the issue they are facing, designing prototypes for the users to test, and then finally putting the best solution in place for the user. If you look at the issue from the perspective of the user, and design with them in mind, you will create solutions they will want to adopt.
Let's take a closer look at each stage of the design process below.
1. Understand your user’s pain points.
Since UX design is about improving the user experience, your first step is finding out what the challenges and expectations of users are. Once you understand what the problems are, you can solve for them.
In an article for Career Foundry, Rosie Allabarton stresses the role of empathy at this stage of the UX design process. She said, “You’ll be working with groups of users who come from a variety of backgrounds and are bringing different experiences with them. Your job is to try to understand why they are behaving the way they are, not to try to change that behavior or influence it, but accommodate it within the product.”
There are a few approaches you can take to gather this important user research.
Interviews
One of the best ways to understand your audience is to be in the same room as them. User interviews typically entail a group of users browsing through an existing site or product or even a competitor’s while members of your team observe. That way, your team can watch how people interact with a website or product and gather feedback in real time. This can help uncover areas of improvement that you and your team hadn’t noticed. Like maybe users are overlooking the CTA button on your homepage, or maybe they want a search box to navigate a website. You can then incorporate this feedback into your design process.
If in-person interviews isn’t an option, then you can always hold remote user testing sessions.
Online Surveys
While interviews are ideal for getting rich insights from a small group of users, online surveys are a great way to gather feedback from a larger audience. Surveys consist of a series of targeted questions sent to a sample of your audience. These questions can take on a variety of forms, including yes/no, multiple choice, checkbox, dropdown, ranking, ranking scale, and textbox. Online surveys are typically distributed via forms, and then compiled in a database so you and other stakeholders can review them.
.png)
8 Free Consulting Templates
Access 8 templates for consultants in The Complete Consultant's Success Kit.
- Management Consulting Plan Template
- Business Plan Template
- Sales Plan Template
- And More!
Download Free
All fields are required.
Form not available
2. Create user personas.
Now that you have all this user research, you’ll want to summarize it. Creating user personas is a great way to do so. Also known as buyer personas, these personas are semi-fictional representations of your ideal customers based on data and research. Buyer personas help you better understand your existing and prospective customers, so you can tailor your products as well as your services, content, and messaging to meet their specific needs, behaviors, and concerns.
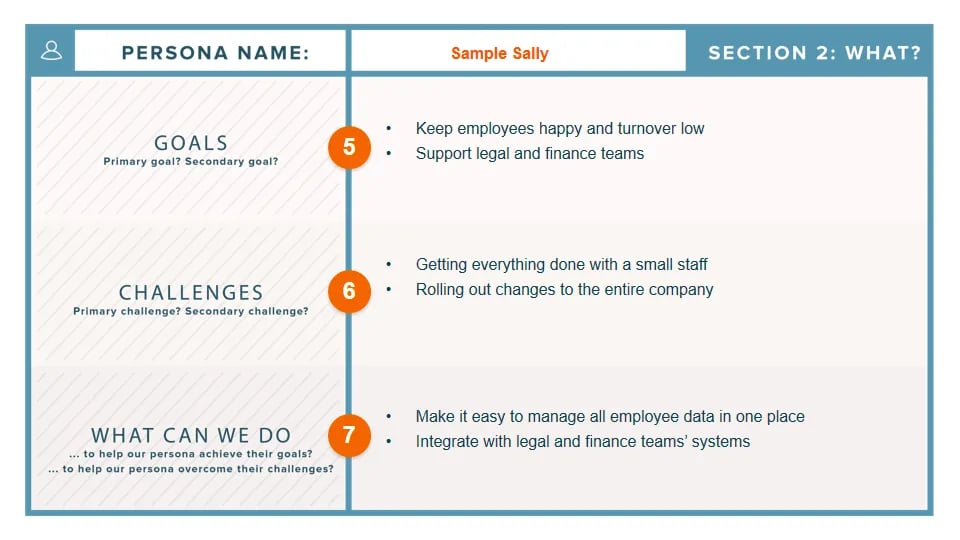
These personas help ensure that everyone on your team understands, remembers, and centers the end user throughout the design process.
To learn how to research and create personas, check out the post How to Create Detailed Buyer Personas for Your Business [Free Persona Template].
3. Map out user journeys.
While you can categories users into different types of personas, every user is unique. That means different users will interact with your site in different ways — even if they have the same goal. Say they’re looking to apply to a job at your company. Some might navigate to your homepage, click Careers from your navigation bar, and then browse your job openings. Others might search your company name plus “careers” in Google.
Your goal is to identify the primary goals of your users and ensure they can complete their goals. So an ecommerce site, for example, will need to identify all the different ways a customer might want to complete a purchase and make sure their site enables them at every step. Providing functionality to ensure a customer can complete a purchase on a desktop, tablet, and mobile device are just a few scenarios you’d have to plan for. You’ll likely need a lot of colorful post-it notes for this stage.
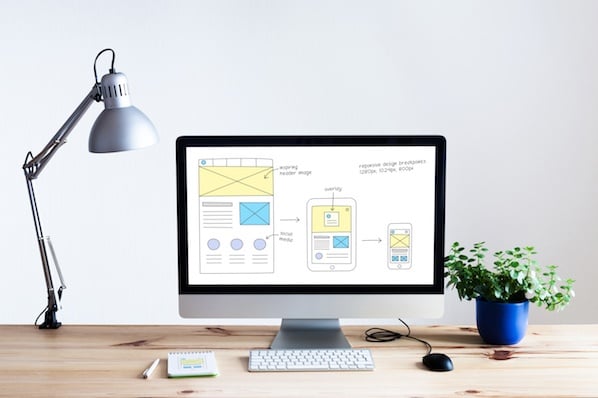
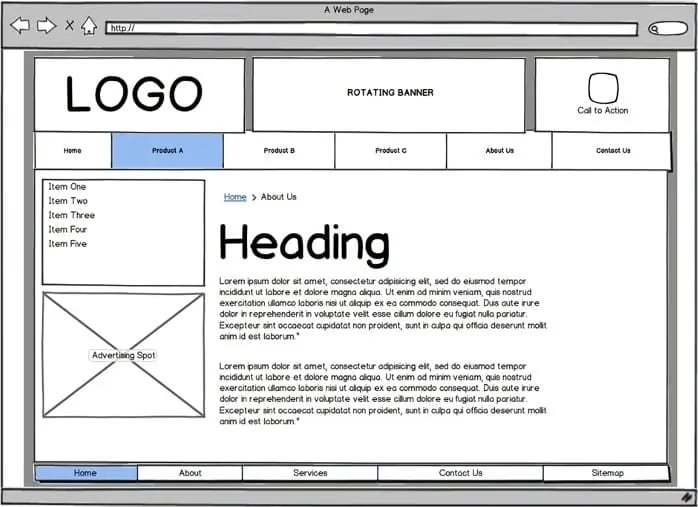
4. Create website wireframes.
Now that you’ve mapped out user journeys on paper, it’s time to map them out in your actual product with website wireframes and prototypes. You can think of a wireframe as a sketch of your product or website.
When creating a wireframe for your website or product, you can plot out how you want to display your main features, allocate space, and present images and content and how this layout helps (or hinders) the user from achieving their goals before introducing design elements like color schemes.
Evaluating your product’s functionality and intended user behavior at this stage can help you find potential problems or missing features that might get in the way of conversions or sales later on — before you’re too far along in the design process. That way, you can easily make changes, get approval from other stakeholders, and confidently move to the next stage of the design process.
Wireframes range in complexity. Some are hand-drawn with a pencil, others are created with free software tools like Inkscape and GIMP while other use paid software tools like Sketch and Canva. Here’s an illustrated example.
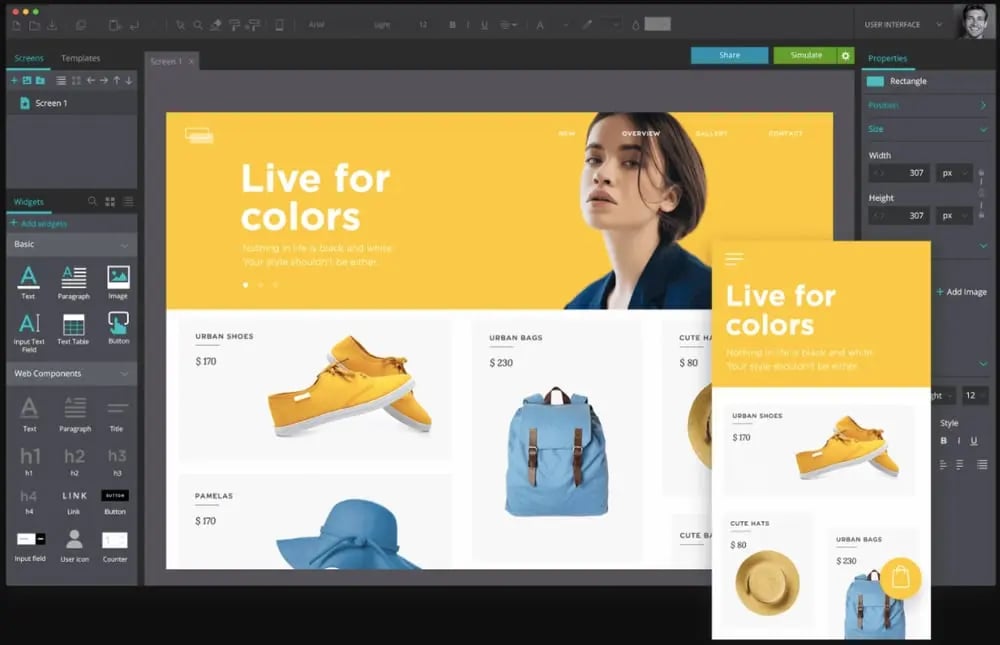
5. Start prototyping.
Think of a prototype as the final draft of your product or website before the coding begins. It’s not the final version, but it’s close enough that you can fully test the product before it launches and demonstrate it to management and other stakeholders.
Unlike a wireframe, a prototype will include font, images, icons, and colors. This phase is focused less on aesthetics and more on user flow, however. Prototypes will be interactive, allowing you, users, and other stakeholders to experience how the product works in real life.
You’ll run more user testing at this phase to uncover issues like whether your checkout process requires too many clicks or your homepage is difficult to navigate.You’ll likely experiment with navigation and other functionality at this stage, and produce lots of iterations.
To create a prototype and subsequent iterations, you’ll need to use a dedicated tool like Adobe XD, InVision, or the free Justinmind. Here’s an example of a prototype built with Justinmind.
At this point, the coding can begin so you’ll pass your prototype to designers and developers who will build a user interface. More on what a UI is and how it differs from UX later.
UX Deliverables
UX deliverables are the various outputs of a UX design process. The designer and team will have to produce and present these deliverables to an internal team and external clients for review — either during the design process or once the project is complete.
As tangible records of the work that has occurred, UX deliverables are a critical part of the design process. These deliverables help UX designers to effectively communicate their design ideas and findings, and make it clear to stakeholders why recommendations for changes and improvements are made. They also help designers get buy-in for their ideas.
Free UX Research Kit + Templates
3 templates for conducting user tests, summarizing your UX research, and presenting your findings.
- User Testing Template
- UX Research Testing Report Template
- UX Research Presentation Template
Download Free
All fields are required.
Form not available
1. User Research
User needs, tendencies, and motivations can be determined through different types of user research. This might include quantitative and qualitative data from user testing sessions and focus groups. It could detail feedback on sign up flows, the onboarding process, and customer service inquiries.
The goal is to have a detailed analysis of what's both working on the site and what could be improved — and to have this all backed by information gathered from users. Researchers may create buyer personas based off of real user data to help them accurately determine who will be using their device, website, or app. Through user research, designers understand and empathize with the user.
2. Competitor Assessment
Assessing the strengths and weaknesses of your competitors is a way to enhance your own UX strategy. A great way to do this is by creating a competitive analysis report that details the interaction design of your competitors and provides an analysis of where you see pitfalls and missed opportunities — things your business can take advantage of.
3. Interaction Design
An interaction design deliverable could come in the form of a prototype so that people can review how interactions with the site would occur — showing how people would complete key tasks, get information, use a product, the flow of finding information, and how easy the product is to use. You want your prototype to be as similar to the final product as possible, so you can get sign off on the design before you begin building it.
4. Information Architecture
IA is the process of taking information and organizing it in a way that is easy to understand. For large websites, this is especially important, as you need to understand what content exists and how to organize it in a way that makes sense for your visitors. The result might be a content inventory, sitemap with suggested navigation, or sample user flows that reveal how visitors move through a site.

Source: Adobe Blog
Now that we understand the different deliverables a client or manager might ask from a UX designer, let's take a closer look at arguably the most important: UX research.
User Experience Research
Without research, all of this focus on what the user needs and wants would be impossible. UX research is the investigation of users and what they need, which informs the UX design process. Companies and designers use this research to come to specific conclusions about what is working for users and what needs to be changed. There are several ways companies and designers perform UX research.
Usability Testing
Usability testing evaluates how successful a product is by testing it on actual users. It gives companies real input on how individuals are using a product or system and how that product or system works for that user. There are two primary testing methods.
Hallway usability testing is a quick and cheap way for companies and researchers to get information from users who may not know of your company or products. Random individuals use the products and give feedback on their experience.
Remote usability testing allows companies to research with users in their natural environment (such as in their home or office). These tests can be moderated in any way the company chooses.
Usability Testing Tools
Usability testing tools allow researchers and designers to compile accurate feedback from users and then analyze that feedback to make data-driven changes. If you’re looking for a tool that can help you test how easy-to-use your site or product is, check out these options:
- Crazy Egg: This tool allows companies to see exactly what users are clicking on while on their website. Crazy Egg also records exactly where site visitors are coming from, including geographic location, and if they were referred from another site.
- Hotjar: This tool combines analytics and feedback to give an overview on ways to improve user experience. They do this through the use of heatmaps, visitor rates, conversion funnels, and more.
For more usability testing tools to consider, check out this post.
How to Enhance User Experience
Through the research and testing mentioned above, user experiences can always be improved. Some of the most common ways to improve user experience include: Taking a consultative approach to improving the experience, determining calls to action, implementing responsive web design, considering Fitt's Law (more on this next), avoiding overwhelming data entry, and more.
Using Fitt’s Law to Enhance UX
Fitt’s law is a predictive model that determines the amount of time it takes for a specific user to move their mouse or cursor to a target area on a website. There are multiple versions of Fitt’s law that exist but they all revolve around the general idea that, “The time required to move to a target depends on the distance to it, yet relates inversely to its size.” Fitt’s law is widely used in UX design to improve ergonomics in addition to usability for users.
Here’s an example of this at work: Have you seen the new Touch Bar on Apple’s MacBook Pro? This is a touchscreen above the keyboard that speeds up a user’s experience when using Google, bookmarking a page, changing screen brightness, volume, and more. Touch Bar options change depending on what page you are browsing while on your laptop, whether that be an app, a site you are visiting, or even just your personal settings.
With the Touch Bar, the user’s experience is simplified because many commonly used settings are in one compact location. Fitt’s law states the further away and smaller an object or button is for a user, the harder it is for that user to click on it. That’s why the Touch Bar is such a great example of taking Fitt’s Law and successfully applying it to your device to enhance user experience.
Free UX Research Kit + Templates
3 templates for conducting user tests, summarizing your UX research, and presenting your findings.
- User Testing Template
- UX Research Testing Report Template
- UX Research Presentation Template
Download Free
All fields are required.
Form not available
UX Design Tools
Whether you are researching, prototyping, wireframing, storyboarding, or creating graphics, there are multiple UX tools available to assist you during the design process. In fact, there are so many tools on the market, some free and some that require a subscription fee, that it may be overwhelming for designers who are unsure of exactly what they need. To get you started, here’s a list of some popular and valuable tools to use in your UX design work:
1. Adobe Fireworks
Adobe Fireworks CS6 gives web designers a way to create graphics for their web pages without getting into the code or design details. There are a few reasons why UX designers use Adobe Fireworks: The tool has impressive pixel accuracy, has image compression abilities (JPEG, GIF, etc.), allows users to create functional websites, and build vectors. This is a great option especially if you are already familiar with other programs in the Creative Cloud.
2. Adobe XD
With Adobe XD, you can design websites and mobile apps, as well as create prototypes, wireframes, and vector designs. Users can share interactive prototypes on multiple platforms, including Windows, Mac, iOS, and Android, so it’s perfect for team collaboration.
3. Axure
Axure RP Pro is another great UX design tool — that’s also free. Axure has several capabilities including wireframing, prototyping, and documenting. It can even help you create user flows and sitemaps. Axure is perfect for creating web and desktop applications, and it gives users the ability to easily export to PDF or HTML for review.
4. Adobe Illustrator and a Free Alternative
If you’re looking for an affordable alternative to Adobe software, such as Adobe Illustrator (which is primarily used to create vector graphics), we’ve got you. Inkscape is known for doing most of what Illustrator does, but for free. This software is open source and can be used to create impressive vector graphics. The only issue you could run into is lag, as some users have reported that the program is slow. If you’re partial to Illustrator, that’s OK too.
5. Sketch
Sketch is an end-to-end software with specific features including non-destructive editing (meaning Sketch won’t change the pixels in the photo you are working with), code export, pixel precision, prototyping, vector editing, and more. With Sketch, you can reuse and update your designs easily.
6. Storyboard Software
You might be wondering why you would need to storyboard in UX design. It’s a great way to visually predict and review the way a user would interact with and experience a product in a broader context. There are several storyboard tools available, with varying levels of features and complexity.
Storyboarder is a free storyboard software option, which has basic features made for designers of all levels. This software allows users to quickly create drawings and stick figures to lay out a plot or idea.
Another storyboard software option is Toon Boom Storyboard Pro. It combines drawing, animation, camera controls, and numerous other features, all for an annual or monthly fee. It has a wider range of features for more complex storytelling and detailed prep work. Both options are great for designers looking to visually tell the story of their persona or users.
Storyboards are also a great way to bring in all stakeholders, including researchers, developers, and UI designers. Before we discuss how to become a UX designer, let’s make sure we understand the difference between two similar roles: UX and UI designers.
What is User Interface design?
Remember when Apple unveiled its click wheel for the iPod? When it was introduced, the feature was intuitive and highly functional — not to mention cool-looking.
This is a great example of a successful user interface (UI). UI refers to how people interact with computers, machines, websites, apps, wearables, and other programs or devices. User interface design is the process of making these things as easy to use and efficient as possible.
Common UI Elements
Although UX and UI have similar definitions, it’s important to note the key differences that separate the two topics. Again, UI focuses on a product’s appearances and surfaces, while UX is more concerned with how people interact with a site. Here are some common UI terms you should know to better understand how the two differentiate:
- Informational Components: UI designers use informational components to enhance the reading experience or give more information. Examples of informational components are progress bars, notifications, and message boxes. Designers use these when they want to make it clear to the user that they have completed a task, or if they want to notify the user that action on their part is necessary.
- Breadcrumb Navigation: This is a design tool often used by UI designers to visually increase the usability of a website. It allows users to see their location on a site in a hierarchical structure. It doesn’t need to have special visual features or over-the-top design — it should just clearly state where a person is located on a site. You may have noticed these links along the top of a webpage while online shopping or on another site.
- Input Controls: Input Controls give individuals multiple options in response to a question you are asking. These are things like checkboxes, drop-down lists, and toggles. Keep the information you are asking in your input controls simple and to-the-point so it’s easy to find what the user needs.

Source: UX Planet
If you love designing, researching, working with other people in a fast-paced environment, and listening to others’ experiences, a career in UX design may be right for you. As a UX designer, you’d focus on the conceptual aspects of design and create better experiences for users.
Here are the steps to follow to become a UX designer.
Free UX Research Kit + Templates
3 templates for conducting user tests, summarizing your UX research, and presenting your findings.
- User Testing Template
- UX Research Testing Report Template
- UX Research Presentation Template
Download Free
All fields are required.
Form not available
1. Do your research.
This step may seem like a given, but pursuing a career path (or changing yours altogether) is a big move. Do plenty of research to ensure that you want to be a UX designer. Guides like this one will help give you an idea of what UX design entails. You can also lookup "day-in-the-life" articles, podcasts, and books to better understand how other UX designers spend their workdays.
2. Take a UX design course.
There are plenty of higher education courses available around the world, though they typically require a four-year undergraduate design curriculum as a prerequisite.
However, some programs allow for more flexibility, such as the online Quinnipiac University Graduate Program in User Experience Design. There are also UX certification programs for professionals. These vary in commitment length and level of expertise upon receipt of the certificate.
3. Apply for a UX design internship.
A UX design internship is valuable for a few reasons. First, UX design internships bridge the gap between education and real-life experience. Internships allow you to put what you've learned in the classroom (or online) to work while receiving helpful feedback from your peers and coworkers.
Secondly, UX design internships allow you to build a live portfolio of design work done on behalf of a real company. While demo work is valuable for demonstrating skill and process, you can report on the impact and results of the work you complete during your internship.
Lastly, UX design internships introduce valuable mentor relationships. Design mentors are critical to developing your skills, receiving constructive criticism, and expanding your network — three things that can help you land your dream UX design job.
To find a UX design internship, start with sites like LinkedIn, The Muse, Glassdoor, and AngelList, as well as simply searching on Google. You can also target the companies themselves: Apple, Google, Microsoft, Reddit, Adobe, Amazon, and Salesforce all offer UX design internship programs.
4. Build your UX design portfolio.
Once you’re ready to start applying for your dream UX job, you’ll need a stand-out resume and a flashy portfolio. Use a site like Dribble or Behance to showcase your work, or create your own website using a tool like SquareSpace.
When building your portfolio site, keep these tips in mind:
Make it visually stunning.
Presentation is everything. Your work should speak for itself ... show don’t tell! Your choice in color, typography, and layout all play a factor here.
Include an “about” page.
Hiring managers and recruiters want to get to know you, how you think about design, what inspires you, and what makes you unique. Why should they hire you? What value can you add to your new potential company and team?
Have clear navigation and links throughout your portfolio site.
Can you imagine the hiring manager at your dream company having a hard time navigating the portfolio site of a UX designer? Awkward. In your navigation bar, include options such as: “portfolio,” “about,” “contact,” and “resume” to avoid any confusion.
Explain your personal UX process.
Your future employer wants to know how you think. Include information that lets the hiring manager in on your UX researching, brainstorming, wireframing, designing, and prototyping processes.
Create additional portfolios to expand your network.
Use other tools to make your work available on sites where designers and those looking to hire designers to spend their time. Behance and Dribble are great portfolio sites for people looking for inspiration, networking, and new career opportunities.
If you're interested in this career path, we've gathered some ideas for UX projects that can help get you started and built out your portfolio. Let's take a look.
UX Design Ideas
Are you interested in UX design but don’t know where to get started? We’ve compiled a list of ideas for people who need inspiration just like you. Completing these projects will not only provide you with valuable experience, it will also provide valuable additions to your portfolio. Let’s take a look at some of these ideas and the real-life examples that go with them.
Free UX Research Kit + Templates
3 templates for conducting user tests, summarizing your UX research, and presenting your findings.
- User Testing Template
- UX Research Testing Report Template
- UX Research Presentation Template
Download Free
All fields are required.
Form not available
Redesign the digital menu of your favorite local restaurant.
Redesigning a restaurant’s menu is a great exercise in anticipating user needs. To find the right balance of information and images, you’ll have to decide what readers need to know and see to make informed decisions, and what will simply overwhelm them. You might experiment with the categorization, descriptions, and ratings of the food items, and more.
Below is a drink menu by Panji Arafat on Dribble.

Sketch a better interface for your toaster oven.
This will help you practice analyzing an existing product and identifying where you can add value in terms of functionality and design. The best part is you can complete this project without leaving your kitchen!
Below is an example by designer Sarah Kerbleski.
Redesign the homepage of your personal site.
You can redesign the homepage of any website, but using your own personal site or a site that you have access to analytics to is ideal. That way, you can practice accumulating and analyzing user research and using those insights to inform your design process.
When HubSpot redesigned its homepage back in 2016, UX Designer Austin Knight analyzed massive amounts of data and discovered three important trends: a significant number of users were moving from the homepage to the pricing page, FAQ page, and the search bar. All of these trends supported the conclusion that the homepage was lacking critical information that was affecting its conversions. You can read more about this redesign in the UXPin case study.

Redesign a feature in an application that frustrates you.
This can help you practice redesigning some functionality in an existing app, rather than starting from scratch. Product designer Jo Zhouzheng did exactly this for Doordash. Frustrated by the restaurant and menu browsing experience in this popular food delivery app, Zhouzheng redesigned the interface. Here’s a before and after look of the interfaces.

Design an app for checking in at your primary care doctor or specialist.
Designing any health app will be a great exercise in UX. Focusing on the check-in process specifically will help you practice identifying and solving for user pain points. You can focus on an in-person or virtual check-in, like Digital Product Designer Divan Raj did below.

Create personas for an app you want to design (or redesign).
Creating personas is an important part of the UX design process. You can get some experience by creating personas for a hypothetical app, or an existing one. Maybe you like an app or website, but know the functionality or design could be better. In that case, you could define new personas for that product. Or you could create personas for a product that you’ve thought of.
Daorong Fang, for example, created a prototype of a mobile app for in-person social networking events. To illustrate her key audience and help potential stakeholders sympathize with her target issues (ie. how awkward and time-consuming networking can be), she built two personas. One of them — Techy Sarah — is shown below.

Map out a voter’s journey in a local, state, or federal election office .
This can help you understand how UX design can contribute to larger phenomena, like low voter turnout, and flex your analytic and critical thinking muscles. By plotting out the path from registration to the point where voters have a ballot in their hands, you’ll uncover regulations, time constraints, a lack of transparency, poor design choices, and other pain points.
Whitney Quesenbery and Dana Chisnell founded The Center for Civic Design with this exact goal in mind: they wanted to understand where people fall off the voter journey, and how to get them back on. Below is one of their Field Guides to Ensuring Voter Intent, which helps local officials create well designed ballots.

These are just a few ideas. For more inspiration, check out websites like Dribble and Awwwards.
UX Design Helps You Grow Better
Whether you’re a graphic designer, blogger, developer, or someone in an entirely different field, UX design can help you and your company grow. A happy end-user is the key to success, and without well-crafted UX design, this would be impossible to achieve.
As technology becomes more ubiquitous in our lives, successful UX design will continue to create seamless transitions between individuals and their devices and apps. UX design has never been more important, making it an exciting time to join the field and consider the benefits for your own business.
Editor's note: This post was originally published in June 2018 and has been updated for comprehensiveness.
User Experience
![The Usability Testing Playbook [Expert Tips & Sample Questions]](https://53.fs1.hubspotusercontent-na1.net/hubfs/53/usability-testing-1-20250305-3357250.webp)
![9 Breadcrumb Tips to Make Your Site Easier to Navigate [+ Examples]](https://53.fs1.hubspotusercontent-na1.net/hubfs/53/breadcrumb-navigation-tips.jpg)