
If you can prove that your marketing activities actually made an impact on your business, you'll have many more opportunities (and budget) to grow your marketing efforts. Sounds like a marketer's dream, right?
But how do you find the right metrics to measure and prove marketing ROI to your boss and stakeholders? With the help of this guide and a free marketing ROI excel template, you'll learn how to calculate your marketing ROI with Excel to secure more resources for your marketing team.


How to Calculate ROI in Marketing
To calculate marketing ROI, use this formula: (sales revenue - marketing cost) / marketing cost = ROI
For example, if you've been running an $800 marketing campaign for three months, and average sales revenue was $2,400 for those three months, your marketing ROI would be:
200% = ($2,400 - $800)/$800
If math isn't your cup of tea, use a marketing ROI calculator to do the heavy lifting. The free ROI calculator below considers five factors of your marketing campaign to produce an accurate ROI percentage for your marketing efforts.
Marketing ROI Calculator

Calculate Your Marketing ROI Free
Pro Tip: if you're a HubSpot customer, you can use this ROI calculator programmed with the same formula.
Calculating ROI the old fashioned way in Excel is still the most popular method for good reason. By using Excel, you can keep track of ROI overtime to run comparisons, identify gaps, and optimize your marketing efforts.
Here's a guide for calculating marketing ROI in excel.
How to Calculate ROI in Excel
Excel is one of the most accessible ways to calculate return on investment in a matter of seconds. You don't have to make up any fancy formulas or commands — just follow these steps to calculate your marketing ROI.
Step 1: Write down your formula.
You won't be able to enter this formula as-is into your spreadsheet, but understanding the formula before opening Excel will be helpful. By taking note of the formula below, you'll know which cells to include in your Excel formula so that you calculate your numbers correctly.
(Sales Revenue - Marketing Cost)/Marketing Cost
Step 2: Add variables.
Open your Excel spreadsheet and add one row for your sales revenue and one row for marketing costs. In the next column over, include how much sales revenue your marketing campaign generated. Then, under that, add how much your marketing team spent on the campaign.
In the example below, our sales revenue was $50,000 and marketing costs were $12,500. Right away, we know that the campaign generated more money than was spent on it, so that's a great sign of high ROI.

Step 3: Add the formula
Once you've added your revenue and cost numbers, select a free cell to type in the formula using your data. In this example, we chose the cell right below the revenue and cost numbers. Here's how the formula translates into Excel:
- Sales Revenue is in cell B2
- Marketing Cost is in cell B3
(Sales Revenue - Marketing Costs) / Marketing Costs =
(B2 - B3) / B3

Step 4: Calculate marketing ROI.
Tap enter or return on your keyboard to calculate your ROI.
If the formula doesn’t automatically calculate it as a percentage, change the number format by going to the Home Tab > Number > Percentage.

Step 5: Communicate the ROI
Now that you know the ROI on this marketing campaign was 300%, how do you communicate this to your stakeholders so that they know whether or not 300% was successful? With any statistic, it's important to give context for the data you discover. For ROI, you can communicate it like this:
"Our return on investment for the latest marketing campaign was 300%. That means for every dollar we spent in marketing costs, we made $3 in revenue. Compared to our past marketing campaigns that had an ROI of 200%, this was our most successful one to date."
Marketing Reporting Templates
Excel, PowerPoint, and Google Drive Templates to Make Your Monthly Reporting Faster and Easier
- Track leads.
- Measure CVR.
- Track channel performance.
- And more!
Download Free
All fields are required.
Calculating Marketing ROI with Attribution Variables
Figuring out your return on investment when attribution isn't as black and white requires a slightly different approach.
For example, over a 12-month campaign, the sales team may inform the marketing team that 10% of the sales revenue came from leads that were organically prospected on the sales team and weren't impacted by marketing's efforts. This is an example of varying attribution of revenue and is a common problem that marketing and sales teams face. In other words: Who really gets the credit for revenue generated?
Depending on the thresholds set by both teams, you can add attribution as a this variable along with the original factors using this ROI equation:
(Sales Revenue - Organic Sales Revenue - Marketing Cost)/Marketing Cost
To calculate the ROI, tap enter or return on your keyboard and you’ll have a more precise ROI metric that attributes credit to the sales team for revenue they generated without the help of marketing.
After accounting for organic sales revenue, the marketing team's ROI was a bit lower at 220%. To communicate this to stakeholders, you might say:
"Sales revenue for the past 12 months was $50,000. The sales team generated $10,000 of that revenue through organic efforts like prospecting. The marketing team's campaign contributed to the other $40,000 in revenue resulting in a 220% ROI. That means for every dollar we spent in marketing costs, we made $2.20 in revenue. Compared to our past marketing campaigns that had an ROI of less than 200%, this was very successful."
Now that we’ve reviewed a couple of examples, let’s walk through which metrics you should track to measure ROI for your marketing campaigns.
Metrics to Track for Marketing ROI
- Reach
- Impressions
- Visits
- Leads
- Conversion Rates
- Customer Lifetime Value (CLV)
- Return on Ad Spend (ROAS)
- Cost Per Lead (CPL)
- Cost Per Acquisition (CPA)
- Lead Close Rate
Not all metrics are equal when it comes to ROI, so you're going to need to tell a story with the right data. Here are the top metrics to tack when measuring marketing ROI.
1. Reach
Reach is an important metric to track for advertising spend, especially for digital ads. This metric determines how many individual people saw your marketing campaign content.
If your campaign has a goal of increasing brand awareness within a large target audience, you'll want to look at reach to make sure you're reaching many different people rather than the same person a few thousand times.
2. Impressions
Impressions tell you how many times your marketing content was viewed. They don't, however, don't take into account whether the users were unique or not. Depending on your campaign goals, this metric can indicate how efficient your campaign was at spending money compared to how many times campaign assets were seen.
If your campaign goal is to guide customers through a traditional marketing funnel, repeat exposure to an ad is a key part of doing this successfully and impressions is one metric you can use to track this.
3. Visits
Your website is one of the most important marketing assets your team manages. Every time a person visits your site, they have an opportunity to become a customer and spend money with your business.
Measuring the ROI of a new website redesign using visits as a metric can give your team insight into whether the new design is working, whether SEO has improved and brought in more traffic, and more.
4. Leads
Acquiring leads can get expensive if your marketing strategy isn't up to par. Determining ROI on lead acquisition is critical as the goal is to keep Cost Per Lead (CPL) in line with your company's revenue goals.
It's a good idea to develop a service level agreement (SLA) with the sales team to determine how much marketing is willing to spend on leads vs. the customer lifetime value (CLV).
5. Conversion Rates
A conversion rate details the percentage of people who take a specific action on one of your marketing assets. This could be clicking a CTA on your website, making a purchase, or signing up for a newsletter.
It's common for a marketing team to manage several conversion paths, thus having several conversion rates to keep track of. As a result, you'll have a different ROI for each conversion.
To measure which conversions have the best ROI, you'll need to determine how much it costs to get a customer to the point of conversion (i.e. Did you use paid ads or organic traffic to get visitors to convert?) and how much that conversion is worth (if the conversion is a purchase, then you'd use the purchase price).
6. Customer Lifetime Value (CLV)
Believe it or not, customers are valued based on how much they spend, how many purchases they make, how often they engage with CTAs, content, and more. Your company can set the criteria for a customer's value. Once you've determined this, CLV can be calculated using this formula.
CLV is a useful variable to include when calculating your marketing ROI because it compares how much you spend on marketing campaigns compared to how much money a customer is worth to the business throughout the customer life cycle.
7. Return on Ad Spend (ROAS)
Sometimes marketing campaigns rely heavily if not solely on paid digital advertisements. These ads can take many forms including search ads, display ads, social media ads, and more.
Return on Ad Spend (ROAS) is a type of ROI metric that lets you know how efficiently you're spending your advertising dollars. The formula is the exact same as the ROI formula we shared earlier, except it only measures paid advertising dollars rather than all marketing spend which could include costs for contractors, agencies, and other functions that help launch your campaign.
If you're curious about where your ROAS stands right now, use this free ROAS calculator to get an idea.
Marketing Reporting Templates
Excel, PowerPoint, and Google Drive Templates to Make Your Monthly Reporting Faster and Easier
- Track leads.
- Measure CVR.
- Track channel performance.
- And more!
Download Free
All fields are required.
8. Cost Per Lead (CPL)
Cost Per Lead is a metric that marketers use to measure how many interested prospects their campaign is gaining. A lead doesn't make a purchase. Instead, they exchange information for access to a business's content or offers. This information can be an email address, phone number, survey, or something else that is not monetary.
What's considered a high or low CPL varies widely by industry, company, and even campaign to campaign. Factors like copy, design, site speed, landing page content, and more can affect your CPL numbers.
9. Cost Per Acquisition (CPA)
Similar to Cost Per Lead, Cost Per Acquisition measures how many people take an action to purchase your product. An acquisition is usually identified by a visitor entering their card information to sign up for a free or discounted trial. They may also make a purchase outright.
10. Lead Close Rate
Your lead close rate is best described as the number of leads who turn into customers. Ideally, every marketer wants every lead to become a customer, resulting in a 100% lead close rate, but that's unrealistic. Just like CPL and CPA, the lead close rate can vary widely among industries, companies, and campaigns.
Tracking this metric can identify gaps in your marketing campaign. If you notice many of your leads are not returning to make a purchase, you can identify another touch point to reach them or try retargeting them with a different ad that leads them to make a purchase.
For more marketing metrics to measure for ROI, take a look at our marketing metrics template.
How to Create Your Own Marketing Metrics Report
So now you know what metrics you need, but what about generating a report to share these metrics? Trust me, nobody wants to receive a spreadsheet and be expected to read it front and back. Even if your marketing ROI is 1000%+ day over day, you'll probably receive a lackluster response from your stakeholders if you don't tell a story with the data.
Follow these steps to create an engaging marketing metrics report.
Step 1: Follow along by downloading a free monthly marketing reporting template for Excel and PowerPoint.

Step 2: Open Excel and add your metrics.
The equations and graphs will automatically populate and adjust based on the metrics you add.

Step 3: Copy the graphs and paste them into PowerPoint.
Right click on the graph you want to copy and select Copy.

Then open your PowerPoint slide deck and click Paste where you want the graph to go.

Step 4: Customize your graphs and charts to fit your company's brand.
Click on individual elements in the graph to customize them.

Step 5: Add context to tell a story with your data.
Add content to each slide that explains your marketing team's success from the past month. For example, if you have a blog post that drove a lot of leads, you could include a photo of the post along with a few takeaways. These specific examples give context to your presentation and justify why your marketing efforts worked and how you can repeat this success in your next campaign.

ROI Excel Templates
Excel is one of the best tools to use when tracking and calculating ROI regularly. Here's a collection of marketing ROI excel templates so you can report your metrics like a pro.
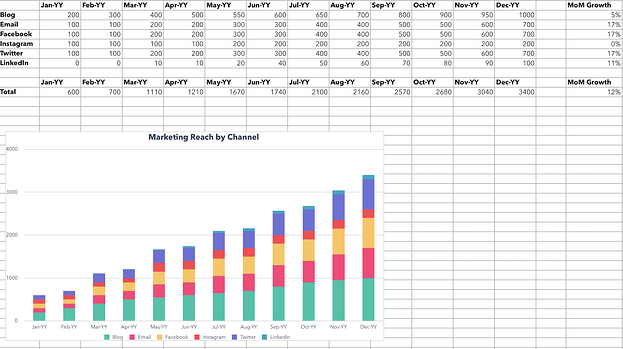
1. Reach Marketing ROI Excel Template
Calculate your marketing campaign's reach with this ROI template. You can measure the reach of your blog, email, and social media content.
2. Website Visits Marketing ROI Excel Template
With this template, you can calculate your website visits via sources and channels including paid traffic, direct traffic, and social media referrals.

3. Leads Marketing ROI Excel Template
See how many leads are generated with your marketing campaigns with this excel ROI template. These results are segmented by source.

4. Acquisition Marketing ROI Excel Template
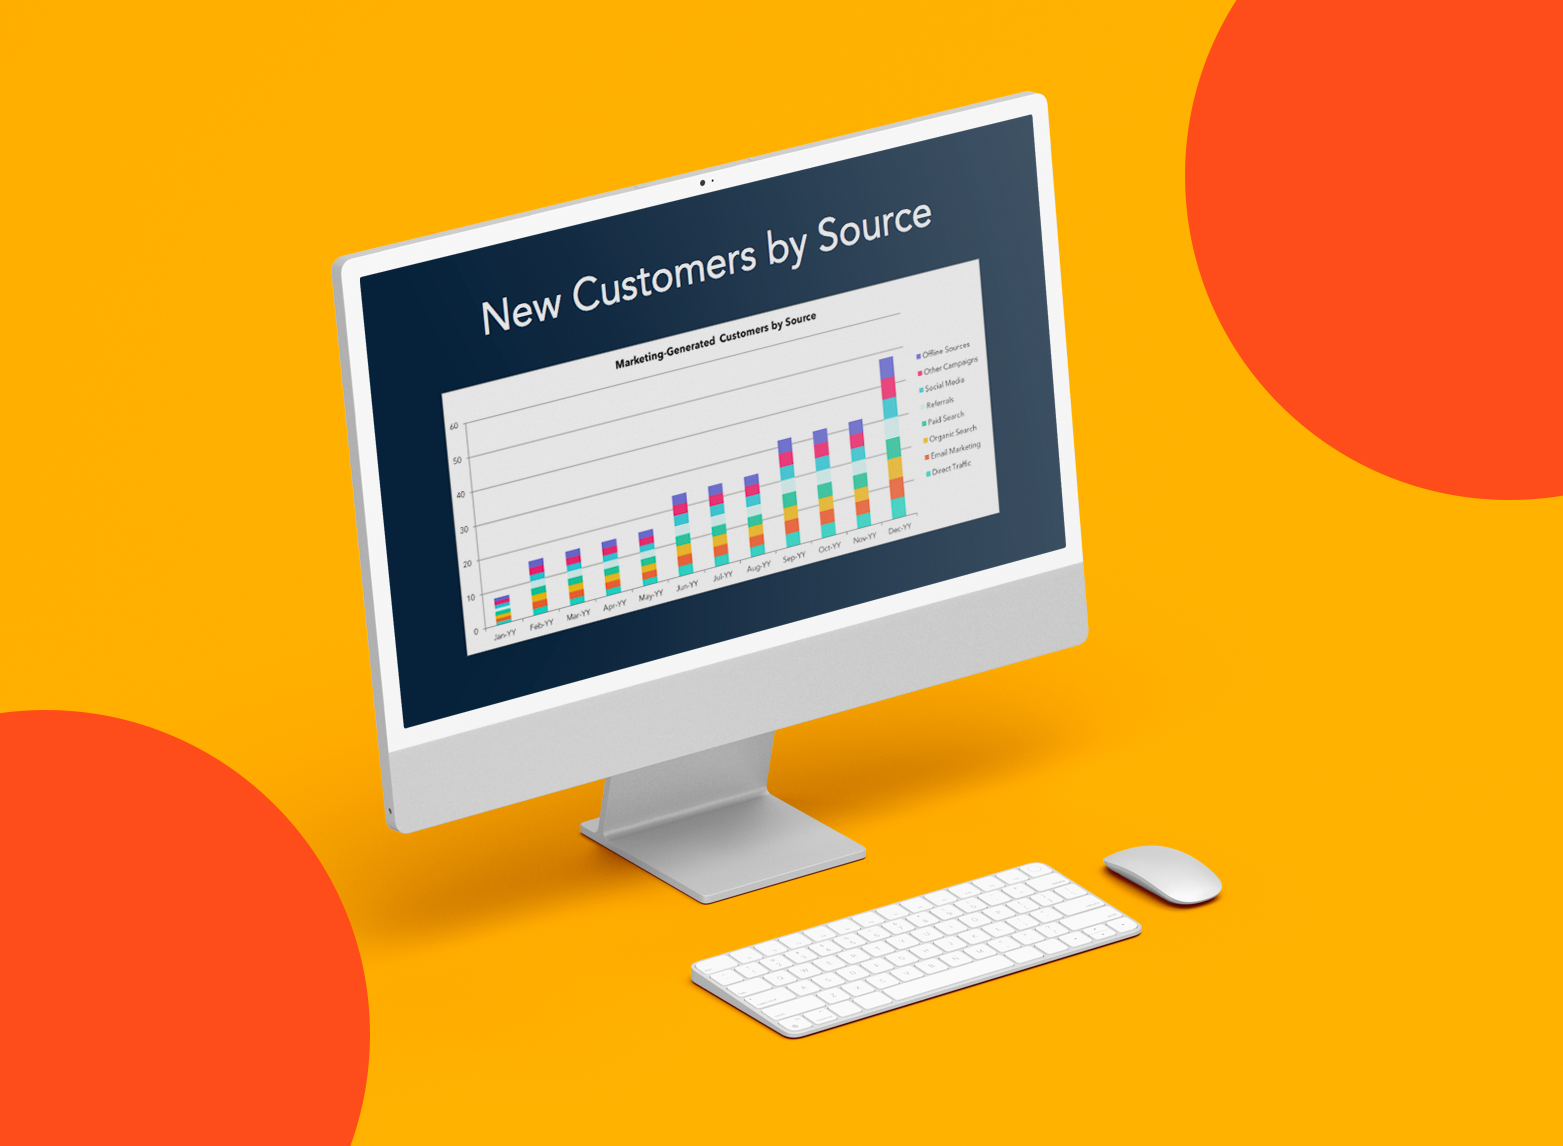
Use this template to track how many customers your campaign acquired, segmented by traffic source.

5. Conversion Rate Marketing ROI Excel Template
Identify how many leads converted to customers as a result of your marketing campaign with the conversion rate marketing ROI excel template.

Optimize Your Marketing Campaigns for Higher ROI
Businesses can make a lot of assumptions about how well marketing campaigns perform, but without the ROI data to back it up, they're just that — assumptions. Get your excel sheet or marketing ROI calculator out and follow this guide to really understand how well your campaigns are doing. You may even be able to make a case for a larger budget, additional headcount, or more resources to market your product or service even better.
Editor's note: This post was originally published in September 2013 and has been updated for comprehensiveness.


-Oct-10-2023-02-55-07-8252-AM.png)
-Apr-22-2023-12-26-04-1013-AM.png)
.png)

![How to Create a Funnel Report [Quick Guide]](https://53.fs1.hubspotusercontent-na1.net/hubfs/53/funnel-reporting_1.webp)