.png?width=112&height=112&name=Image%20Hackathon%20%E2%80%93%20Vertical%20(61).png)

The easier it is for customers to reach your customer support team, the more likely it is for a bad experience to turn into an opportunity for creating customer delight. In this post, we’ll review everything you need to know about building a social media customer service plan that will help you serve your customers and improve your brand image.
What is social media customer service?
Social media customer service is the process of offering customer support on your social media channels, starting from a complaint or query all the way to a resolution. With a social media customer service plan, you'll have dedicated support reps monitoring and answering social media complaints, questions, and concerns.
Social media customer service doesn’t happen out of the blue or randomly. It must be done at a steady cadence for it to take effect. If you only answer a few complaints or queries every once in a while, you’ll seem inconsistent at best and unprofessional at worst.
Your social media customer service plan should help you with a few different things — reactively solving customer problems and complaints, proactively providing customer support, creating customer delight, and cultivating a brand known for something positive and inspirational (instead of just complaints).
Below, we’ll cover some social media customer service best practices that will help you achieve these goals.
Social Media Customer Service Best Practices
- Run an audit to find out where your customers are.
- Set up monitoring streams to find comments about your company across different channels.
- Keep an eye on your mentions, comments, and replies.
- Build a system to get questions answered quickly.
- Consider setting up a dedicated social channel for support.
- Determine guardrails about when you'll respond and when you won't.
- Figure out what you'll say when you do respond.
- Build best practices about responding.
- Measure and report on your social media customer service efforts.
- Create a social media platform adoption process.
Before you can start executing on a strong social media customer service plan, you need to find the answers to a few key questions:
- How do you find comments about your company on different channels?
- How do you go about finding comments and responding to customers?
- When you respond, what should you say? What should you not say?
- How will you measure and report on this effort?
- How will you grow and adapt over time?
We’ll go over ways you can find answers to these questions below.
1. Run an audit to find out where your customers are.
The first step to creating your social media customer service strategy is to figure out exactly where across social media platforms your customers are reaching out to you — and in what context.
For example, you might find more of your customers are sharing questions and complaints on Twitter, while they're sharing posts and tagging your brand on Instagram.
To do that, you need to run a comprehensive audit of every channel on every platform your brand is associated with to analyze how customers are making contact with you. From there, you can determine your strategy — and decide if you need to hire a social media customer service pro who's dedicated to managing customer communications.
2. Set up monitoring streams to find comments about your company across different channels.
Once you've figured out where customers are connecting with you on social media, you need to determine how you'll connect with them quickly and efficiently when they do it in the future. An easy way to do this is by setting up monitoring streams — something you can easily do using HubSpot's Social Media tool, like in the example below.
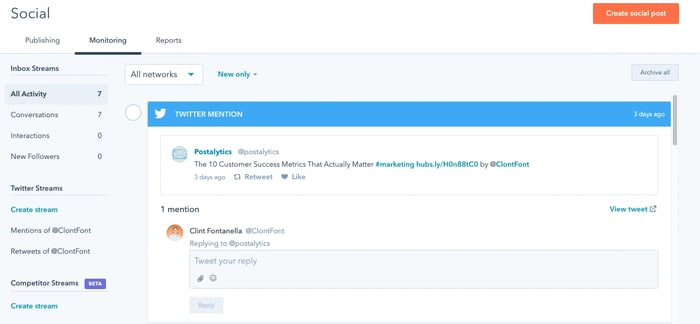
Whether you use HubSpot or a tool like TweetDeck, you can customize streams and lists according to whichever segments you'd like.
Here are a few streams we recommend setting up for social media customer service:
Positive and Negative Comments
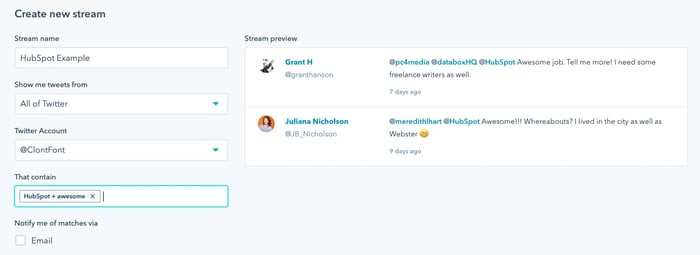
Set up monitoring streams that include a mention of your brand and positive or negative words to keep an eye out for customer love — or customer gripes. This is important because some customers like posting negative comments about companies on social media, either hoping to have others rally behind or hoping to get a response from you.
Think like someone on social media would tweet or post, and set up streams like "HubSpot + awesome," "HubSpot + worst," and "HubSpot + thank you." (And don't forget to set up streams for any common misspellings of your brand name.)
Questions
If someone is contacting you on social media with a question, they want it answered sooner rather than later — so you should set up a stream so you can keep a close eye on responding to messages quickly.
Set up a stream for messages containing your brand name, a question mark, and excluding your website URL (in some cases, question marks can appear in URLs shared on social media). This will help you get to customer questions faster to provide a better customer experience.
Blog Posts
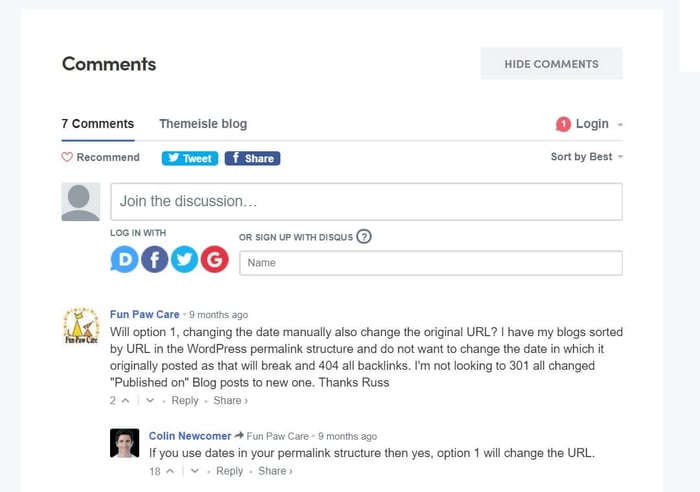
If you share content regularly on your company's blog, your social followers might engage with you about what you're writing about on social media. This could be the responsibility of the content marketing team or the customer service team, but if your brand regularly gets a lot of responses to blog posts, a member of your organization should be responsible for acknowledging or engaging these comments to keep the conversation going.
3. Keep an eye on your mentions, comments, and replies.
After setting up your stream, it’s time to monitor what comes up at a steady cadence.
This is the most important piece — to set up a system for consistent monitoring that creates exceptional social media customer service. It's important for the person in charge of social media monitoring and replies to be well-versed and knowledgeable in the space so they can stay on top of trending stories in your industry's vertical that might impact how customers are reaching out.
Set up a system for hourly, daily, and weekly monitoring of the different streams, pages, and inboxes where people are connecting with your brand so you're prepared to respond promptly to resolve problems for your valued customers.
4. Build a system to get questions answered quickly.
Now that you've set up a system finding questions, comments, and complaints from your customers on social media, you need to figure out how you're going to respond when they come in. Whether you use one dedicated team member to reply to customer service social messages or segment responsibilities according to different social networks, find a system that works for your team — and that gets messages replied to or investigated as quickly as possible.
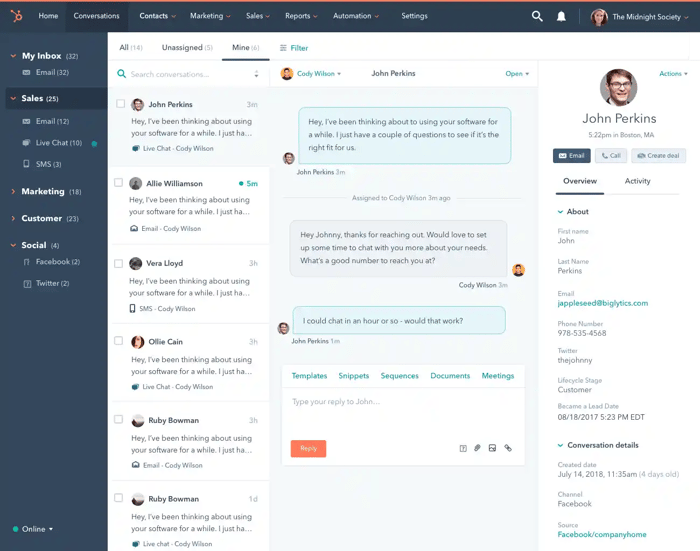
One tool you can use is Conversations — HubSpot's tool that unifies conversations with customers into a shared inbox across email, social media, live chat, and other outlets into one place. You can use this tool to assign specific customer messages and interactions to different team members across your organization.
5. Consider setting up a dedicated social channel for support.
If you notice that you're responding to a lot of customer questions and complaints on social media, you might think about creating a social media channel that's specifically dedicated to customer support — like HubSpot Support or Ask Lyft, for example. This could be an effective way to segment customer service requests apart from your coworkers' social media marketing efforts — just make sure your social profiles point customers in need of assistance to the support profile for faster assistance.
If specific team members will be replying to customer messages, make sure they sign off on tweets, posts, and direct messages with their name or initials. This will help the customer if they need to follow up, and it will humanize you and help foster more positive interactions.
If you go this route, it's also helpful to indicate in your bio or in posts when customer service agents are signing on and off for the day so customers aren't left hanging if they reach out during your off-hours.
If you're looking for more ways to engage customers on social media, you can listen to the podcast below for tips on using Twitter to drive more customer conversations and building an active digital community.
6. Determine guardrails about when you'll respond and when you won't.
If you’ve already taken all of these steps, then chances are that you’re likely picking up on quite a few customer queries — maybe tens per day and even hundreds per month. That means that it’s important to set up a prioritization system for determining when you can let a customer query slide, and when it’s critical to respond.
We recommend asking several key questions:
- Can you find this customer is your system? If they’re not a customer, there’s no need to respond.
- Does the comment refer to a specific experience? If the customer doesn’t provide a specific bad experience, then they might just be venting. But if they refer to an order they placed three days ago, then that’s an issue you might want to take care of as quickly as possible.
- What is the customer’s sentiment? If they seem angry, then it’s worth responding straightaway. If they seem lukewarm, you could place their request further down the list, and even forward them straight to your actual support team.
Depending on your business, you’ll determine guardrails that work for you. But the bottom line is that you probably won’t be able to respond to everyone, every time.
7. Figure out what you'll say when you do respond.
In many cases, customers might reach out on social media to complain or ask a question. But sometimes, people just want to "troll" your company or drag you into a conversation already happening on the social platform (this is common on Twitter). Make sure your team is on the same page about how to respond to negative social media posts and messages — and about not feeding the troll.
If the customer's message is something that you can help with, keep reading. But if you suspect someone is trying to troll you on social media with overly inflammatory remarks about pop culture, politics, or things otherwise unrelated to your product, service, or brand, we recommend you steer clear.
8. Build best practices about responding.
When you do respond to customer inquiries on social media, we recommend a few best practices to help solve problems in a way that's quick and efficient and cultivates positive brand sentiment among your customers. After all, you're not just solving your customers' problems — you're trying to delight them and make them recommend you (and your stellar support) to their friends and colleagues.
Stay positive.
Keep things light and positive when you respond to customers on social media. Unless it's obvious that they're joking around with you, avoid sarcasm or humor — at least until the problem is solved. But don't be afraid to show your personality when you engage with customers on social media, either. Once the problem is solved, use emojis or GIFs to show your personality and make your customers smile along the way.
Be transparent.
Some customer complaints on social media will be easy fixes, and some won't be. You don't have to solve every single question a customer has with your initial response, but you do need to be transparent with them about the timeline it will take until they get a fix. Whether you need to file a ticket with your product team or you truly don't know how long it will take to resolve an outage, be honest about it — your customers will appreciate honesty more than having to ask you, for the millionth time, when you'll solve their issue.
Know when to "take it offline."
Some customer interactions can be solved with a quick back-and-forth, but sometimes, you'll want to take the conversation offline to more effectively solve a customer problem. Invite customers to send you a direct message or email if they need to share their personal information for you to help them, or if the conversation is getting tense. That will minimize external visibility on the conversation and potentially solve the problem faster than waiting for a customer to tweet back at you.
9. Measure and report on your social media customer service efforts.
It's important to keep track of how many conversations you're having, the topics, and if possible, the sentiment analysis. Keep results of qualitative feedback on hand by tracking in a document frequently-occurring comments and feedback — both positive and negative.
But you should also try and quantify your social media customer service efforts as much as possible. You could send customer satisfaction surveys to customers via email, asking if they were happy with the service they received via social media, and you could collect that data to advocate for more resources to offer even more assistance to customers on these platforms where they're already spending so much time.
One survey you can send to customers regularly is NPS. You can ask customers how likely it is for them to recommend your social media customer service to others. This can provide you with both quantitative and qualitative data that can be used to measure your progress.
10. Create a social media platform adoption process.
Social media is a rapidly changing landscape with new platforms being created all of the time. With so many players flooding the market, it's hard to predict which of these channels will become popular with your customer base.
Take TikTok, for example. What started as a small platform in China has now taken the world by storm. Not many marketers anticipated its success and the brand's popularity seemingly came out of nowhere.
To keep pace with this ever-changing environment, you need a strategy that allows you to efficiently adopt new social media platforms. As soon as the next one becomes popular, your team can quickly identify it and determine whether or not it would be a viable customer service channel.
To do this, you need to answer a few questions about the platform.
Are your customers using the new platform?
Before supporting a new social media channel, your team needs to know if your customers are using it. The first place you can start is by assessing the platform's user demographics. Find out where users are from, what their backgrounds are, and what they're interested in. Once you have an idea of who's using the platform, you can determine whether or not it's relevant to your business.
Why are your customers using it?
If your customers are using the channel, then your team should start considering how you'll engage them through this new medium. To do that, you need to know why they're interested in the platform and what they're using it for. Is it for entertainment? Networking? Sharing content? Determining why customers are using a social media channel will help you support it in a way that fits their needs.
How are your customers using it?
The last question you'll need to answer is how frequently customers are using this channel. If customers are only using it on occasion, it may not make sense to roll out a formal support effort. Instead, it may be more effective to have one or two reps monitor the channel for customer feedback and analyze over time how customers continue to use the platform. If usage increases and customer demand rises, then you can commit a team of employees to manage this channel.
Now that you know the best practices for creating a social media customer service strategy, it’s time to take a look at some examples.
Social Media Customer Service Examples
It doesn't take long for businesses to turn social media apps into handy customer service tools. Let’s take a look at some social media customer service examples for you to get inspired.
1. MAC Cosmetics’ Tiktok
 TikTok has been around for a relatively short time, but you can already find brands using it for proactive customer service. MAC Cosmetics is one such brand. It uses TikTok to post customer reviews and mini makeups tutorials for its followers to try. This not only showcases the brand's products but also creates an engaging online customer experience.
While not a lot of customers post a lot of negative queries about their orders or about issues with the products, MAC Cosmetics still engages with their commenters. This shows that you can provide customer service on social media simply by responding.

In the comment above, the customer left a positive comment, and MAC Cosmetics provided the perfect on-brand response. Even more importantly, the brand subtly asks the customer to share their experience with the product without it feeling like an actual request for feedback.
2. SpotifyCares’ Twitter

SpotifyCares is Spotify’s official support channel on Twitter, and with over 300K followers, it’s a particular effective one. It specializes in publicizing if and when there are outages, and keeping users up-to-date on the status of the outage. This requires them to answer customer queries, request DMs, and listen for any additional complaints that come up.

In the example above, Spotify responded to one customer who was still having issues and encouraged her to keep reaching out if the issue kept happening. This sort of proactive social media customer service can make customers feel like you’re championing their success and striving to provide them with the best experience.
3. REI’s Instagram

REI is an outdoor gear brand that provides excellent customer service on its Instagram profile. You’ll find a response for nearly every urgent customer query, and some non-urgent ones, too. The brand is friendly, personable, and informative in its responses — it never feels like a customer’s query is bothersome or unwarranted to them, even the ones that bring up competitor retailers.

In the above example, a customer complained that REI’s online store was running out of a certain size of a shoe. REI responded in a friendly way and let the customer know that they expect more inventory soon. Even if the customer already fixed the issue by going with another retailer, REI still responded — and that’s a sure way to secure that customer’s business for the future.
4. Briogeo’s Facebook

Briogeo is a haircare brand that focuses on “six-free” formulas. On its Facebook profile, the brand constantly provides customer service by responding to nearly every comment with a friendly, informative tone. It ends every comment with a heart emoji, which makes it feel like you’re talking to a friend on the other side.

Its products are available at a few select retailers, so when a customer from Iraq reached out, Briogeo promptly provided a list of retailers that the customer could shop from. Plus, it left its DMs open for the customer if they had any additional questions. Like Briogeo, be sure to answer queries promptly, and be sure to leave the door open for more questions if they come up.
Something you might’ve noticed was that customers rarely responded to the brands, and this is okay and even expected. Replying to the comments in the first place is enough to make your customer base feel heard and make your brand look engaged on social media.
Now that we’ve covered some examples of social media customer service, let’s go over the quintessential question: Which platforms should you focus on to start?
Best Social Media Channels for Customer Service [Data]
As a business owner, you've probably realized that social media is a great channel for providing customer service. But you also probably discovered there's an array of apps to choose from, and you might be wondering which one (or ones) your business should leverage for customer support.
To find out, we surveyed over 300 people in the United States to see which social media platforms they use first when contacting customer service. Below are the results.

The most notable insight from our survey was that most people preferred to call or email for customer support instead of using social media. Even though social media has gained popularity, it's still not the most common method used for contacting customer service teams. With that in mind, it will be interesting to see whether this percentage (52%) decreases over time, as more social media apps are developed and more businesses invest in this medium for marketing and customer service.
Another interesting takeaway is the popularity of individual social media apps. As we can see in the chart above, Facebook leads the way as the most preferred channel for customer service and is used by 36% of survey participants. Surprisingly, Instagram edges out Twitter by 1%, with 22% of respondents using it as their preferred social media platform. That's a testament to how popular Instagram has become over the years, as it's one of the fastest-growing social media apps in its industry.
Lastly, WhatsApp is the preferred social media platform for 13% of respondents. This makes for a good reminder that Facebook, Instagram, and Twitter — while popular — aren't your only options for customer service.
Depending on who your customer base is, and where they're engaging with brands, there are plenty of other channels you can use to support your audience. You just need to understand the types of problems they're facing and the channels they think will provide a solution.
Social Media Customer Service is the Best Way for You to Grow
Social media customer service is one of the main ways that people will contact your company for questions, complaints, and concerns. That's why it's important to have a strategy for how you'll respond and monitor this outreach. With the right strategy, you’ll be on your way to creating a seamless experience on your social profiles, helping you attract new customers, delight your existing ones, and make your business grow better.
Editor's note: This post was originally published in January 2018 and has been updated for comprehensiveness.

Social Media Customer Service

![5 Twitter Alternatives for Social Media Customer Service [& Why You Should Keep Them on Your Radar]](https://53.fs1.hubspotusercontent-na1.net/hubfs/53/twitter-alternatives.png)

![More Brands Are Using Social Media Messaging for Service, but Are Consumers Interested? [New Data]](https://53.fs1.hubspotusercontent-na1.net/hubfs/53/social%20DMs%20for%20service_featured.jpg)
![What Is Social Media Listening & Why Is It Important? [+Expert Tips]](https://53.fs1.hubspotusercontent-na1.net/hubfs/53/social-media-listening-1-20240724-8583751.webp)