-2.png)
Honestly, I prefer Canva for quick design, but in this guide, I’ll walk you through how to create an infographic in PowerPoint. I’ve been using it since my college days and know all these little hacks to make it look nice, flow smoothly, and, of course — stick in people’s minds.
Even better, I'll throw in some helpful tips and give you examples of different types you can work with using our 15 fabulous infographic templates for free within PowerPoint.
Table of Contents
Marketing Use Cases for PowerPoint Infographics
PowerPoint infographics are a powerful tool to present data-heavy information in an accessible, digestible format — no matter if you plan to disseminate the infographic digitally or in person.
You can also simply use PowerPoint as an infographic maker if it’s your preferred design software.
15 Free Infographic Templates
Build better infographics with these free designed templates.
- Color schemes
- Icons & shapes
- Fonts
- Eye-popping themes
Download Free
All fields are required.
Here are some of the ways I like to use PowerPoint infographics:
1. Presenting a Case Study
I briefly had to write case studies at previous jobs, and let me tell you — they are the bane of my existence.
Writing a beautiful, readable case study is far from easy, so I suggest creating a PowerPoint infographic showcasing the key facts of your case study.
You can include crucial information such as the problem your customer experienced, the solution you served, and the outcome.
You can include aesthetically pleasing graphics and dynamic typography — something you may not be able to include in a traditional, one-page case study.
2. Presenting Research
Since I write for HubSpot's Marketing Blog, I often present data, trends, and research in my content.
If you‘re in the same boat, you’ll be happy to know you can use all the data visualization options PowerPoint offers to present your data in a digestible way.
Since the infographic will be larger than a typical slide, you can be as descriptive as you want. However, if you’d like to reuse the same information, you only need to copy it into a new presentation.
Pro tip: HubSpot’s Content Hub is all-in-one, AI-powered content marketing software that helps marketers create and manage content. You can start for free here.
3. Presenting a Pitch
You can use PowerPoint infographics to present a pitch to stakeholders or potential buyers.
In this case, your infographics can include data points, testimonials, expected results, and even descriptions of the prospect’s problem to emphasize the importance of purchasing your solution.
Images and graphics can be more effective than just words, and since you’re in PowerPoint, you can create an infographic of any size, including the horizontal 16:9 dimensions.
Want to create sales presentations that actually sell?
HubSpot’s free sales training lesson shows you how to answer prospects' questions, focus on their needs, and motivate them to buy.
4. Presenting a Multi-Step Process
Whether you’re onboarding a new team or informing stakeholders on a new process, a PowerPoint infographic is an effective medium to communicate your message.
PowerPoint comes packed with plenty of “process” graphics, such as text-filled arrows, cascading charts, and grids.
5. Presenting an Announcement
A complicated company announcement — with many moving parts or components — merits an infographic to make it easier for stakeholders to read and understand.
You can create one right in your PowerPoint presentation and include all pertinent information in one convenient slide.
Alternatively, you can use PowerPoint as a design tool and simply download your infographic for easy saving and sharing.
Did you know you can upload your PowerPoint presentations to HubSpot?
Just head to Library > Files, click Upload files, and select your PowerPoint from your computer – or simply drag and drop it in. Once uploaded, you can add it as a downloadable link in emails, landing pages, or blog posts.
Keep in mind that files are public by default, so if needed, you can adjust the visibility settings in HubSpot.
How to Create an Infographic in PowerPoint
- In the Design Tab, adjust the Slide Size to best fit your infographic.
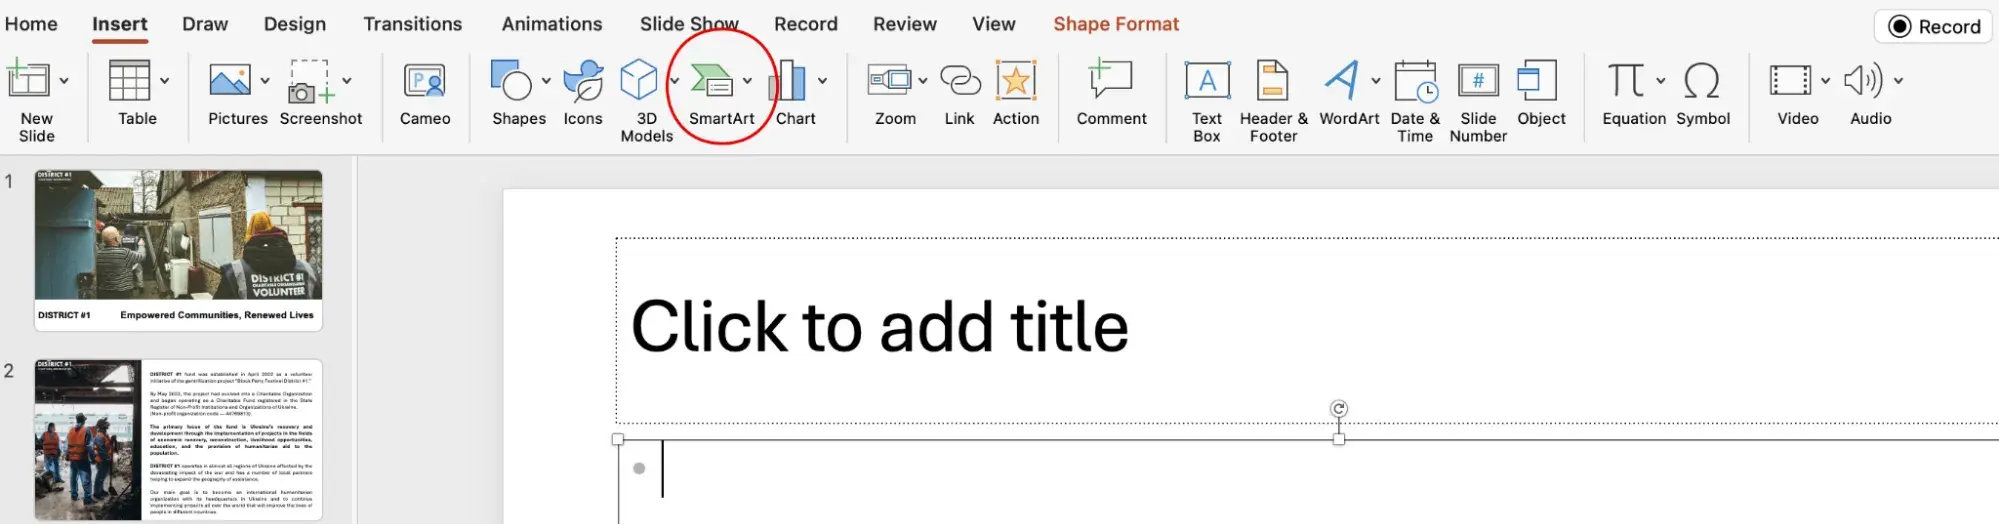
- Select SmartArt from the PowerPoint navigation bar.
- Find a graphic that fits your data from the Process menu.
- Add or remove data points, time stamps, or other key information.
- Insert your data into the graphic.
- Edit the text and imagery of your SmartArt graphic.
- Adjust the color scheme to match your story.
- Use numbering to improve visual flow.
- Add finishing touches and polish the layout.
Okay, now you know the different uses for PowerPoint infographics — time for me to show you what you're here for.
For better comprehension, I'm going to walk you through how to make a simple timeline infographic in PowerPoint.
1. In the Design tab, adjust the Slide Size to best fit your infographic.
To begin making an infographic from scratch, you have to readjust the size of the PowerPoint Slide to give you more space to work with.
Begin by opening a new PowerPoint. In the top navigation bar, click on Design and select Slide Size.
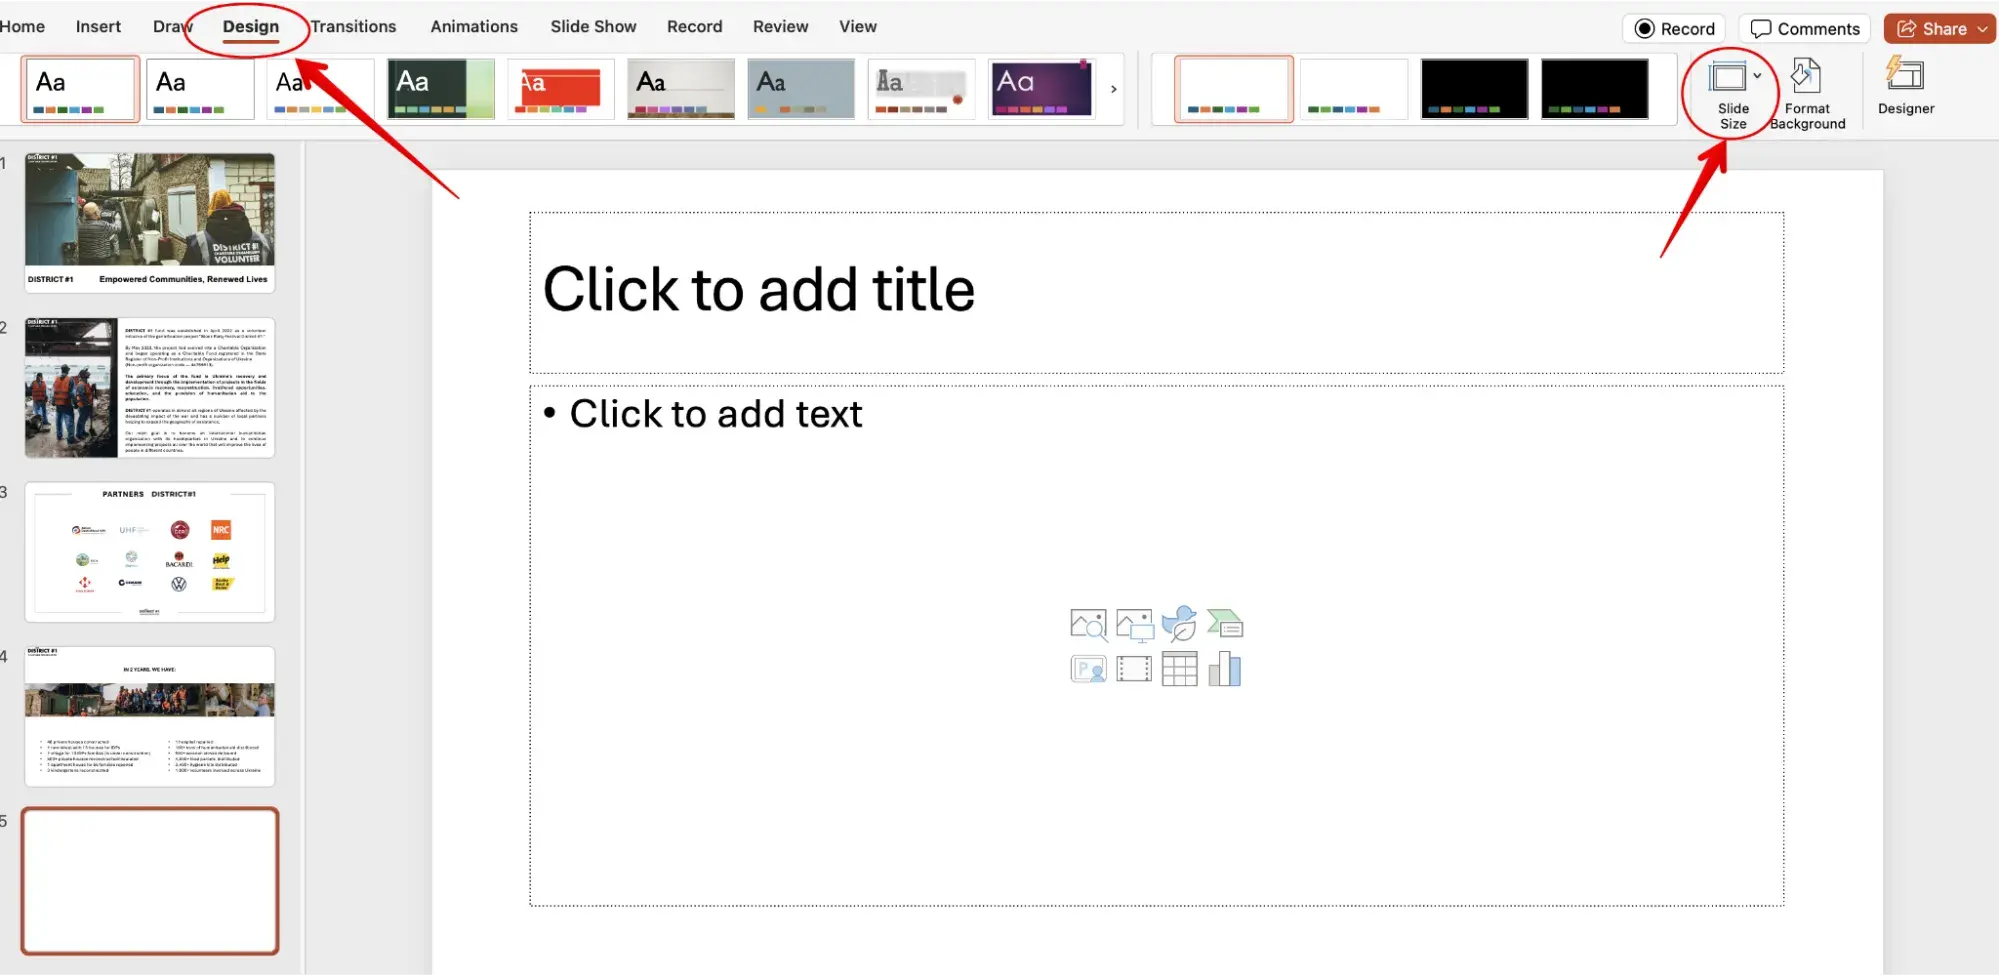
Then, in the drop-down menu, select either one of the predetermined sizes or click Page Setup.

Input your preferred width and height dimensions and click OK.

2. Select SmartArt from the PowerPoint navigation bar.
To make a timeline graphic in PowerPoint, suitable for any infographic, open PowerPoint and click Insert from the top navigation bar.
Then, select the SmartArt icon beneath the navigation bar, where you'll find several categories of graphics to choose from.
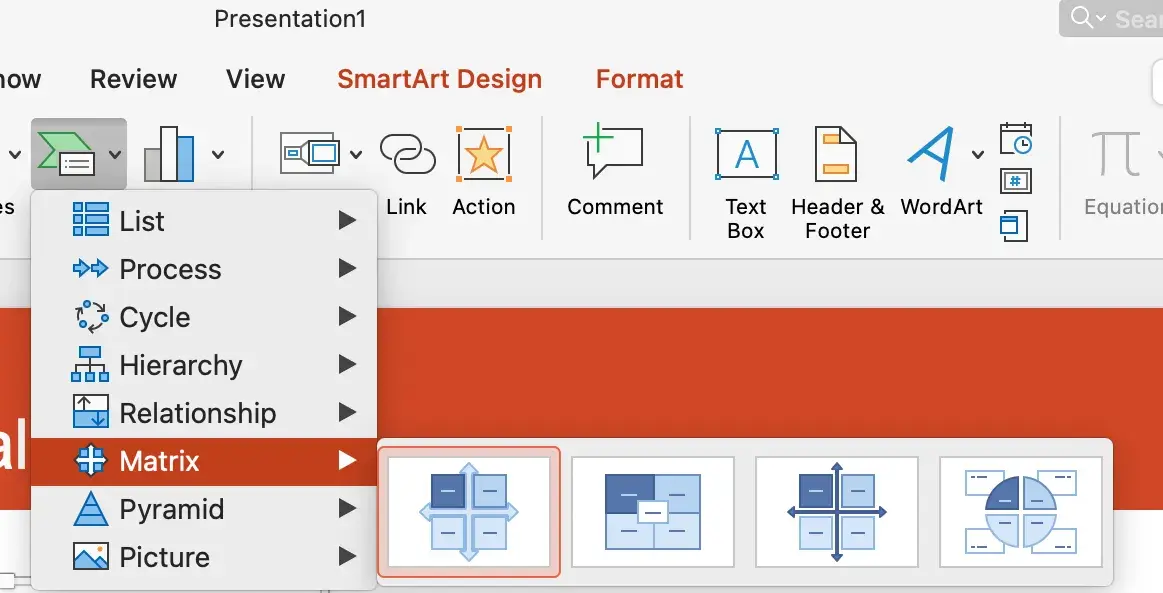
3. Find a graphic that fits your data.
Once you click on SmartArt, you'll find the options from lists to pictures. I picked the Matrix one for my needs:
4. Add or remove data points, time stamps, or other key information.
Once you've inserted this graphic into your first PowerPoint slide, you can add or remove icons to match the types of data and inputs you’re presenting.
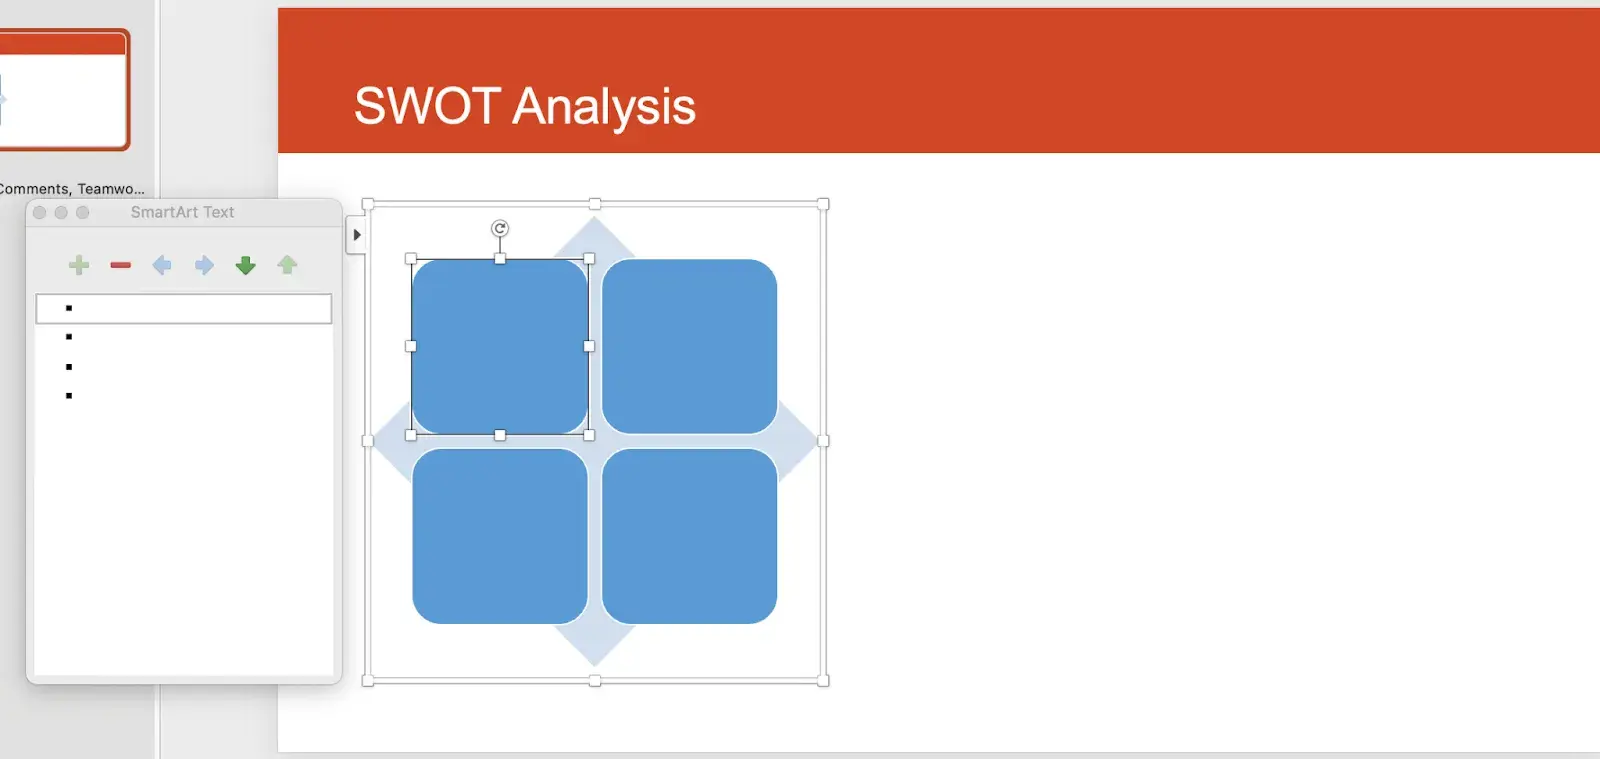
5. Insert your data into the graphic.
At this point, the size of your graphic should match the amount of data you have.
Begin to fill your graph with the information you plan to report and explore PowerPoint’s excellent drag-and-drop features to help arrange graphics as necessary.
15 Free Infographic Templates
Build better infographics with these free designed templates.
- Color schemes
- Icons & shapes
- Fonts
- Eye-popping themes
Download Free
All fields are required.
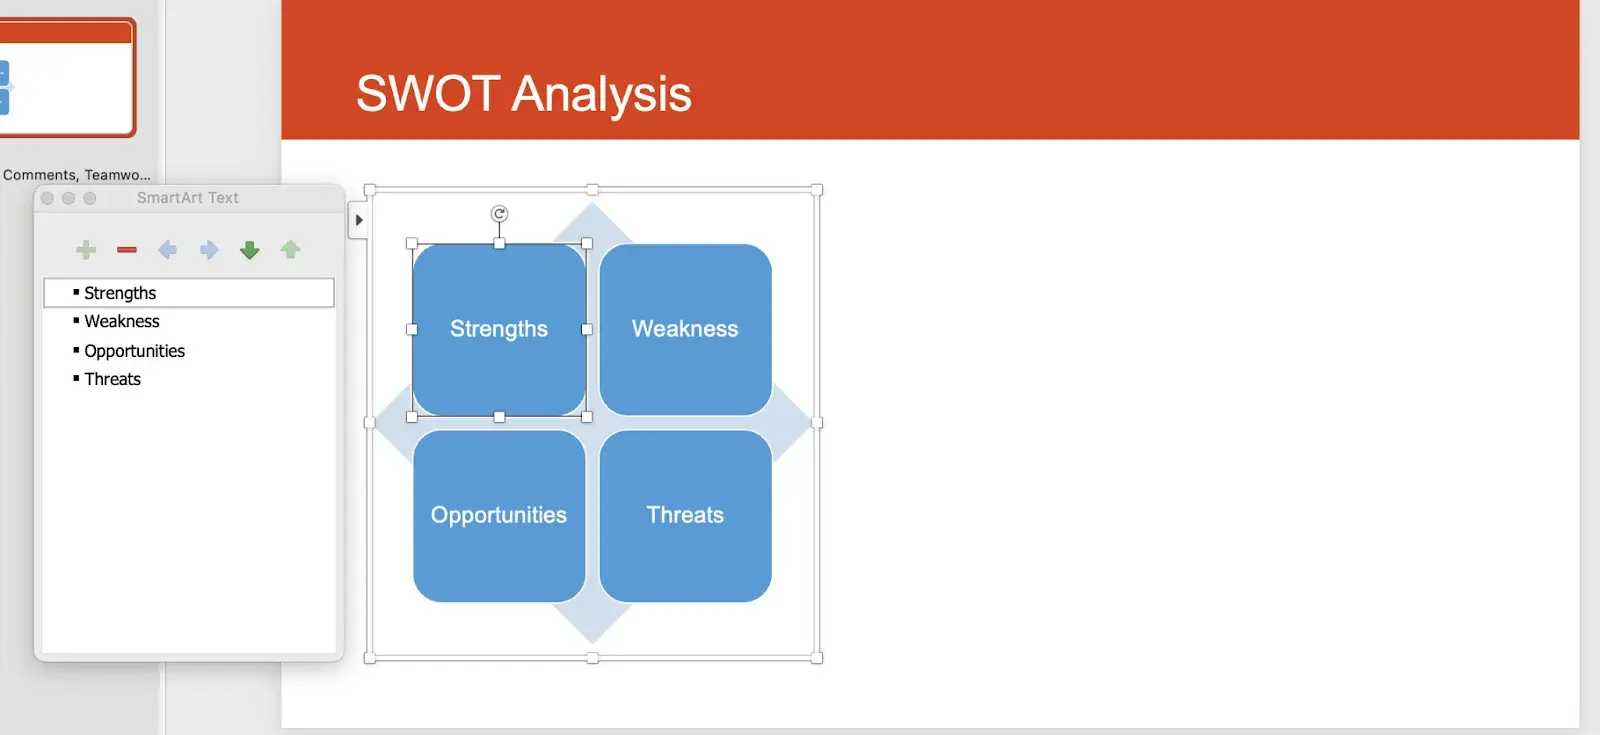
6. Edit the text and imagery of your SmartArt graphic.
As with the other graphics available in PowerPoint's SmartArt, you can edit the text and the images associated with your timeline to your liking.
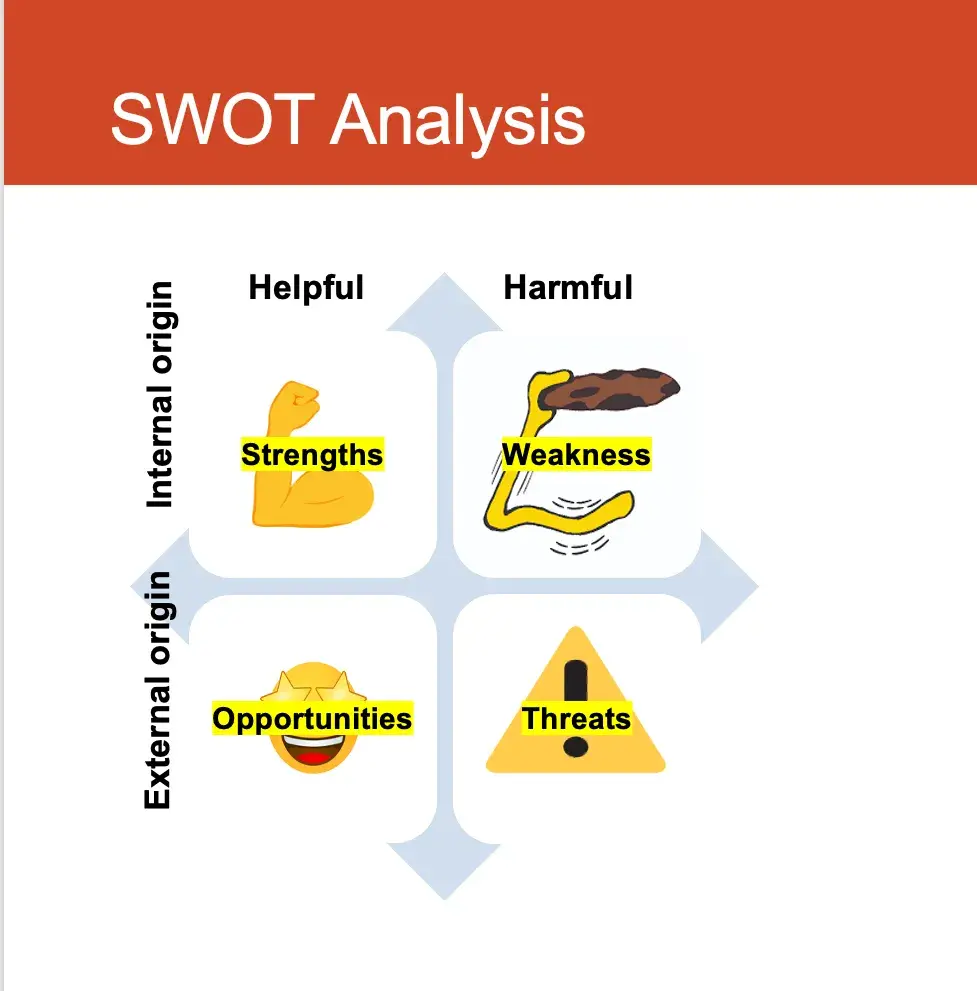
I’ve added four words to represent each part of the SWOT analysis.
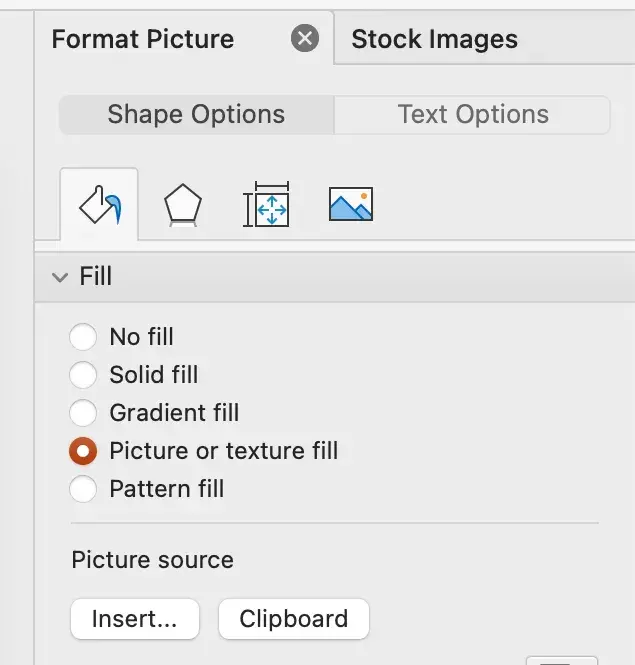
To insert images into my Matrix graphic, I right-clicked the square landscape icon and selected “Format Shape.”
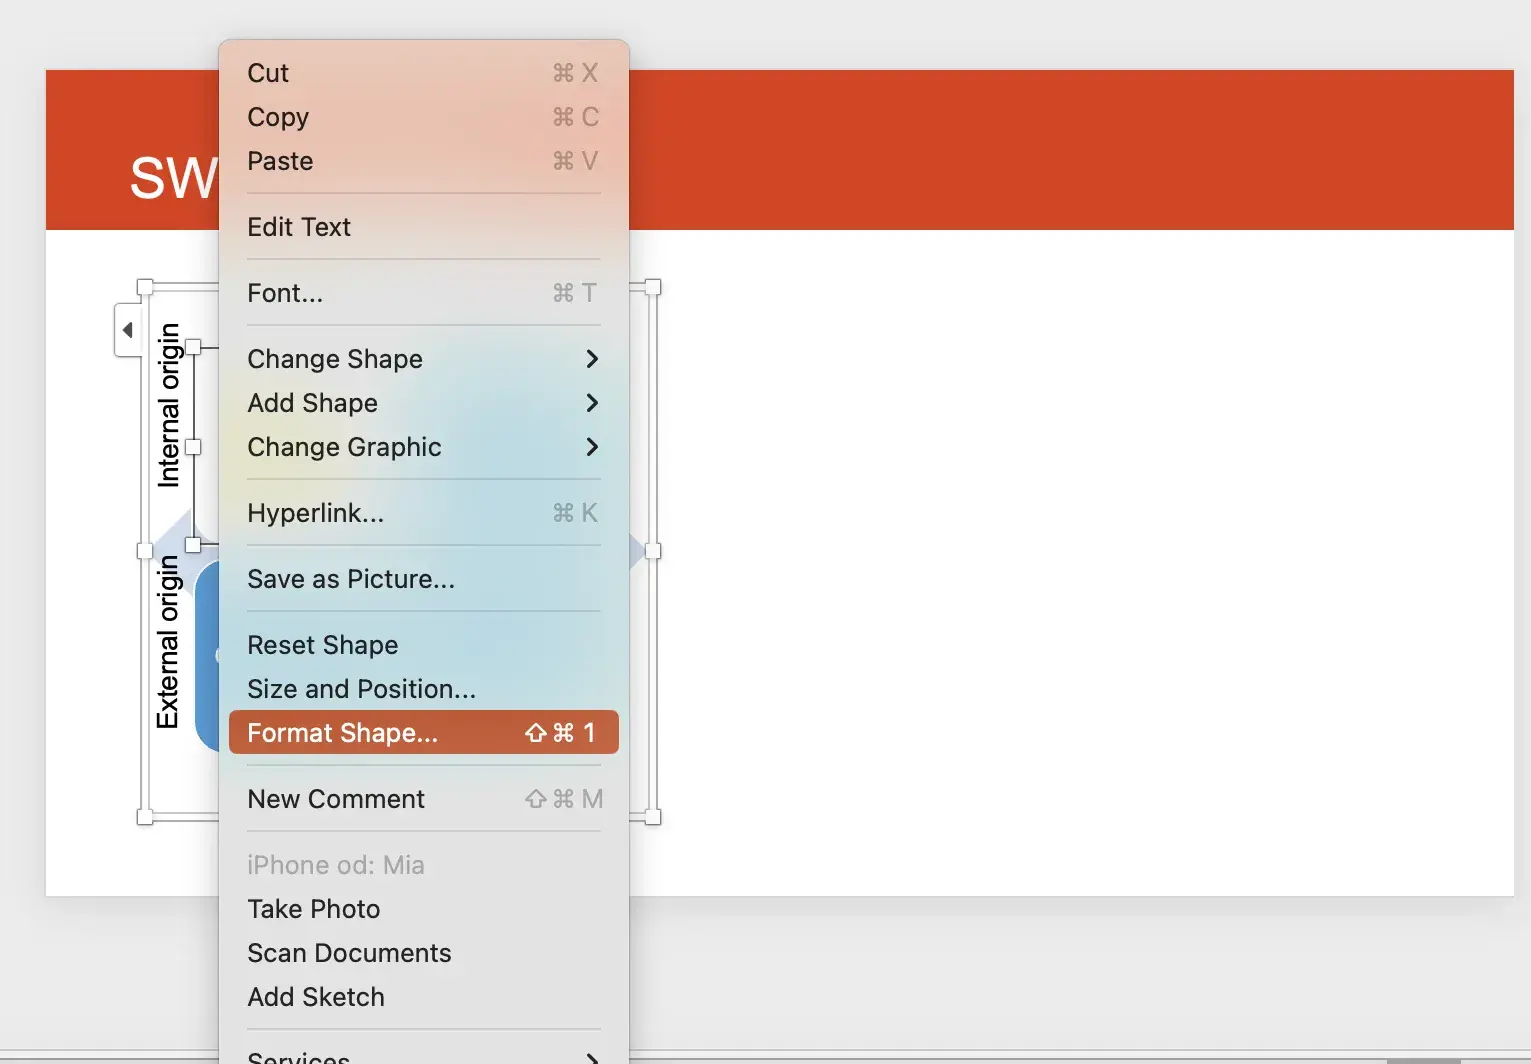
Then I chose “Format Picture” → “Picture or texture fill” and uploaded one image to each of the rounded squares.
Here’s how it looked once I uploaded all of them and highlighted the text.
To show you what you can do further, I decided to create another slide. I made up a brand called Green Fairy for this purpose, pretending I wanted to highlight its strengths for SWOT analysis.
HubSpot’s SWOT Analysis Template helps you assess strengths, weaknesses, opportunities, and threats — plus, it includes a step-by-step guide, a real-world example, and a customizable worksheet to turn insights into action.
Get it now to save time on designing.
7. Adjust the color scheme to match your story.
I went to SmartArt again, but this time, I chose the Vertical Curved List.
Since the original had only three fields, and I needed two more, I added them by right-clicking → Add Shape → Add Shape After.
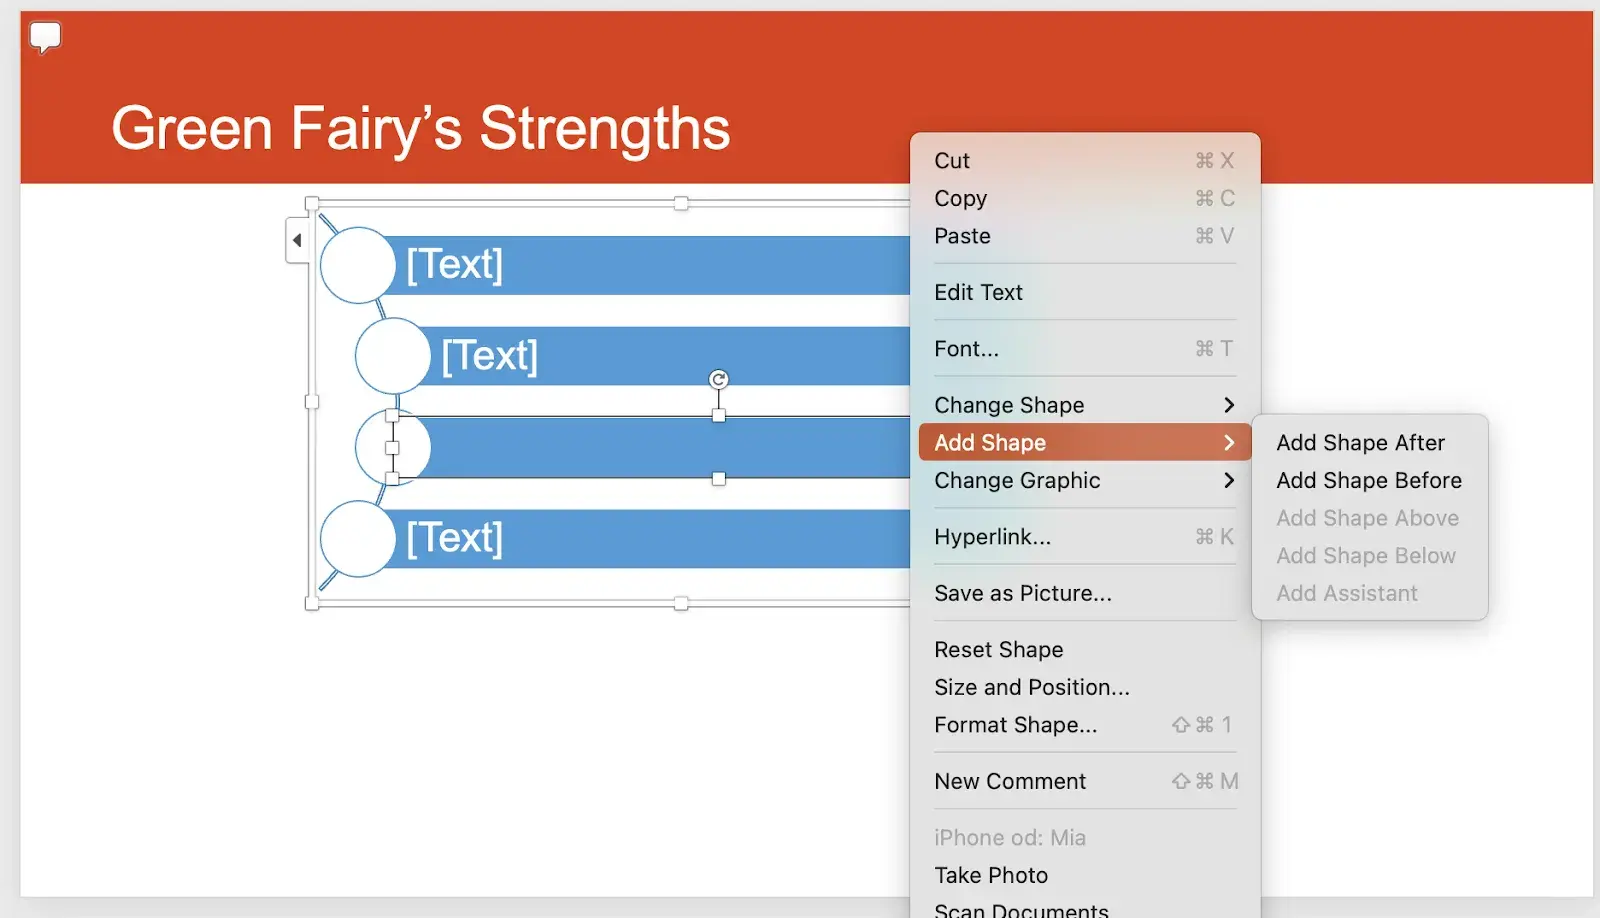
Then I added text to each box, so it initially looked like this:
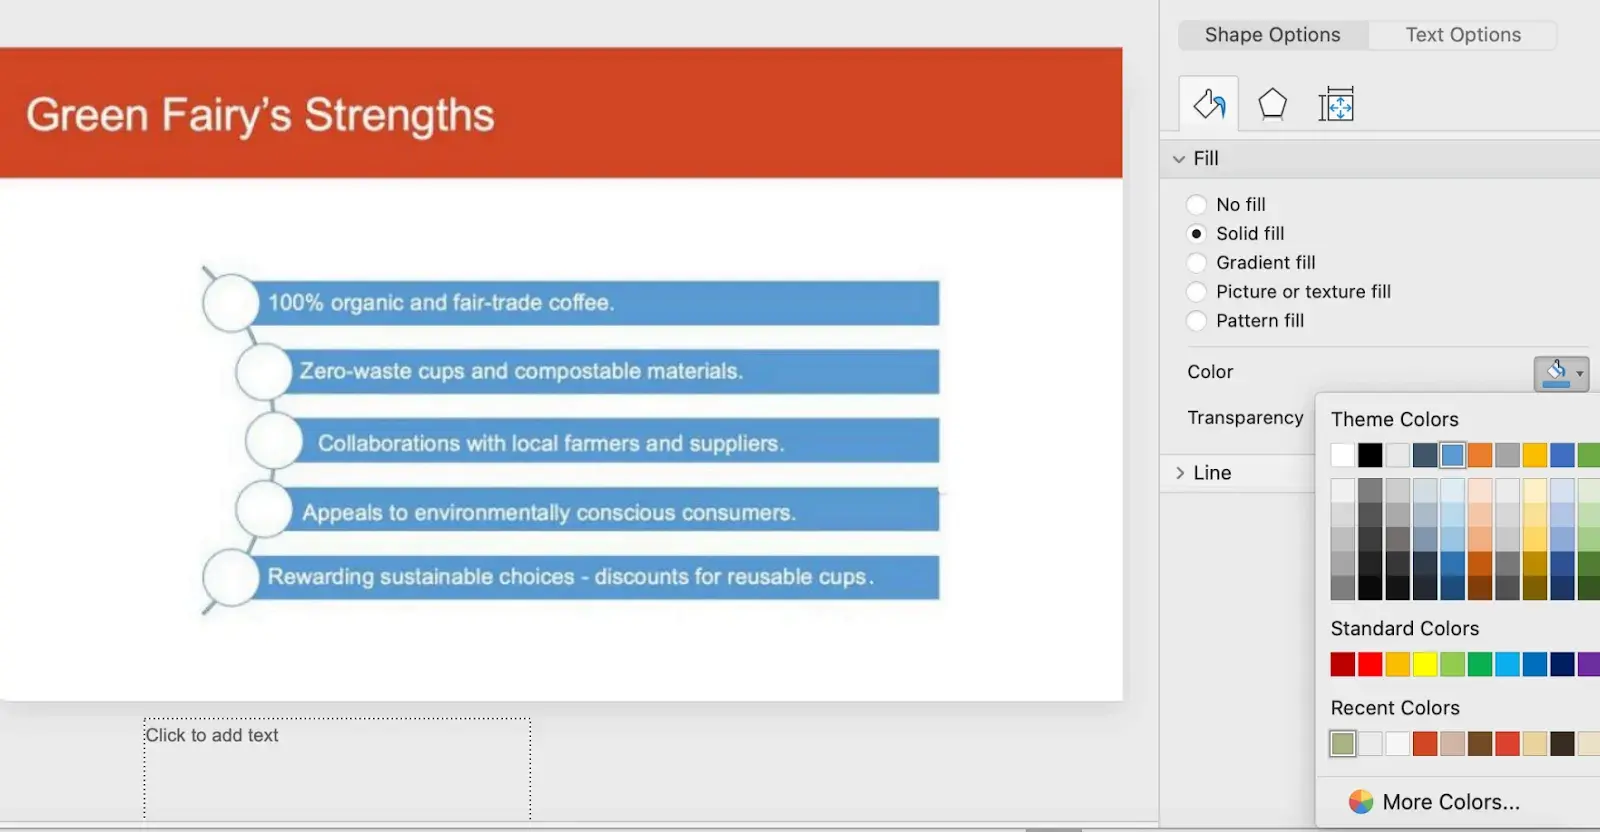
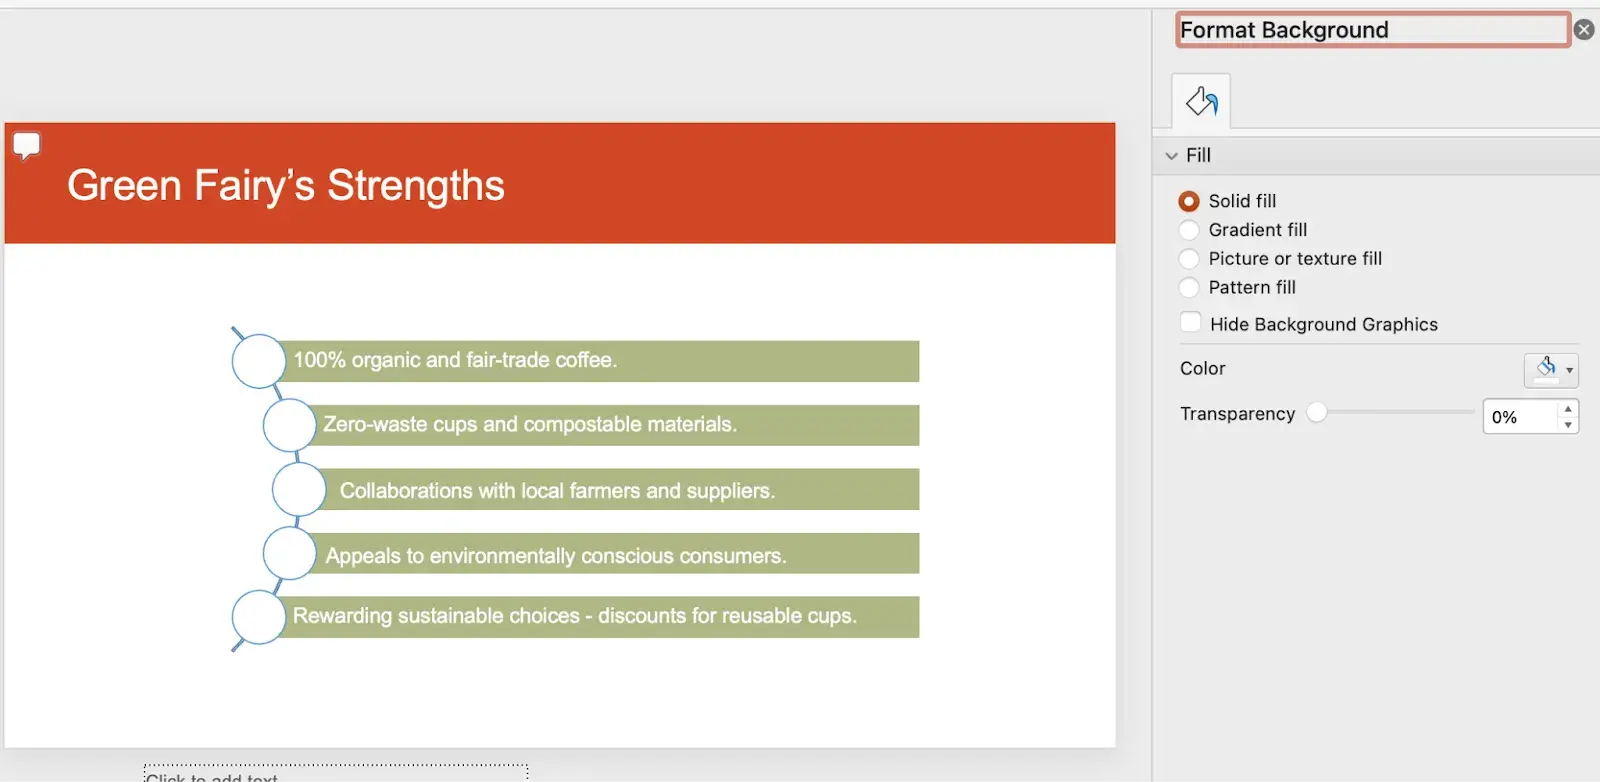
Honestly, I didn’t like it. Something felt off. So, I right-clicked, went to Format Shape → Fill, and switched it to green.
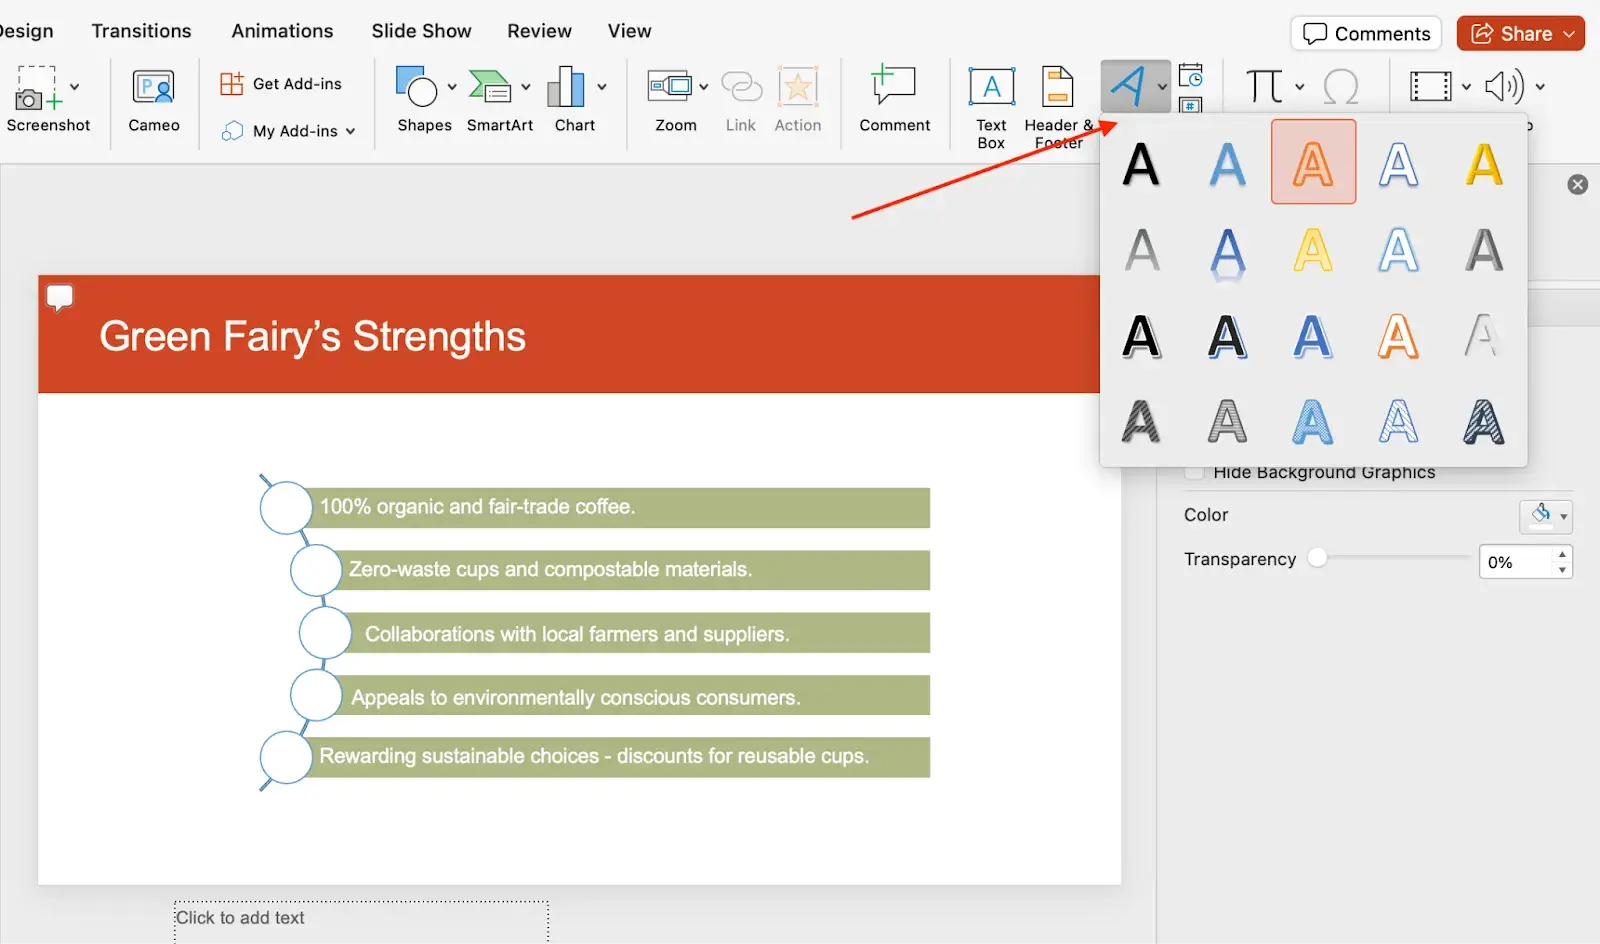
8. Use numbering to improve visual flow.
At this point, I wanted to add numbers to the circles, so I went to Insert → WordArt and picked a style I liked.
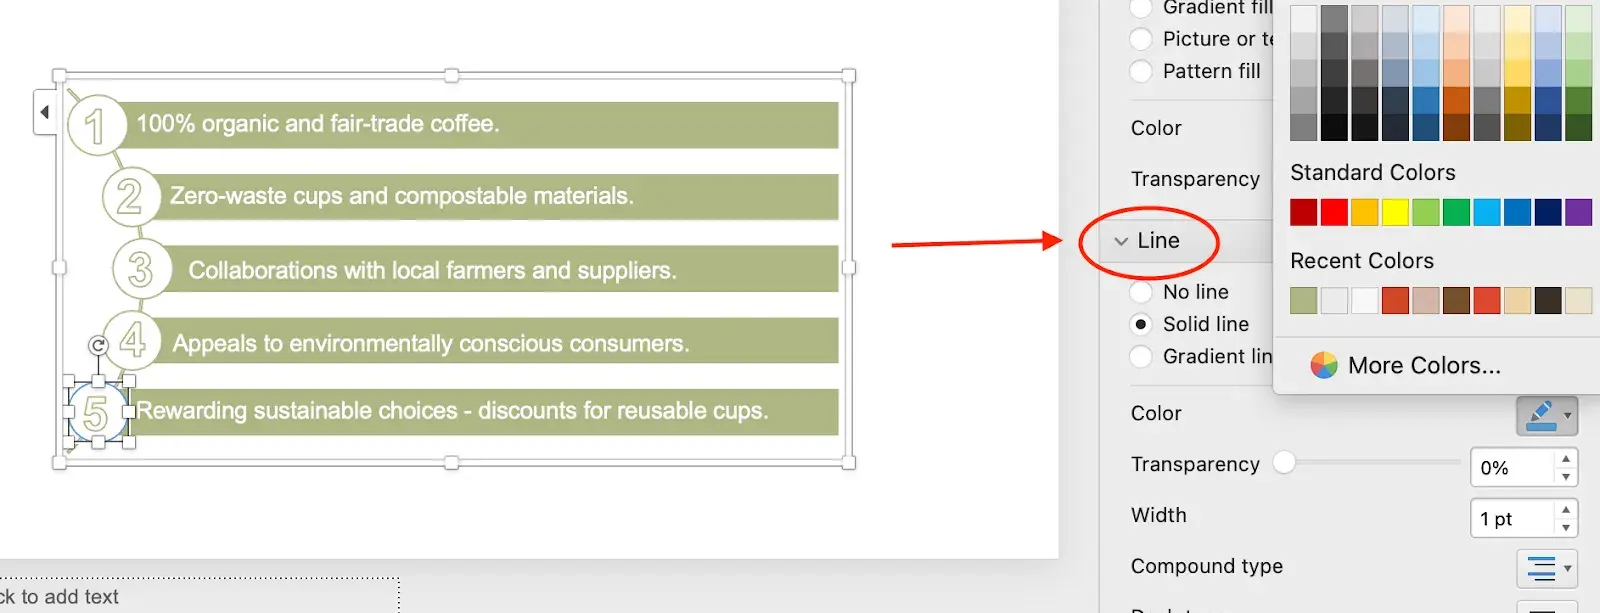
Now, it was looking better, but I didn’t like the blue color of the curved lines and circles, so I decided to change them to match the rest. I selected the object, right-clicked → Format Shape → Line, and picked a new color.
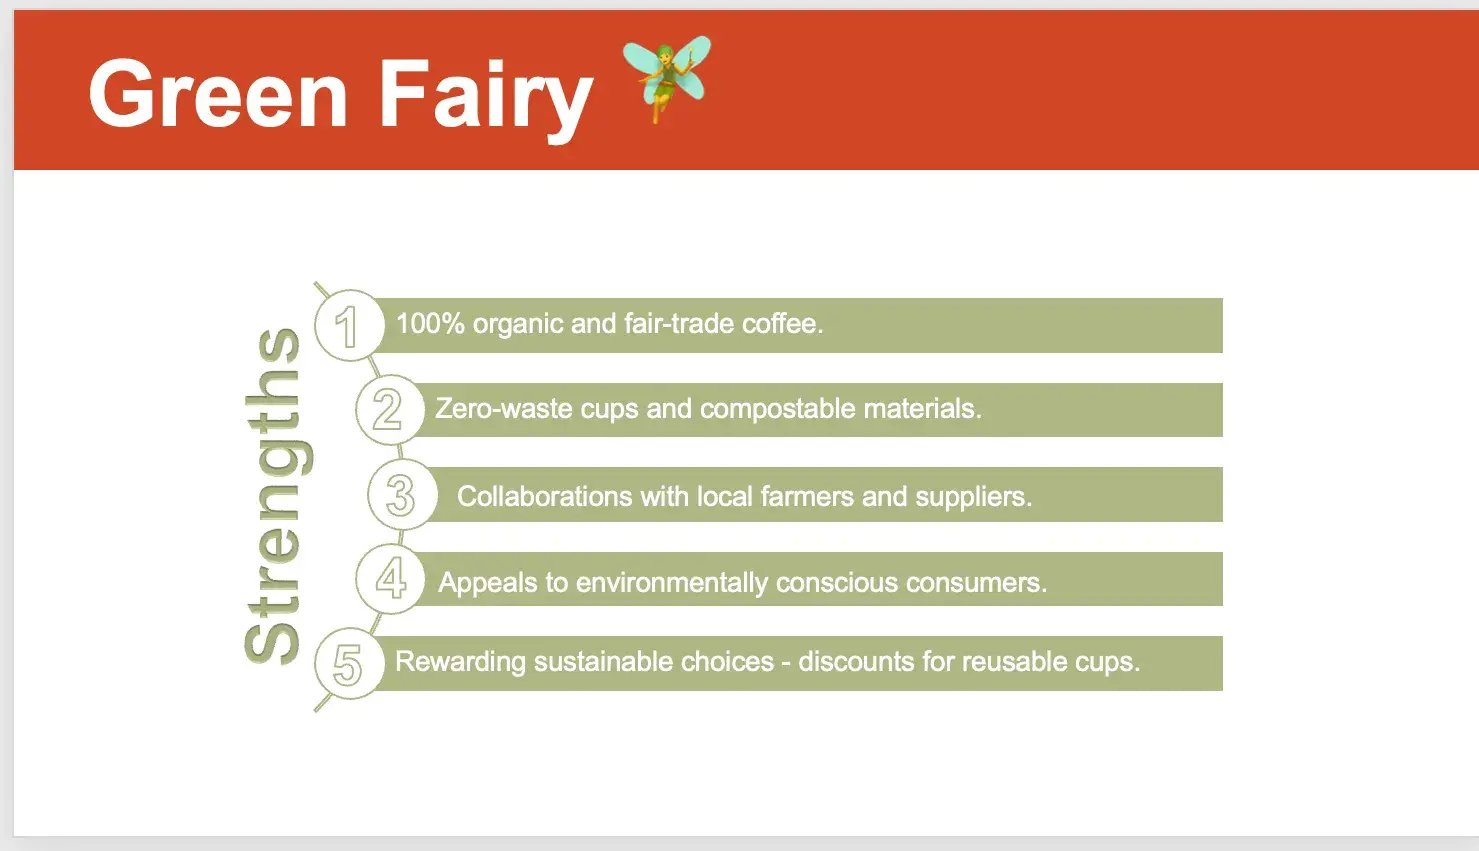
9. Add finishing touches and polish the layout.
It was almost perfect, but I still wanted to fine-tune it because the left side felt empty and disconnected. I tested how it would look with some text there.
I went with WordArt again, picked a font I liked, and added the word “Strengths” on the left to tie everything together.
Basically, you can design your infographic however you want – adding background colors, more visuals, or other elements to make it stand out. This was just a basic example, but there are many ways to refine it and make it look even better, more interactive, and more catchy.
If these “design” things are not your cup of tea, you can download our infographic templates that open directly in PowerPoint so you can start creating faster and easier.
PowerPoint Infographic Tips
1. Keep your infographics simple.
I'm a very wordy person in general. I tend to overexplain in regular conversation, and sometimes, I have to remind myself not to use so many unnecessary words to explain simple concepts in my writing.
So, naturally, my infographics were muddled with too much information, photos, and long sentences when I first started making them early into my career. Eventually, I learned the value of K.I.S.S. (Keep It Simple Sweetheart).
When designing your infographics, keep sentences short and only include the most crucial information. Imagery is helpful, but don't go overboard. Ask yourself if this image or icon helps illustrate your point or if it is just distracting.
15 Free Infographic Templates
Build better infographics with these free designed templates.
- Color schemes
- Icons & shapes
- Fonts
- Eye-popping themes
Download Free
All fields are required.
2. Use complementary colors.
Use a color scheme that incorporates more than 3-4 colors that complement each other. Even better, stick to your brand‘s colors so your infographic fits with your organization’s aesthetic.
Avoid too many colors or ones that clash. Otherwise, your infographic will look too busy and will distract away from the information you're trying to convey.
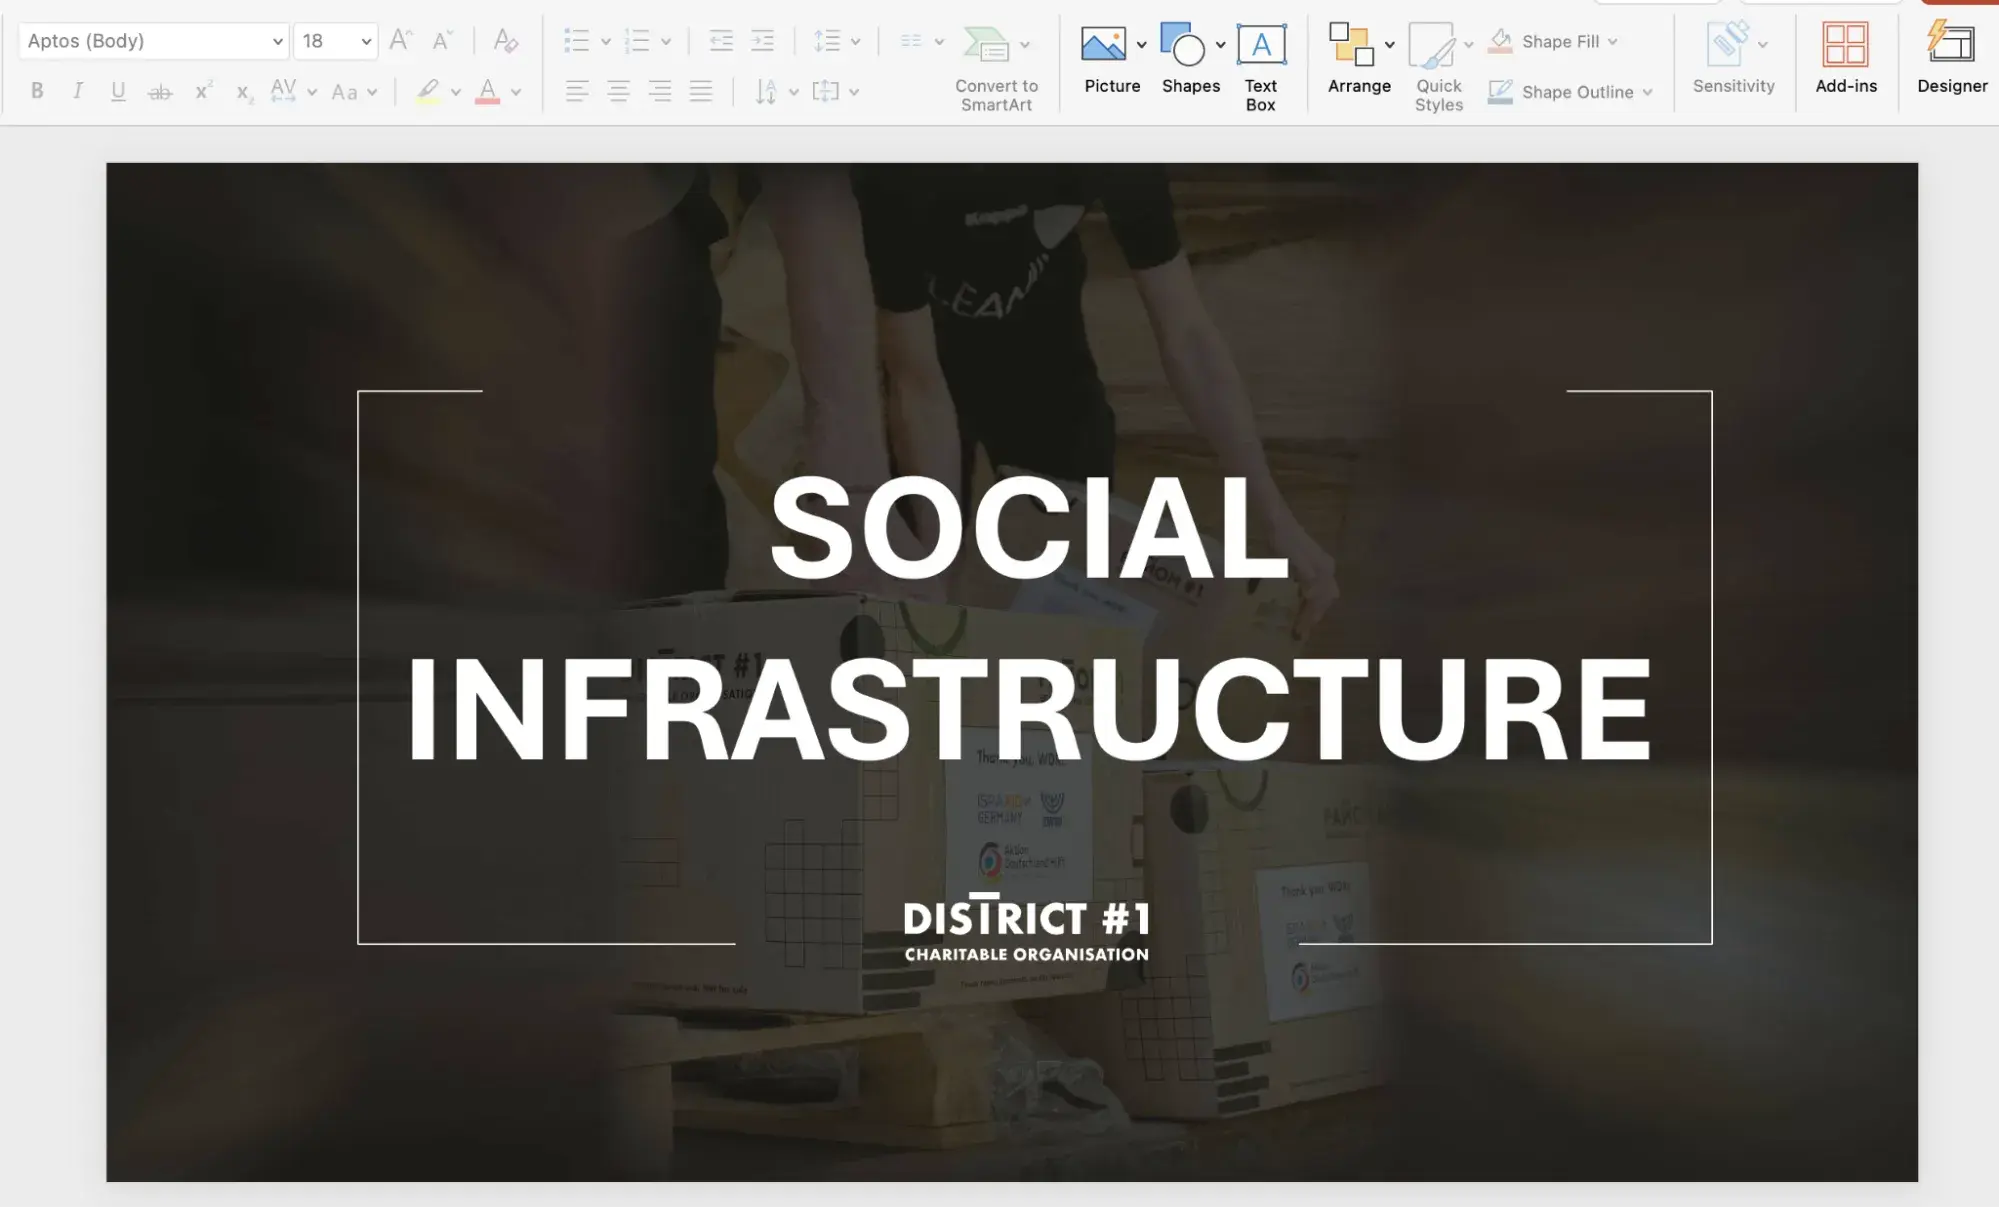
3. Jazz it up with icons, borders, and fonts.
I know I said to keep it simple, and you should, but that doesn‘t mean you can’t have a little fun with icons, borders, and fonts.
You still want your image to stand out, so consider incorporating these elements (sparingly) to leave a lasting impression on your audience.
See how effective these lines are on the category slide in District #1’s presentation.
4. Emphasize numbers.
If you‘re presenting quantitative data, use your color scheme to emphasize crucial numbers. Use the boldest and/or brightest colors to draw viewers’ eyes to the numbers.
You may also want to use shapes like circles or squares to further highlight the information.
Are PowerPoint infographics useful for marketers?
Absolutely. A well-designed infographic in PowerPoint can make a huge difference in how marketing data is received.
From experience, visuals help a lot with these three things:
1. Presenting Results & Pitching
A clear, data-driven infographic makes budget requests simpler to understand – and more likely to get approved.
Actually, people are 30 times more likely to initiate payment when prompted by visuals.
Also, when pitching clients and sending proposals, a compelling visual story often wins over long blocks of text. DemandSage research shows that people remember 65% of info when paired with a relevant infographic.
2. Aligning Teams on Strategy
Infographics keep marketing plans from getting lost in translation across departments. Speaking from experience – laying out a strategy without visuals or a solid presentation is a waste of breath. People hear it, nod, and forget five minutes later.
And if we take into account that our brains process images up to 60,000 times faster than text, it’s easy to see why infographics are such a powerful tool for communication and better understanding.
Plus, when the team hits a roadblock or blanks on something, they can always re-open this presentation and quickly find what they need without back-and-forth.
3. Internal Training & Onboarding
A quick visual guide can be more effective than a lengthy document when training new team members.
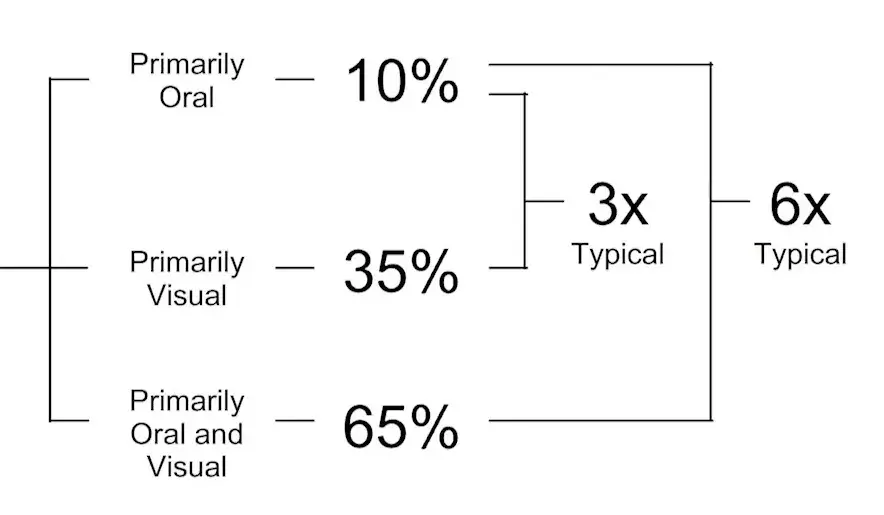
Dr. John Medina says we forget 90% of what we hear after three days. But throw in a picture, and suddenly, we remember 65%.
Want to generate even more leads with visuals and other marketing tools? Try out HubSpot Marketing Hub — a leading AI-powered marketing software and drive revenue with memorable campaigns.
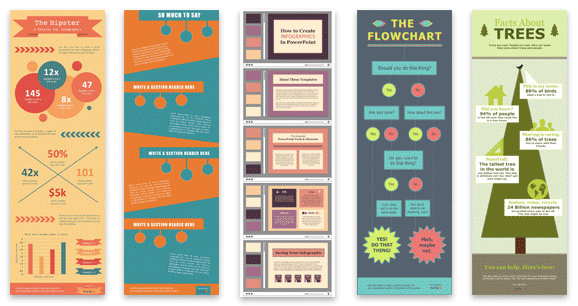
PowerPoint Infographic Examples
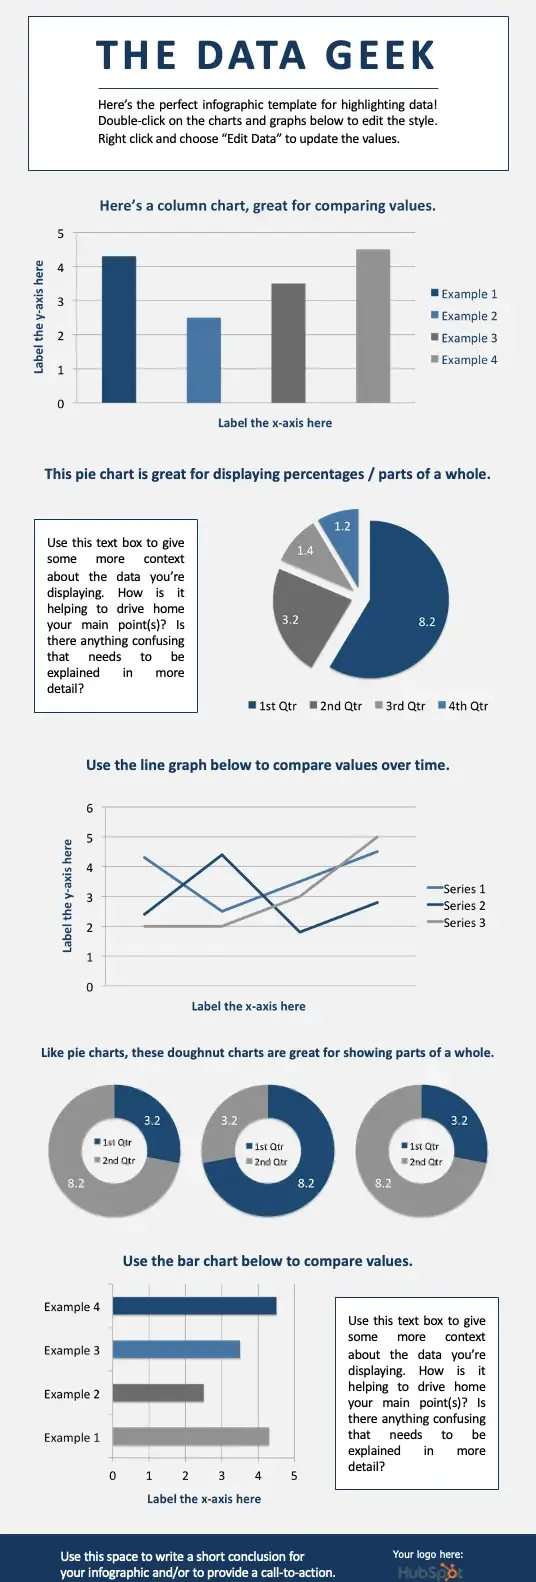
1. Data-Centric Infographic Example
We've loaded this template with a variety of different charts and graphs, which you can easily update with your own data. (Just right-click on a graph, choose Edit Data, and you'll be able to customize the values in an Excel spreadsheet.)
What to Add to a Data-Centric Infographic
- Column chart: Use for comparing different categories or for showing changes over time (from left to right).
- Pie chart: Use for making part-to-whole comparisons. (Note: They work best with small data sets.)
- Line graph: Use this visualization to show data that changes continuously over time. Ideal for displaying volatility, trends, acceleration, or deceleration.
- Doughnut chart: Use a pie chart. This stylistic variation allows you to put a number, graphic, or other visual in the center of the chart.
- Bar chart: Use a column chart. (The horizontal bars make it easier to display long category names.)
What I like: I love this infographic because while it highlights a lot of qualitative data, everything ties perfectly together thanks to its color scheme. It sticks to just three colors, keeping the infographic clean and uncluttered.
When to use: I strongly suggest using an infographic like the one above when you need to present a hefty amount of crucial data as part of a cohesive, visual narrative.
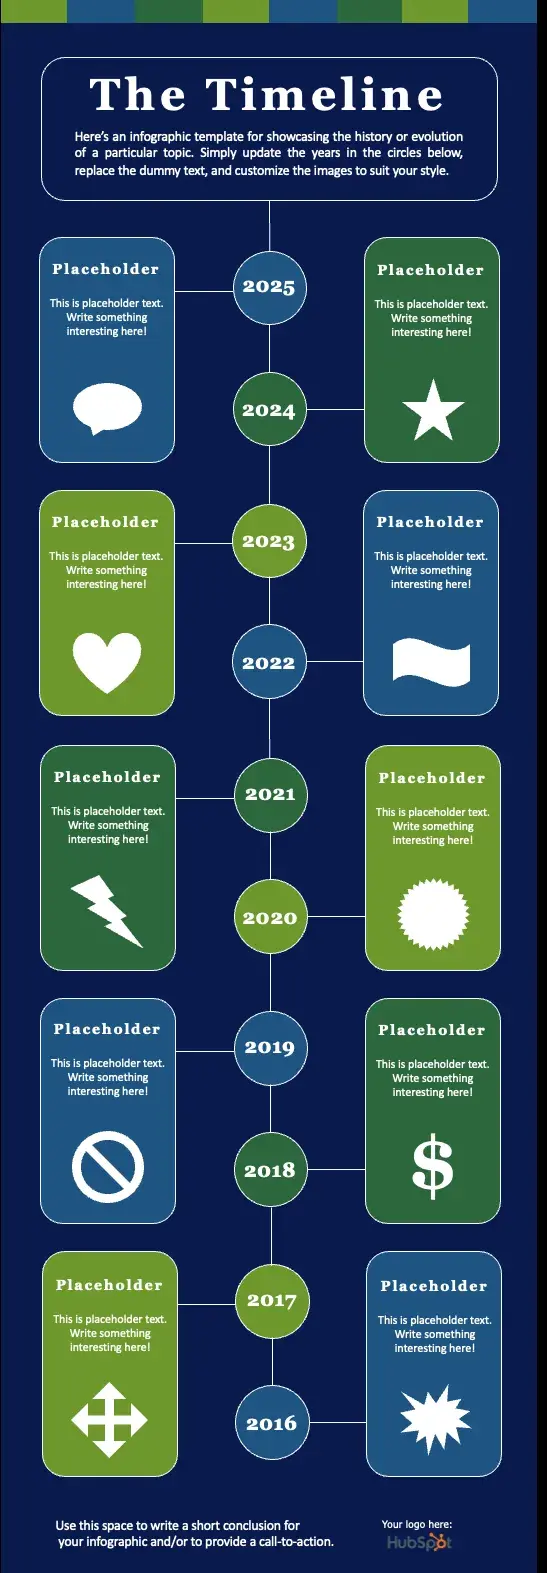
2. Timeline Infographic
Telling the history of a particular industry, product, brand, trend, or tactic can be a great topic for an infographic.
While there are a variety of different ways that you can visualize time — including in a circle, which is what we did with our Google algorithm updates infographic — the timeline is by far the most common and easiest design method to use.
Timeline Infographic Best Practices
- Research. Research. Research: The best timeline infographics aren't just beautifully designed — they also tell a great story based on extensive research. So, before you start the design phase of your infographic, put in the time to surface the best information possible.
- Narrow the scope: Timelines that cover hundreds or thousands of years can certainly be interesting, but they can also require weeks or months of research. To keep your sanity, stick with shorter time periods.
- Keep your copy concise: Infographics are supposed to be visual. If you find yourself writing 100+ words for each date on your timeline, a blog post may be the better content format.
Why I like it: Clearly marked spots for text and images make it easy to customize the infographic. Clean lines, a consistent color scheme, and a balanced layout give it a polished, professional look.
When to use: If you're looking to explain the history of a topic or predictions for the future, a timeline infographic can be a great illustrative tool
15 Free Infographic Templates
Build better infographics with these free designed templates.
- Color schemes
- Icons & shapes
- Fonts
- Eye-popping themes
Download Free
All fields are required.
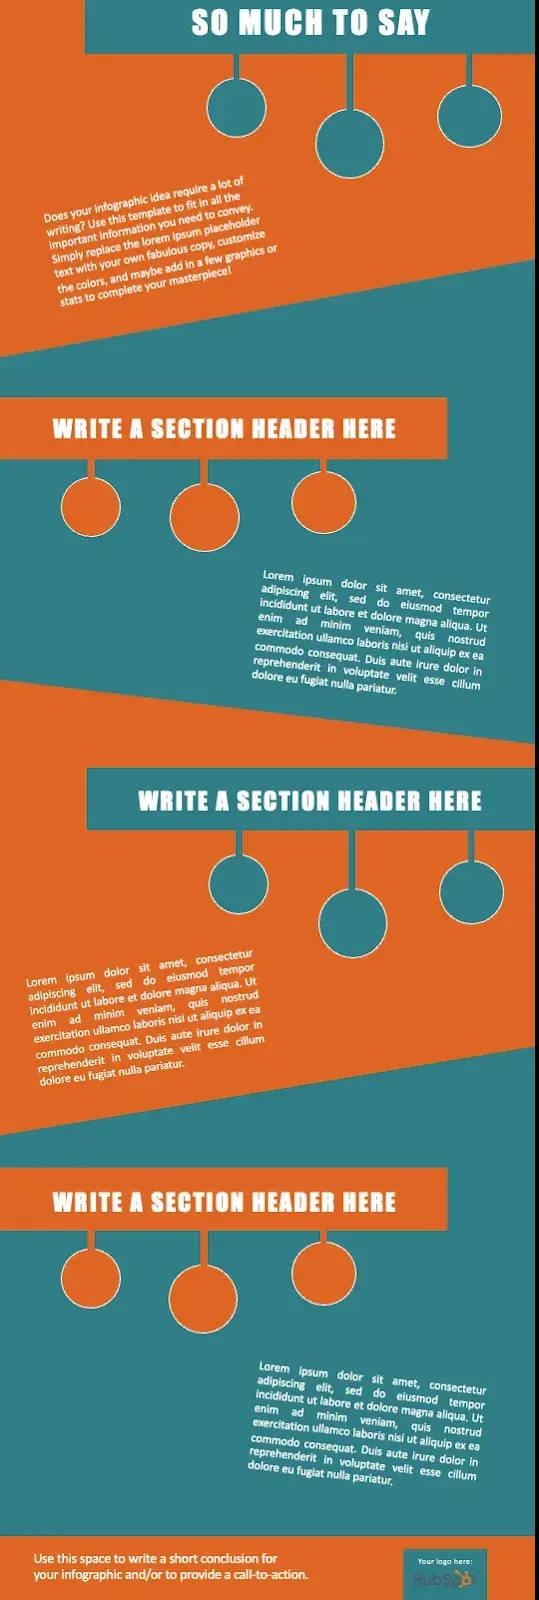
3. Modern Design Infographic
Here, we focused more on making the design feel dynamic instead of sticking to strict straight lines.
We didn’t add any charts except for three circles in each section, but there’s plenty of space if you want to add your own. Just go to Insert > Chart and pick the style you like.
Modern Design Infographic Best Practices
- Experiment with new color palettes. There are tons of free color palettes online. Do a Google image search for “Color Palette.” When you find a palette you like, drag the image directly into your PowerPoint presentation.
- Next, select the Color Fill bucket, choose More Colors, and click on the eyedropper icon. With the eyedropper tool, you can select colors from your palette and use them for elements in your infographic.
- Take the time to manipulate shapes. PowerPoint has an extensive library of shapes — including banners, ribbons, and arrows — that you can use in your infographic design.
By clicking and dragging on the little yellow diamonds that appear on these shapes, you can customize them. For example, you can make the pointy ends of a ribbon longer or shorter. You can also make the body of an arrow thinner or thicker.
What I like: This modern design is sleek, easy to follow, and leads your eyes perfectly through the infographic to digest the information. Plus, there’s more room for creativity here.
When to use: If your infographic is an equal mix of quantitative data and text, this modern design can help you display both types of information seamlessly.
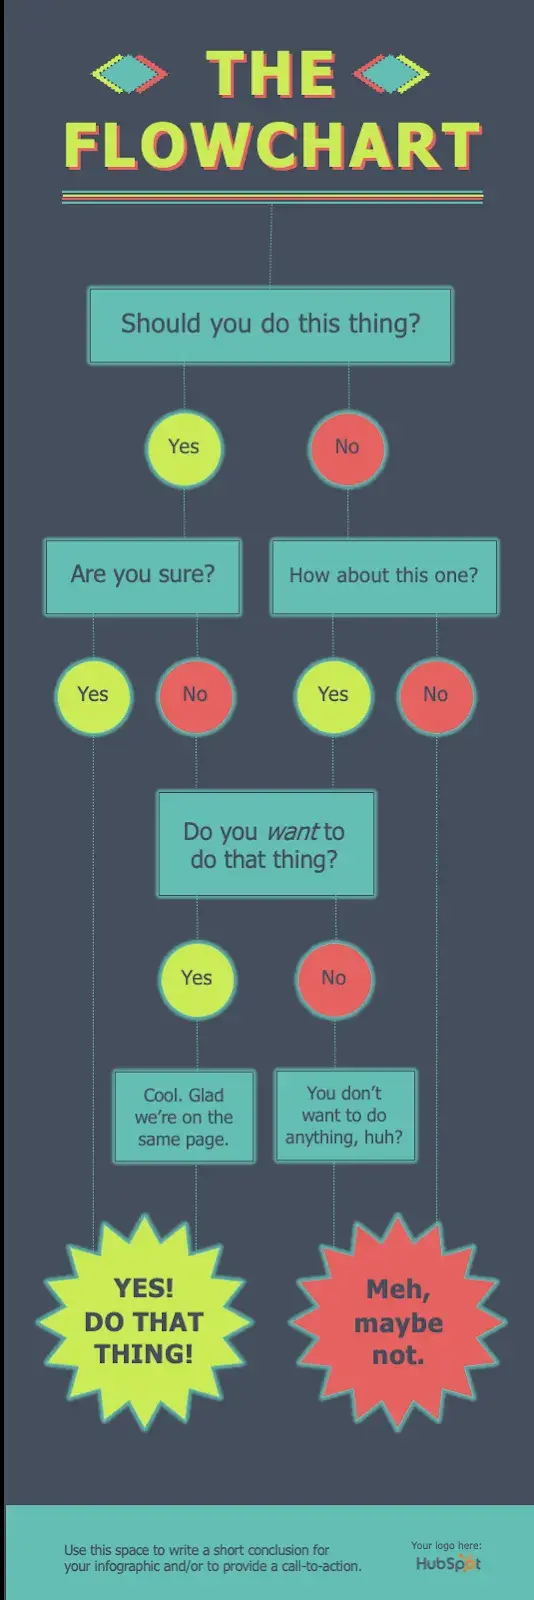
4. Flowchart Infographic
On the surface, a flowchart infographic may appear simple and fun. But I assure you, a lot of thought and planning needs to go into ensuring the different sections logically flow into each other.
In our flowchart PowerPoint template, we created a basic flowchart structure, with positive responses guiding viewers to a conclusion at the bottom left of the infographic.
There are also negative responses guiding viewers to a separate conclusion at the bottom right of the infographic.
Flowchart Infographic Best Practices
- Draw out the branches beforehand. Before you dive into PowerPoint, get out a pen and paper and do a rough outline of your flowchart. Test for weaknesses in your logic by answering questions in every possible combination and seeing where you end up.
For best results, have a friend or coworker run through the flowchart, too.
- The smaller the scope, the easier the execution. The more questions or stages you add to your flowchart, the more difficult it will be to create (and the harder it will likely be for viewers to understand). So, try to narrow the focus of your flowchart.
What I like: Colors and shapes are strategically used to differentiate between positive and negative conclusions of the flow chart. Notice the green circles used for “Yes” and red circles used for “No”.
When to use: I suggest using flowcharts to map out different outcomes and conclusions to your audience to help them follow/understand processes and workflows.
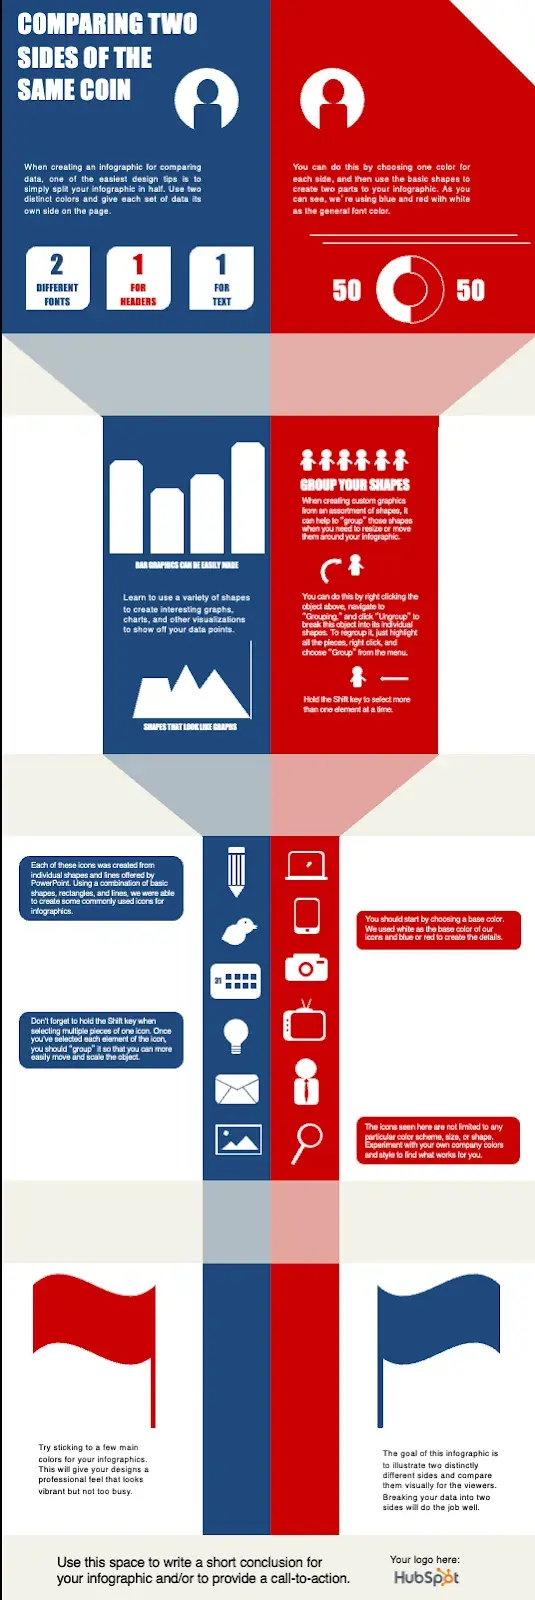
5. Side-By-Side Comparison Infographic
We know sometimes you need an infographic to demonstrate a comparison. That’s why we created the side-by-side comparison infographic template to make it easy for you to compare and contrast two different things.
Side-By-Side Comparison Infographic Best Practices
- Use appropriate data. It's best to use data that can easily be described in a chart. Use pie charts, graphs, or other data points to clearly and fairly compare and contrast.
- Use borders. Adding borders to your images will help make them feel like their part of a cohesive design. In PowerPoint, you can control the size, style, and color of borders under the Format Picture tab.
- Save your infographic as a PNG file. This is a best practice for all infographics but is particularly relevant when publishing an infographic that contains photographs. The PNG extension offers better quality than other options. To save your finished infographic as a PNG file, you simply need to choose File > Save As ... and select PNG from the dropdown.
Ready to create your own side-by-side comparison infographic? Download 15 free infographic PowerPoint templates to get started.
What I like: Both sides of the infographic use complementary colors, which makes it even more appealing by inverting the color scheme in both sections.
When to use: This infographic template is great for comparing different categories, ideas, or results, and since you don‘t need to create or customize a lot of shapes, it’s a lot less work.
Make your slides speak louder than words.
PowerPoint is packed with so many features that help you present ideas in the best way possible. My advice? Always choose the right template. It’ll save you time and effort since you won’t have to build everything from scratch.
But if you prefer to start from zero, at least try to visualize your concept in your head or, even better, sketch it out on paper. This way, you won’t end up with cluttered slides that say a lot yet communicate nothing.
Remember: Nobody wants to sit through a presentation that looks like a bad Wikipedia page. PowerPoint infographics exist for a reason — to keep things smooth, snappy, and actually memorable.
So, if you’ve been pitching ideas or explaining strategies with just words and boring docs, it’s time for a change. Make it visual, make it engaging, and for the love of all things good — make it make sense.
Editor’s note: This article was originally published in March 2013 and has been updated for comprehensiveness.
15 Free Infographic Templates
Build better infographics with these free designed templates.
- Color schemes
- Icons & shapes
- Fonts
- Eye-popping themes
Download Free
All fields are required.
Graphic Design

![AI in Graphic Design: The Pros, Cons and What it Means for Designers [+ Expert Insight]](https://53.fs1.hubspotusercontent-na1.net/hubfs/53/Untitled%20design%20-%202024-10-15T175328.927.jpg)
![How to Create an Infographic in Under an Hour [+ Free Templates]](https://53.fs1.hubspotusercontent-na1.net/hubfs/53/Make-infographic-hero%20(598%20%C3%97%20398%20px).jpg)


![How to Create an Infographic Using Poll & Survey Data [Infographic]](https://53.fs1.hubspotusercontent-na1.net/hubfs/53/00-Blog_Thinkstock_Images/Survey_Data_Infographic.jpg)