Marketers need to report on everything they do, from the number of visits and leads they have generated from different channels to the conversion rates of their landing pages and revenue generated for their company. There isn’t one good metric that sums this up. There are multiple reports and metrics that all must be reported on.
HubSpot’s Reporting Add-on is a central dashboard that combines all of your marketing and sales reports into one interface. It allows both marketing and sales to see all of the metrics they are accountable for as well as their progress toward those initiatives in one place.
The Reporting Add-on is available for any HubSpot customer for $200/month. Start a free 10-day trial to start building your reports. We'll walk you through what you need to do below.
Creating Your First Dashboard
When you first start out with the reporting add-on, you need to decide what you want to include on your dashboards as well as how many dashboards you want to include. Here are a couple of ways you can set up your dashboards:
- Set up one dashboard for your marketing team and one dashboard for your sales team. This can keep your team's reporting separate while still allowing all of the information to be available for anyone to see.
- Set up a dashboard for each buyer persona. This will help you keep information about how your different segments are doing separate.
- Set up a dashboard for different roles on your marketing team. If you have one person in charge of campaigns and someone else in charge of blogging, set up different dashboards so they can keep track of their metrics separately.
- Set up a dashboard for the manager of your team as well as the individual contributors. Your managers will need a snapshot of everything their teams are working on while individual contributors may need more details on certain aspects of their campaign. Have one dashboard for your manager that gives them the high-level metrics they need to know and more specific ones for the rest of the team who need more details on their individual projects.
How to Set Up Your First Dashboard
To set up your first dashboard, go to your Dashboard or Reports home, and click on the link to the Reports Dashboard.


You will see your First Dashboard populated with a few sample reports. You can edit those reports or click on the "Create new" button on the right hand side to create new reports or dashboards.

Using the Reports Templates
Your dashboard comes with a set of report templates that are available to you to use. These are example reports that we recommend you use to start your marketing and sales dashboards. At HubSpot, we use these reports on both the marketing and sales side to analyze our performance on a regular basis.
To see a list of these reports, click on the Create new button on the upper right-hand side, and select Report. You will see a list of these reports. Take a look and see which reports make the most sense for you to use. You can then click on the option to Add to dashboard, and it will be loaded with your data right onto the dashboard.

Another option is to use is as a template and make some edits before adding it to your dashboard. For example, you may want to see that report but based on a segment of your database, not all contacts in your database. If that is the case, click on "Use as template."

You will then be brought to the Report Builder where you can use a list to segment your report, change the data you are looking at, or even change the visualization of the graph. When you are done, click "Add to dashboard."

And there you go! You have your first report on your dashboard.

Creating a Custom Report
Now that you have put some reports on your dashboard, it's time to create a custom report. Go to Create new, and select Report at the top right-hand corner. Then select Build from scratch.

You will then be brought to the Report Builder.

Let's say that you want to build a report for a segment of your database that shows a breakdown of your companies by Original Source Type broken down further by the Average Pageviews.
On the left hand-side of the Report builder, you will see a few dropdowns.
- Type - This refers to the kind of report you want to run. You can run a Contacts, Companies, Deals, Engagements, Contacts Funnel, or Deals Funnel report. Contacts will build a report based on the individuals in your database. Companies will build a report based on the number of accounts in your database. Deals will pull in data from your CRM (if it is connected). Engagement will show how your sales team interacted with their potential customers. Contacts Funnel will show the conversion rates through different lifecycle stages. Deals Funnel will show the conversion rates between different deal stages.
- View - This is the breakdown that you get from the HubSpot CRM. For example, if you want to segment the contacts in your database based on region, you can build a view based on this information.
- List - This is the breakdown that you get from the Marketing Platform. For example, if you want to segment contacts in your database based on their lifecycle stage or number of pageviews, you can build a list based on that information. For more information on Lists, see this blog post.
For our particular use case, select Companies from the Type dropdown. From the List dropdown select the list in your database that you want to build your report off of.

Now let's move onto the chart. If you are familiar with Excel, this is very similar to a PivotTable and can help you see multiple pieces of data. In the first dropdown, you can select any property you have about your contacts from Lifecycle Stage to Original Source to the Number of Employees. For our purposes, let's select Original Source Type.

You now see that you have a breakdown of Original Source Type and the number of Contacts. But we want to see the number of Contacts and their Average Pageviews. Click on Edit next to "Count of Companies."

Then search for Number of Pageviews from the dropdown that appears. You will now see a breakdown of the Total Number by Average Pageviews.

If you want, you can change Total to Average to get the Average Number of Pageviews by Source.

If you wanted to add another column with more information, you could do that. If you are satisfied with your chart of data, click on Add visualization. A chart will appear above.

You now have options to create eight different types of charts. You can also edit the information displayed on your chart or change your bar graph to a stacked bar graph. Play around with the visualization options.

When you are finished, click on Add to dashboard to put your custom report on the dashboard. Once you do that, it will appear at the bottom of your current dashboard.
Best Practices for the Dashboard
There is a lot you can do with this new app, but here are some things we recommend you do. If you want to see specific marketing or sales best practices, download this PDF.
- Use the reports templates. These are reports that our marketing and sales teams at HubSpot have found valuable. By using these reports, you will start to get used to the new app as well as how you should report.
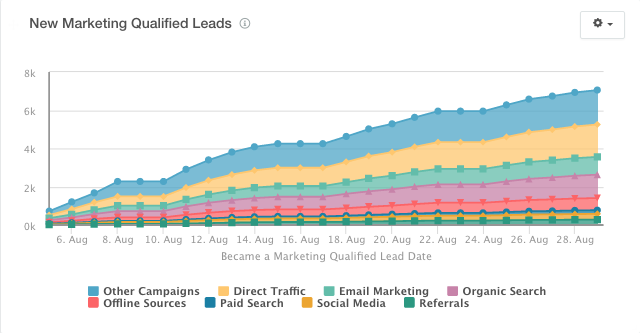
- Add a visualization to your report. The chart view is great, but sometimes it just helps to have that bar or line graph. Play around with the visualization that makes the most sense to you or get a recommendation from this article.
- Set goals. After you decide a metric is important for you, set a goal for you to hit over a month (or another time period you are measuring). You can then put that goal into the report.
- Email reports to others on your team. The beauty of the dashboards you can create is that you can be transparent with others on your team. Make sure they are viewing the reports and your progress toward your goals by setting it up to email them with these reports on a regular basis. You only have to do it once.
- Resize your reports. The more important a report is to you, the bigger it should be. You can resize your reports right from the dashboard. To do this, hover over the bottom right corner, click on it, and increase or decrease its height or width.
- Rearrange your reports. If you have a couple of reports that are the most important to you, it may make sense to put them at the top of your dashboard. To move a report, hover over the top left corner, click on it, and drag it to a new location.
- Create new dashboards. Think about how many dashboards makes the most sense for your team to have. You may want to have a dashboard per team or you want to have a dashboard for your marketing team and a dashboard for your sales team.
- Rename your reports. We will give you a suggestion for a name, but you can name your reports whatever makes the most sense to your team.
- Create a custom report based on lists or views. An important part of reporting is making sure you properly segment before reporting. If you market to different personas, you need to report on each persona, not combine them. Use the Lists or Views options we went over earlier to segment your reports before you build them out and put them on your dashboard.
- Report on multiple dimensions. In the Report Builder, you can build a custom report that is based on multiple pieces of criteria. For example you could build a report that shows the contacts in each Lifecycle Stage broken down by Original Source Type and the number of Emails Delivered. This would show you how many emails you sent to contacts by lifecycle stage and how they found your company in the first place. Neat stuff!