
.png?width=595&height=400&name=Marketing%20Strategy%20%26%20Trends%20Report_v2%20(1).png)
If you’re anything like me, you wish you had more time and resources to get through your work, ponder game-changing ideas, brush up on digital marketing industry trends, and ultimately give your audiences unforgettable brand experiences.
Well, research shows artificial intelligence (AI) is becoming the marketer's ultimate assistant in many of these quests. It’s also one global marketing trend that is evolving our landscape (and competition) faster than ever.
![Download Now: Free State of Marketing Report [Updated for 2024]](https://no-cache.hubspot.com/cta/default/53/b0f73a5e-16e4-41fd-9511-8564efc560a7.png)
But AI is just one marketing industry trend we’re navigating today. Let’s use the data from our survey of 1460 B2B and B2C marketers worldwide to unpack the top marketing trends of 2024 and identify how they can help you win over your audiences.
Top Digital Marketing Trends in 2024:
- AI is driving marketing industry growth, but it still faces adoption barriers like job security concerns, brand reputation, and a lack of knowledge about how to use it.
- Social media apps could drive higher ROI than ever in 2024 as they evolve into frictionless ecommerce platforms.
- Facebook (really, Facebook) still proves to be a powerful platform for marketers.
- Short-form video offers the highest content ROI and will earn more investment than all other formats.
- Marketers will turn to social media targeting, first-party data, and AI tools to reach audiences after Chrome's third-party cookie phaseout.
- Marketers will use social media targeting and first-party data in response to Chrome's third-party cookie phaseout.
- Marketers still struggle with disconnected data, tools, and company silos.
The State of Marketing in 2024
HubSpot's Annual Inbound Marketing Trends Report
- Top Marketing Channels
- AI in Marketing
- Managing Privacy
- The Future of Marketing
Download Free
All fields are required.
Digital Marketing Industry Trend #1: AI is driving marketing industry growth.
We can’t discuss marketing trends without AI. With image generators, content generators, and video generators, among other tools, AI is driving a great deal of marketing industry growth.
In fact, it is quickly becoming the ultimate marketing assistant, with 64% of marketers already using it and 38% of others planning to start in 2024.
Sean Downey, Google's President of the Americas and Global Partners, believes AI will be the single biggest trend in 2024.
In this post, he told HubSpot, “It should come as no surprise that in 2024, the biggest marketing trends center around the possibilities of AI. Today, marketers face pressing challenges to navigate evolving consumer expectations and consumption habits in today's media landscape, which is fragmented and shifting dramatically — all while delivering business outcomes more efficiently.”
He adds, “The AI opportunity is coming at a time of transformation for everyone, including marketers. In fact, in addition to connecting brands and products to people, more than ever before, marketers need to be growth drivers for their companies.”

Things get interesting when we look at how marketers see AI being used — 60% say it will act as an assistant that helps them with their job duties, while 20% see AI primarily taking over menial tasks.
But there’s no debating that AI will make a big splash in the marketing industry in 2024.
85% of marketers say generative AI has changed how they will create content in 2024 and 63% say that in 2024, most content will be created at least in part with the help of generative AI.
Marketers who use generative AI are seeing great results, saying it helps them make significantly more, higher quality content that performs better.
As Briana Rogers, VP of Marketing at Miro, tells me, “Marketers will have to learn how to integrate AI into their work.”
She explains, “The space is moving so quickly and we need to experiment with everything … from the more well-established use cases — like leveraging machine learning to improve ad buying, or creating predictive customer value models — to newer spaces, like identifying patterns in user research and data, assisting in creative development, and building full customer campaigns that are powered by AI.”

81% of marketers who use generative AI say it’s effective at assisting them in their role. Specifically, it helps them:
- improve the quality of the content they create (85%)
- create content more efficiently (84%)
- make significantly more content (82%)
- create more personalized content (77%).
On top of all that, 56% of marketers who use generative AI for content creation say this content performs better than content created without it.
Also, our survey shows marketers using AI/automation tools are 95% more likely to say their marketing strategy was very effective this year than those who don’t.
But a big disclaimer is that AI shouldn't replace your entire content team. Your consumers won't want this and neither will platforms like Google.
A recent report from HubSpot Senior Marketing Manager Curtis del Principe, highlighted the punishment handed down to one agency after they farmed thousands of posts with AI in what we're calling an “SEO Heist.”
So, if you can't create all of your content with AI, how can you still use it to your best advantage in your content plan?
How Marketers Use AI for Content Creation
The marketers we surveyed told us that data analysis, research, and content creation are the top use cases for generative AI.

This tells us that marketers aren't replacing writers or creatives with AI. Instead, they primarily use AI for:
- Brainstorming new ideas or angles,
- Repurposing or adapting pre-created content for a different audience, format, or channel
- Writing basic copy or outlines
- And creating images or basic videos.
Regarding the types of content marketers use generative AI to produce, social media posts, emails, blog posts, topic ideas, images, and product descriptions are the most common.
Automatic content repurposing is one of the key standouts here. Marketers can now use tools like HubSpot’s Content Marketing Software, to easily turn existing blog posts into social posts, newsletter content, audio files, and so on — all it takes is just a few minutes.

While that all sounds great, we need to talk about a few AI concerns.
Curious about AI for content creation?HubSpot’s Free AI Content Creator is a great place to start.
Where AI Still Faces Barriers
Job Security/Replacement
The AI revolution is a huge change, so it’s no surprise that nearly half of marketers are concerned about AI replacing their jobs.
Of marketers surveyed, 23% think the industry should avoid using generative AI altogether. However, based on how marketers are actually using AI, it isn’t replacing their jobs but acting as an assistants.
Among marketers who use generative AI to write copy, just 6% use it to write the entire piece of content for them, 45% use it for ideas/inspiration, 31% use it for an outline, and 18% use it for a first draft.

Additionally, 95% of marketers who use generative AI to write copy end up editing the text, with 44% making significant changes.
AI Adoption and Integration
Another issue is integrating AI throughout marketers’ workflows. 46% of marketers feel overwhelmed at the very prospect.
The good news is businesses are going out of their way to help, with 40% of marketers saying their company has hired a new employee specifically to help their team leverage AI.
When it comes to overall AI implementation:
- 53% of marketers have integrated it into their daily workflow or within as-needed tasks.
- 10% are still in the experimentation phase.
- 36% don’t use AI at all - but 38% of these marketers will start in 2024.
Plagiarism and Bias
Of those marketers surveyed, 60% share the concern that AI can harm their brand’s reputation through bias, plagiarism, or misalignment with brand values.
This is definitely an issue, but if you’re using AI as an assistant, you’ll be editing and watching over the output every step of the way.
AI tools are also aware of these problems, and some have already rolled out capabilities to source and fact-check the information they spit out.
For example, Google’s Gemini (formerly Bard) will allow you to double-check the output with links to existing sources that confirm the information.

Luckily, as companies hire AI implementation experts, marketers become more comfortable using AI as an assistant, and AI tools become more accurate and trustworthy, we predict the concerns above will be overcome quickly.
The State of Marketing in 2024
HubSpot's Annual Inbound Marketing Trends Report
- Top Marketing Channels
- AI in Marketing
- Managing Privacy
- The Future of Marketing
Download Free
All fields are required.
Digital Marketing Industry Trend #2: Social media is the highest ROI marketing channel as it continues to evolve with ecommerce.
Social media is arguably the #1 marketing channel. Not only does it offer the highest ROI, but 43% of marketers use it — more than any other channel. This may be partially because it’s a leading product discovery and purchasing channel.
Our Consumer Trend Survey found that social media is actually the preferred product discovery channel for Gen Z and Millennials, while Gen X and Boomers are warming up to it quickly. In fact, 64% of Gen Z, 59% of Millennials, and 47% of Gen X have confirmed discovering a product on social media in the past three months.

On Instagram, TikTok, and Facebook, marketers can also set up virtual stores for users to purchase without ever leaving the platforms.
From discovery through influencer recommendations to in-app purchases and customer service via direct messages (DMs), social media can be a one-stop shop.
Moreover, 17% of social media users bought a product in-app in the past three months. In that time, one in four bought something based on an influencer’s recommendation, and 19% sent a DM for customer service.
Every time we run our Consumer Trends survey, these numbers increase significantly. So, it’s no surprise marketers are quickly embracing social selling.
Our most recent social selling survey found that 87% of marketers say it’s effective, and 59% report driving more social sales than in past years.
Currently, 27% of marketers use social selling tools, 23% leverage influencer marketing, and 22% use social media DMs for customer service. Marketers plan to invest heavily in these channels for 2024.
Digital Marketing Industry Trend #3: Facebook still proves to be a powerful platform for marketers.
So, social media is the place to be, but what platforms are actually delivering for marketers?
Despite what you may have heard about Facebook being “dead,” it’s still the most popular platform used by marketers (57%), followed by Instagram (55%), YouTube (52%), TikTok (44%), X (39%), and LinkedIn (37%).
Regarding actual ROI: Instagram and Facebook are tied for the highest ROI, followed by YouTube, TikTok, LinkedIn, and X.

In terms of new strategies, 27% of marketers who didn’t use YouTube last year plan to leverage it in 2024, followed by TikTok (25%), Facebook (24%), and Instagram (23%).
But the real social media showdown of our time is between X (formerly Twitter) and Threads.
Of 1,400 global B2B and B2C marketers, 68% expect to see greater success with X (formerly Twitter) than Meta's Threads in 2024.
Our survey shows marketers are sticking with the newest version of Twitter, with 68% expecting to see greater success with X over Threads in 2024. Just 32% of marketers expect Threads to be a bigger success for them in 2024 than X.
Furthermore, only 11% of marketers currently use Threads, and just 13% of those who don’t use it plan to try it for the first time in 2024.
At this point, you might ask yourself, “But are consumers I market to using these channels?” Check out these deep dives for more:
- X vs. Threads: What Marketers Need to Know
- The Fastest Growing Social Media Platforms [New Data]
- Which Social Media Channels are Gaining & Losing Steam? [Data] ’
The State of Marketing in 2024
HubSpot's Annual Inbound Marketing Trends Report
- Top Marketing Channels
- AI in Marketing
- Managing Privacy
- The Future of Marketing
Download Free
All fields are required.
Digital Marketing Industry Trend #4: Short-form video offers the highest ROI and will see the most growth of any marketing content format in 2024.
While Facebook is clearly still powerful, video-centric platforms like TikTok, YouTube, and Instagram will likely see more investment in 2024. More specifically, short-form video.
Our blog team has been predicting a short-form video renaissance since the rise of TikTok during the pandemic, and today, there’s hardly any contest.
Short-form video is now the #1 content marketing format, with most marketers saying it offers them the highest ROI. It’s also being used by the most marketers, at 44%.

While short-form video has reigned for a few years now, it will continue to see the most growth in 2024, with marketers planning to invest more in it than any other format.

26% of marketers plan to invest more in short-form video than any other format in 2024, the highest of any format by far.
Additionally, 57% of marketers who leverage short-form video will increase their investment in 2024, the highest increase of any format. And to top it all off, 30% of marketers who don’t use short-form video will start in 2024.
(Heck, even our Blog team is testing out short-form videos to promote content.)
This is likely because marketers report that video-centric social media platforms are the most effective and offer the best return on investment (ROI).
56% of marketers using TikTok say they will increase their investment this year, the highest of any platform. YouTube and Instagram will also see a significant boost in investment.

Digital Marketing Industry Trend #5: Marketers will keep investing in micro-influencers who can engage tight-knit and loyal communities.
Not only is influencer marketing super effective and going to keep growing in 2024, but influencers are becoming even more impactful on purchase decisions.
According to 86% of marketers, influencer marketing was effective for their company in 2023. Plus, our consumer trends survey shows that one in four social media users bought a product based on an influencer’s recommendation in the past three months.
That’s up 33% from when we ran the same survey a year before.
Influencer marketing will also see significant growth in 2024, with 50% of the marketers who use it planning to increase their investment and 20% of those who don’t leverage it yet planning to try it for the first time.
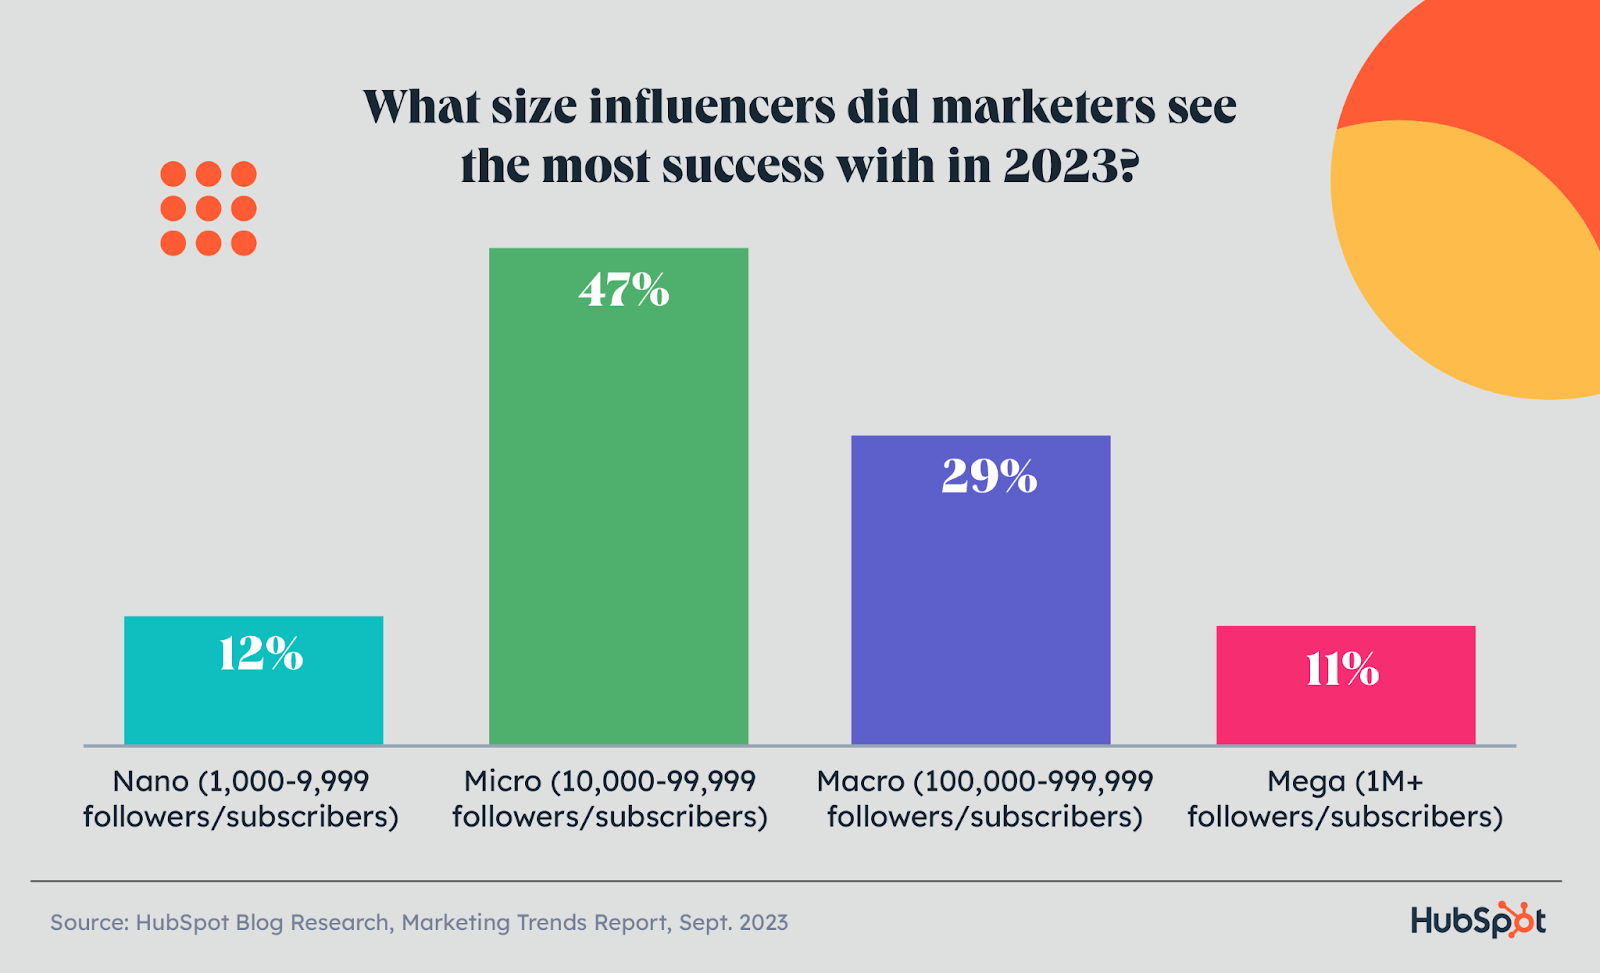
One important caveat? Marketers are finding more success working with micro-influencers who have between 10,000 and 100,000 followers than celebrities (i.e., macro or mega influencers) with huge followings.
About half of marketers worked with influencers or creators in 2023, and 64% of them worked with micro-influencers, making them the most popular type of influencer.
According to 47% of influencer marketers, these are also the influencer sizes with which marketers saw the most success this year.
The biggest reasons for this are that working with small influencers is less expensive, which makes it easier to establish long-term partnerships and offers access to tight-knit, engaged, and loyal communities.
This goes to show that followers aren’t everything anymore.
Our 2023 Social Media Trends Report found that most marketers say “quality of content” is the most important factor when determining which influencers to partner with.

Digital Marketing Industry Trend #6: Marketers are turning to social media targeting and first-party data in response to Chrome's phaseout of third-party cookies.
From iOS changes to GDPR and Google’s plans to phase out third-party cookies, increased data privacy regulations have been a hurdle for marketing industry growth over the past few years.
With 84% of consumers in our trend survey saying data privacy is a human right, public opinion is definitely shifting towards more safeguards around personal data.
On the marketer side, 84% say data privacy changes affected their strategy in 2023. This year, key changes marketers expect to impact them most are:
- Google Chrome's third-party cookie phaseout (a concern of 47% of marketers)
- Apple iOS Privacy Protection features (41%)
- GDPR (General Data Protection Regulation (40%)
The issue is marketers aren’t quite ready for this shift — 81% say their marketing activities rely on third-party cookies to some extent, and around one in five marketers say they aren’t prepared to lose access to them.
Additionally, 76% of marketers say Google phasing out third-party cookies will make marketing more difficult.
So what are marketers doing about it? 47% say their company is exploring alternatives to third-party cookies, with social media targeting and first-party data being the most popular solutions.
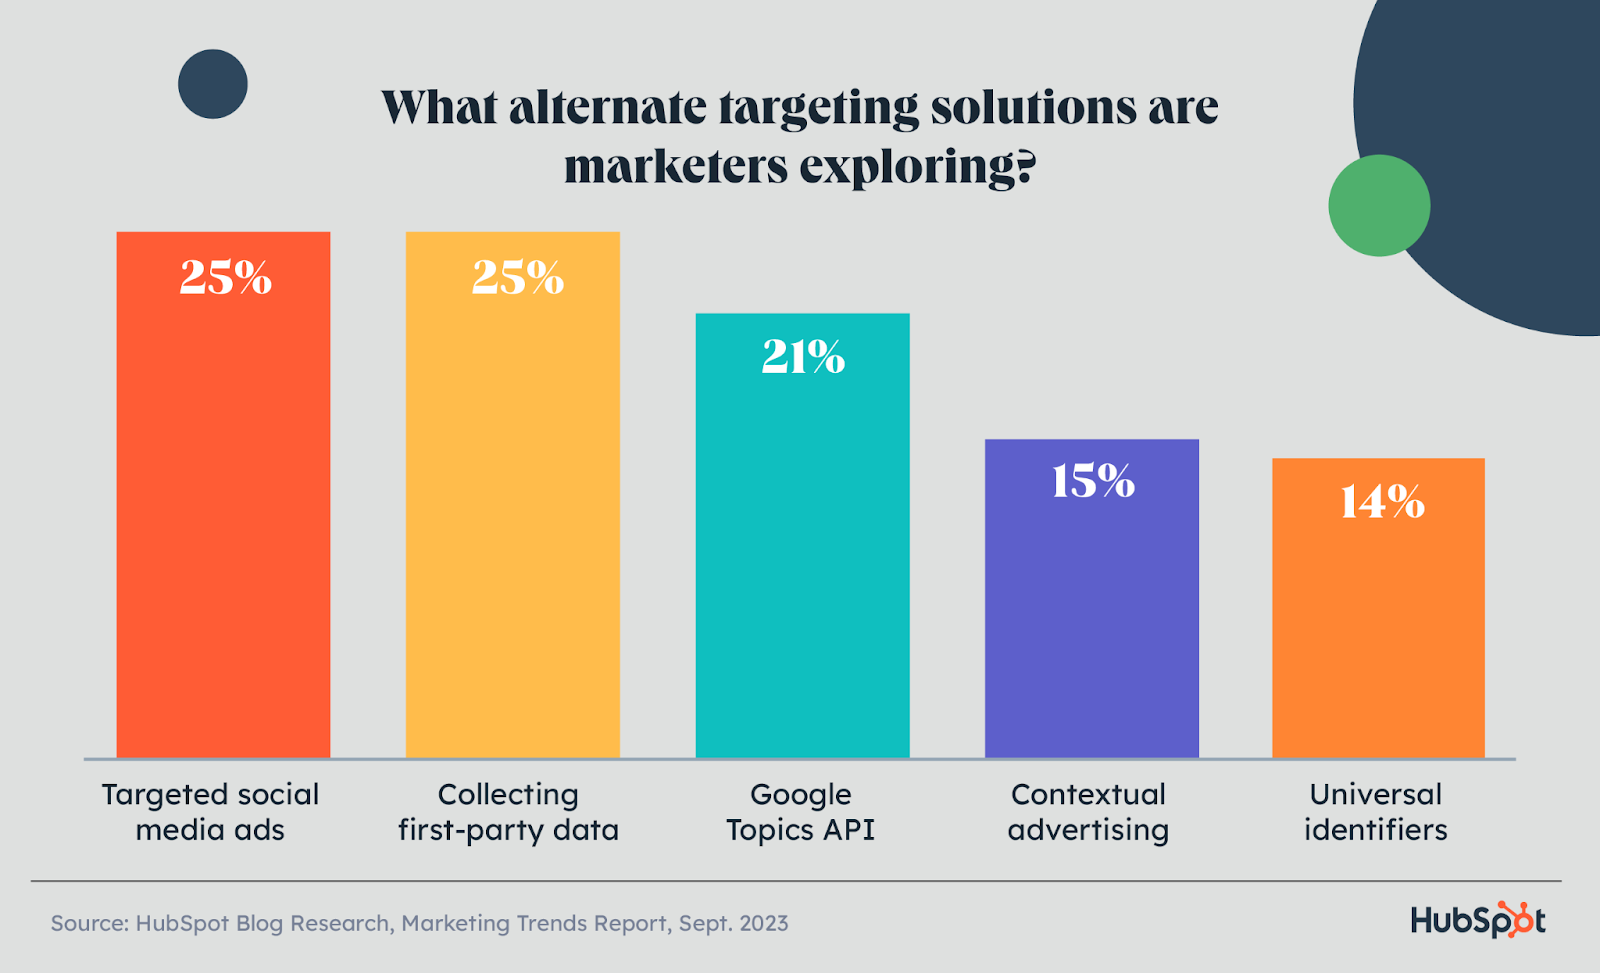
25% of marketers are exploring targeted social media ads, followed by collecting first-party data (25%), Google Topics API (21%), contextual advertising (15%), and universal identifiers (14%).
We’ll discuss the benefits of first-party data next, but to learn more about these alternatives, check out our blog post that explores each solution in depth.
Personalized Marketing with First-Party Data & AI
Despite steps towards personalization — and a lot of talk about focusing on the customer experience — we know there’s plenty of room for improvement.
Our survey shows only 35% of marketers say customers get a very personalized experience with their brand and just 65% of consumers say the content they see from brands feels relatable.
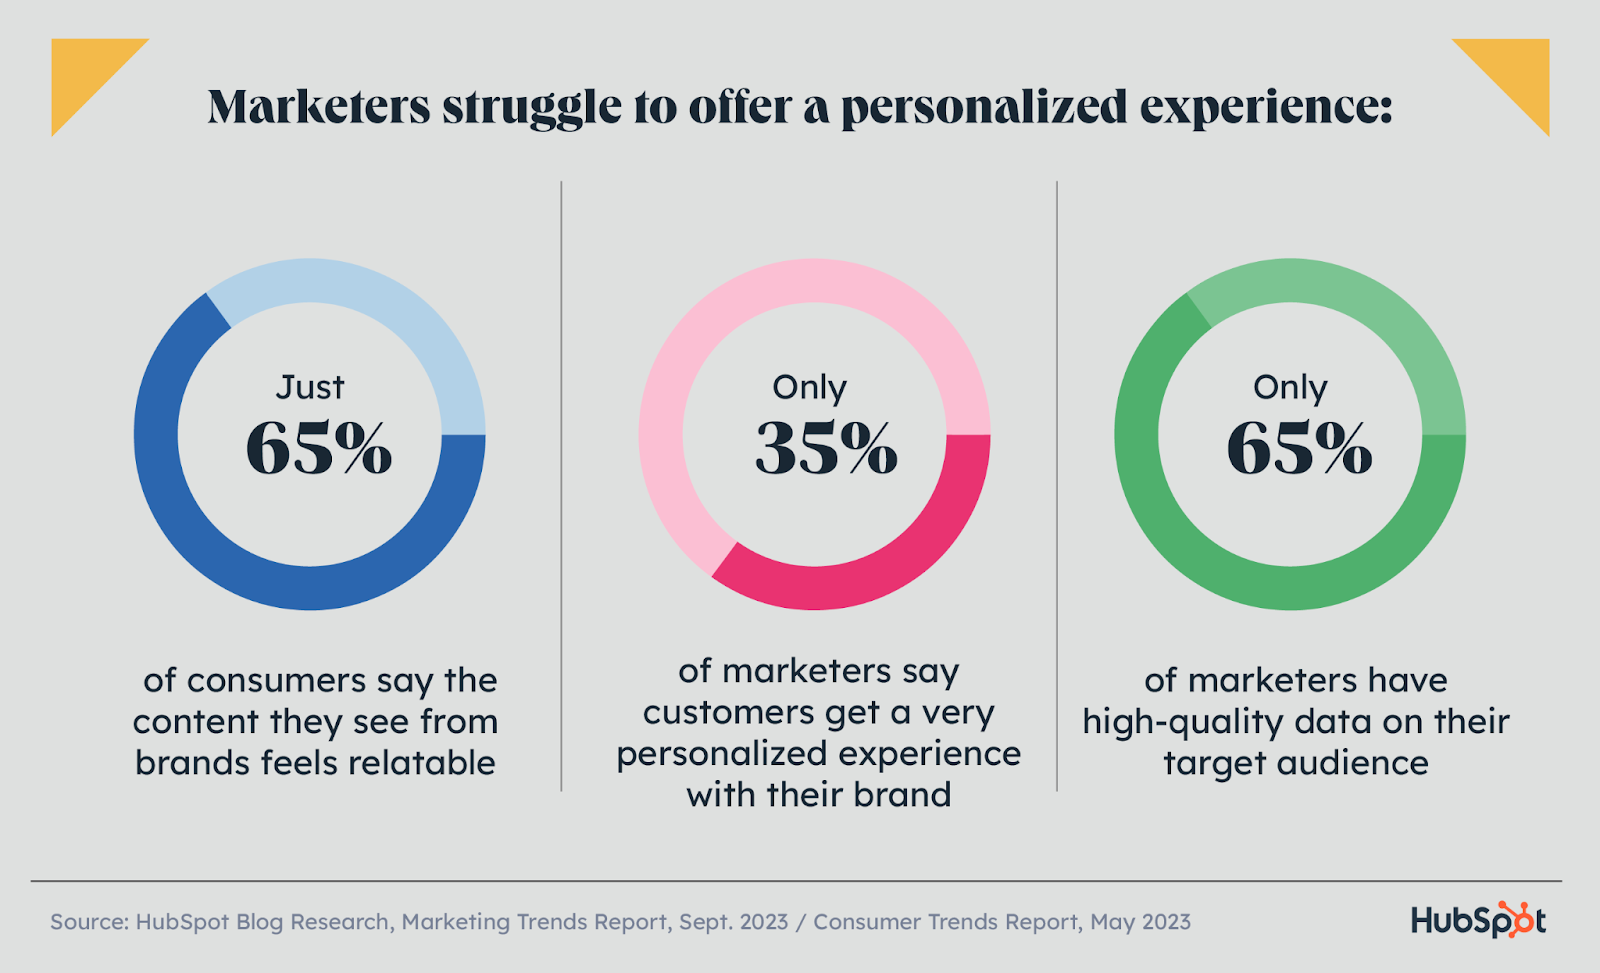
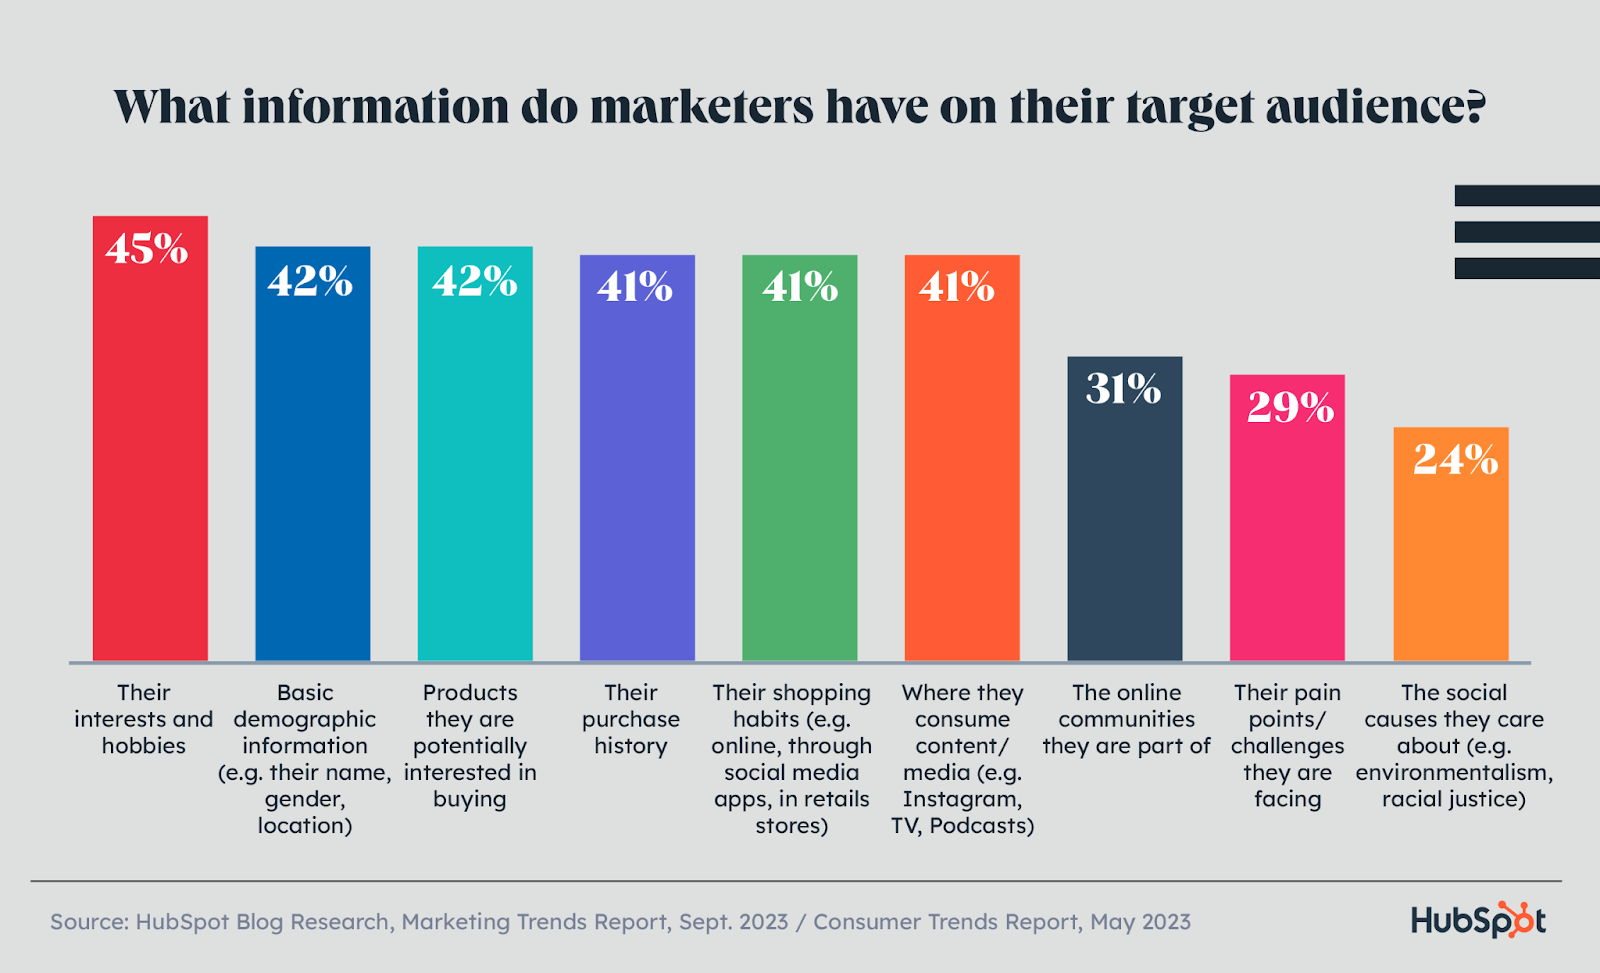
On top of that, most marketers lack crucial information about their audience, with only 65% saying they have high-quality data on their target demographic.
When we asked marketers what they know about their target audience, less than half know where they consume content, their demographic information, their interests and hobbies, products they are interested in, and insights on their shopping habits.
To address these challenges, marketers can leverage our powerful analytics tool, HubSpot's Marketing Analytics tool. This tool provides valuable insights into customer behavior, preferences, and engagement patterns, helping marketers create more personalized and effective campaigns.
Why is this so important? Getting this data helps you create a truly personalized experience, which 96% of marketers say increases the likelihood of buyers becoming repeat customers, and 94% say personalization increases sales.

To top it all off, marketers whose brands give customers a personalized experience are 215% more likely to say their marketing strategy last year was very effective compared to marketers at brands that don’t offer a personalized experience.
As we mentioned in the previous trend, data privacy regulations make personalization a little more difficult by reducing your access to data.
But that also presents a new opportunity with first-party data, which is data collected directly from your customers. Not only is it higher quality, but it’s also unique to your customers and your business, providing better insights and only getting more powerful with the addition of AI.
While we’ve all been using generative AI tools that leverage public information, the real magic happens when you combine AI with your own business data, allowing marketers to offer a highly relevant, personalized experience.
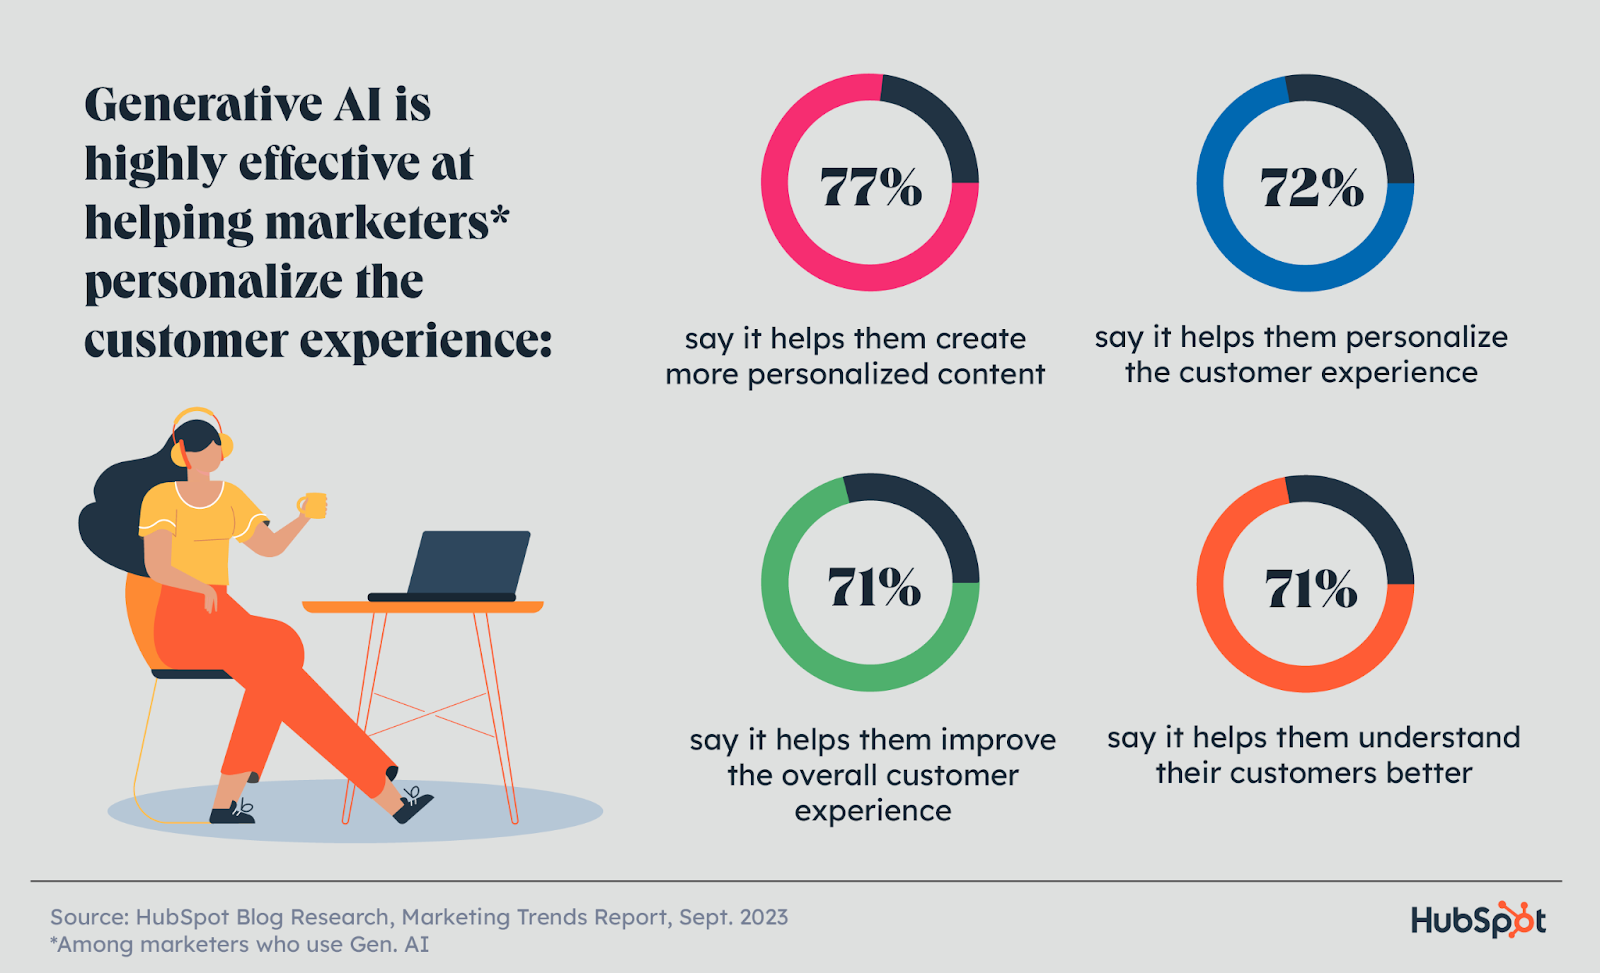
Of marketers who use generative AI, 77% say it helps them create more personalized content. They also personalize the experience customers get with their company (72%), improve the overall customer experience (71%), and understand their customers better (71%).
While the power of AI and first-party data is still yet to be seen, all signs point to this intersection being the key to a truly scalable personalized experience.
And when it comes to making the most of your data, one key piece to the puzzle is having a single source of truth. So, let’s go over a few of the reasons having centralized and accessible data is make or break in 2024.
Learn more about personalization with HubSpot CRM.
Digital Marketing Industry Trend #7: Marketers still struggle with disconnected data, tools, and company silos.
In last year's State of Marketing report, we found data heavily impacted marketing industry trends. To get more granular, data-driven decision-making was both a top tactic and a top challenge for marketers.
While AI and other flashy marketing trends may steal headlines, data is more important than ever in 2024. Yet marketing data, teams, and tools are still disconnected.
This makes sharing and getting necessary data challenging. It also prevents organizations from getting a holistic view of their data and reduces data quality. We call this phenomenon a “crisis of disconnection.”
Around one in four marketers say it’s difficult to share data with other teams and get the data they need from other teams at their company.
On top of that, 23% of marketers say the way marketing data is stored at their company is inaccessible, and just 26% say their marketing data is fully integrated with the tools they use. Additionally, only 59% of marketers say the tools they use are interconnected.
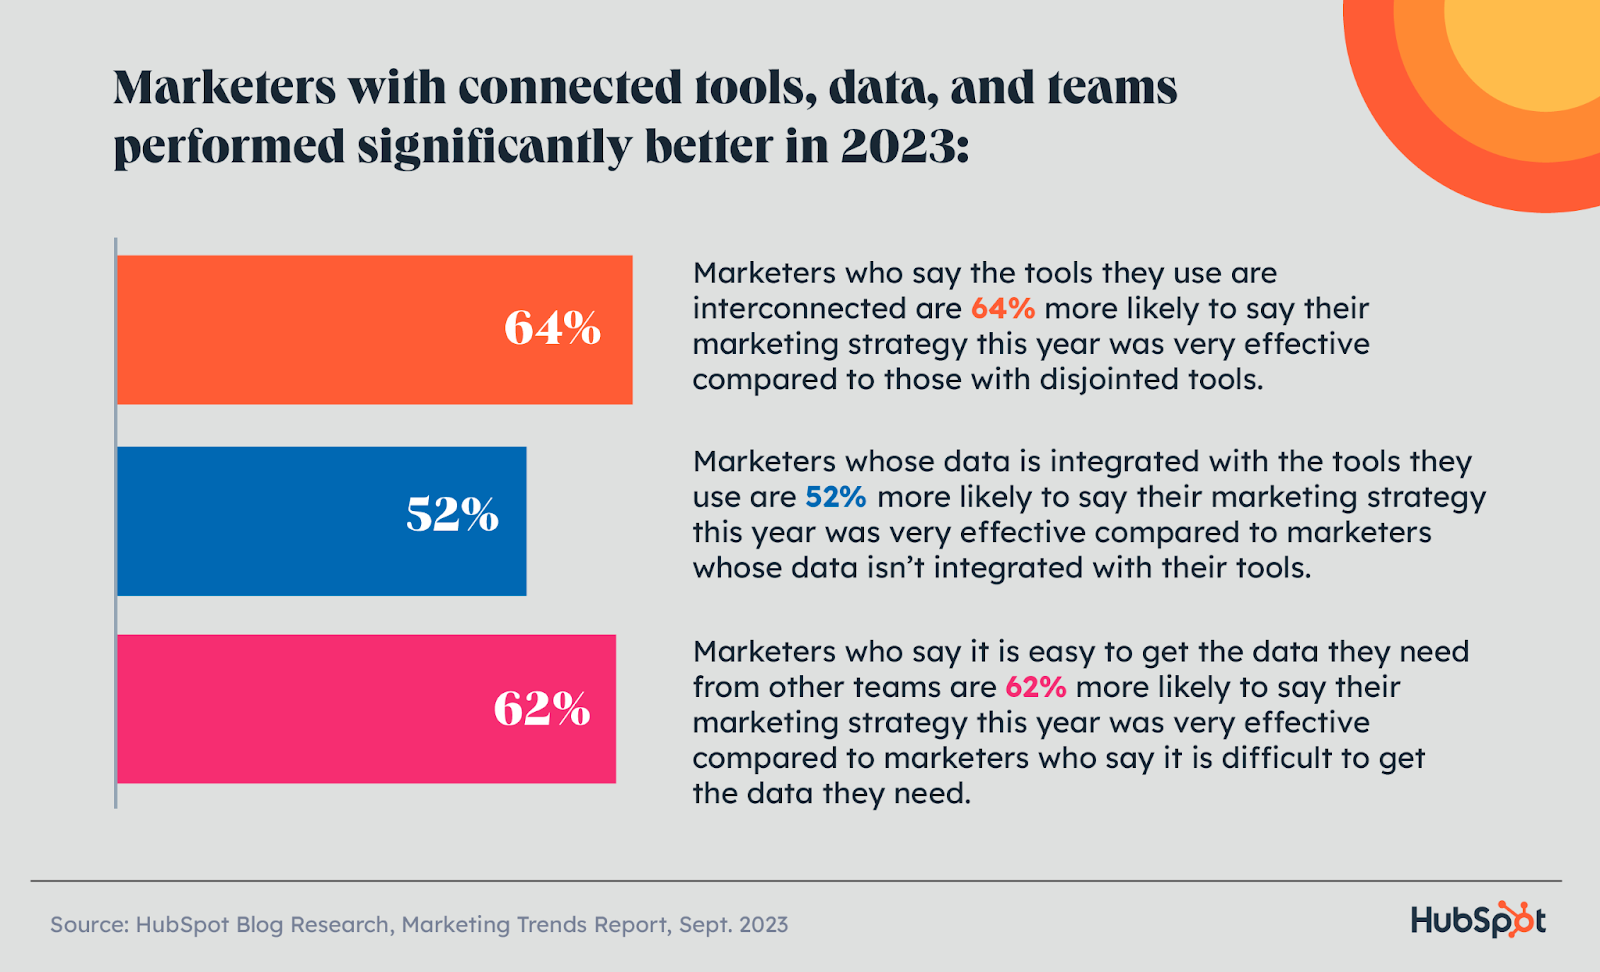
Our survey also found that marketers with connected tools, data, and teams performed significantly better in 2023.
The Solution: A Single Source of Truth
While 93% of marketers with a single source of truth for data say it is beneficial to their organization, only 65% of marketers actually tell us they have one.
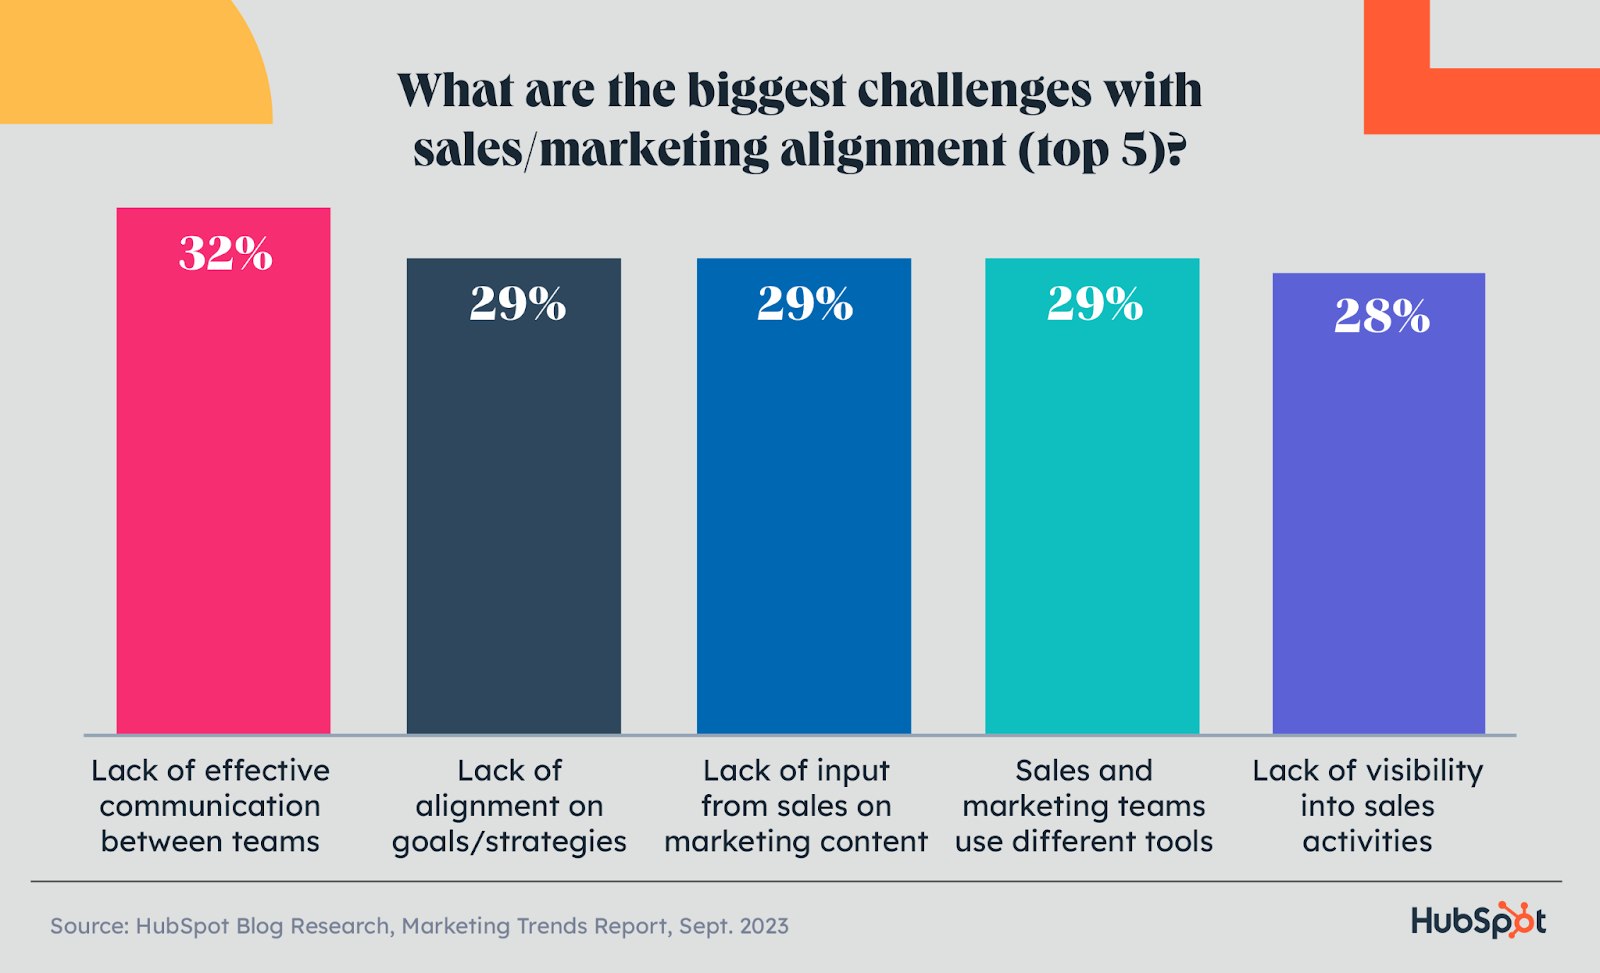
A single source of truth directly addresses the top challenges marketers see with sales and marketing alignment: A lack of effective communication between teams, sales and marketing teams using different tools, and difficulty sharing data between teams.
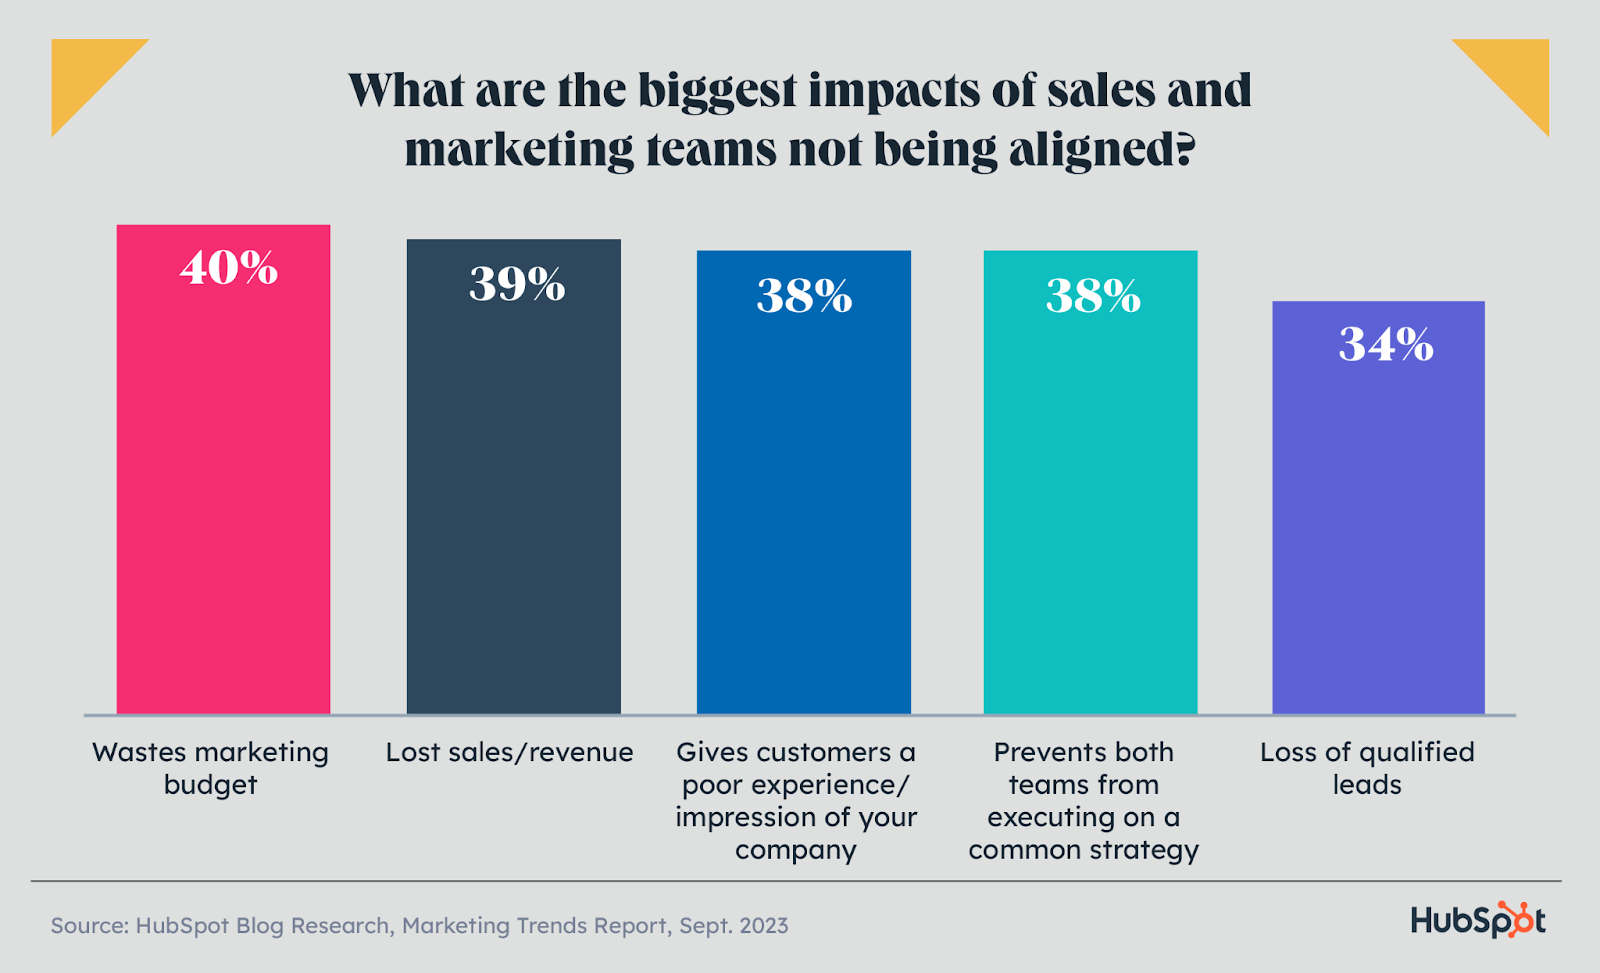
What actually happens when sales and marketing teams aren’t aligned?
Marketers say their budgets are wasted, sales and leads are lost, and customers end up receiving a poor experience. Meanwhile, marketers who are aligned with their sales team are 26% more likely to say their marketing strategy this year was very effective compared to those who aren’t aligned.
One highly effective way to implement a single source of truth is getting a CRM like HubSpot, which integrates data with tools and boosts alignment across teams.
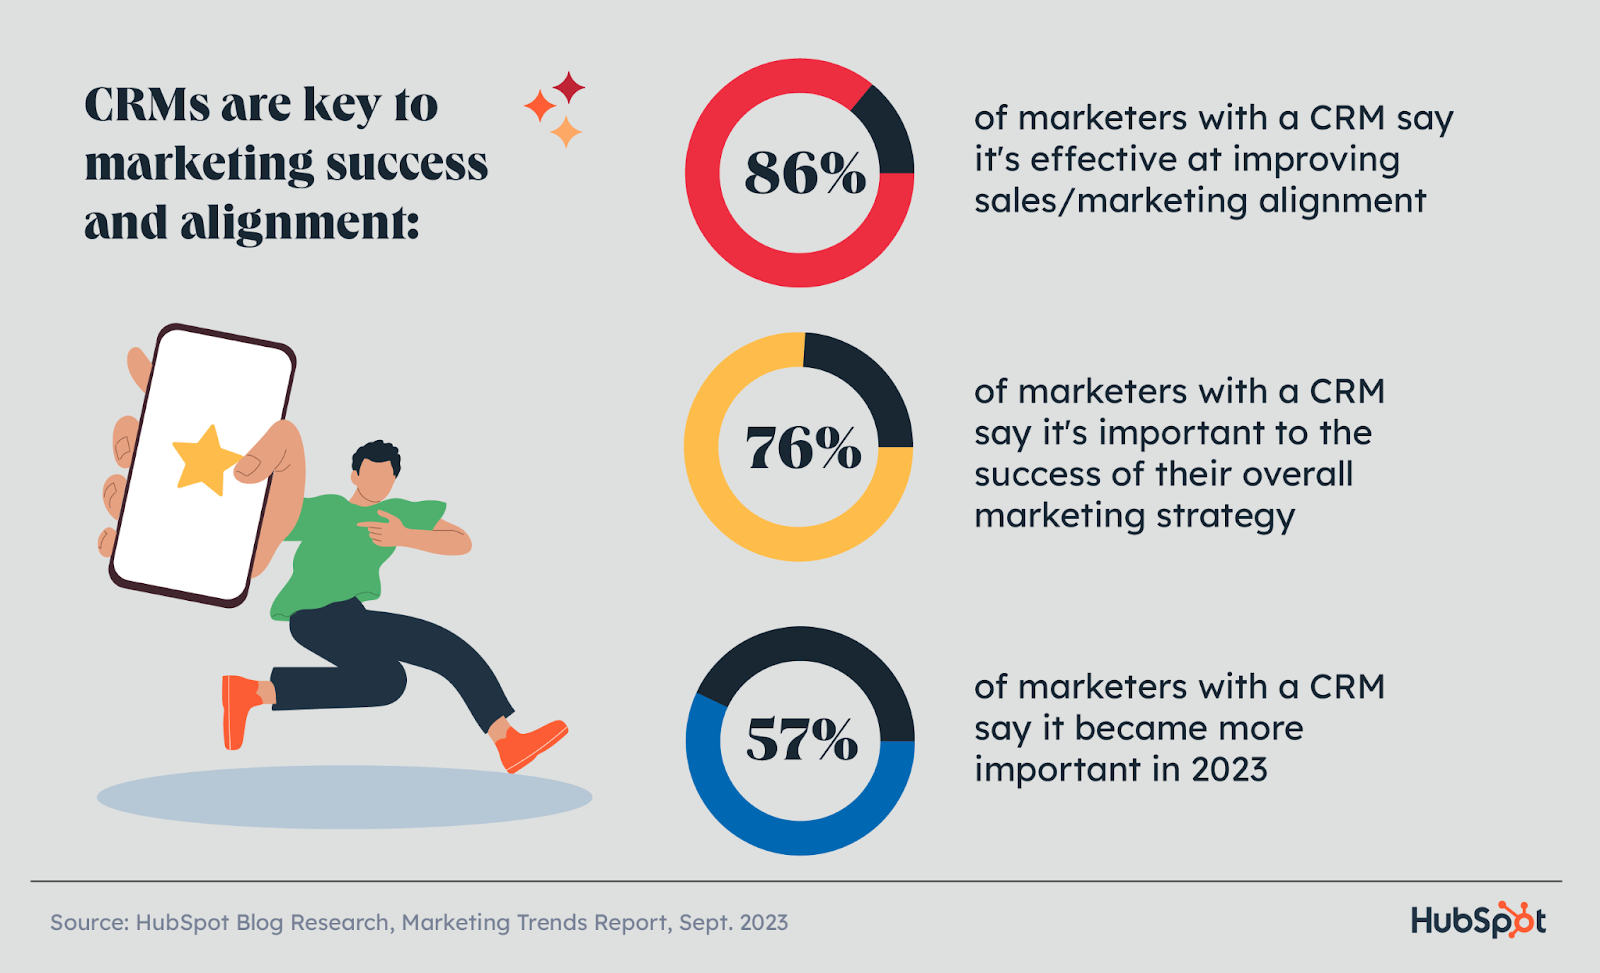
Of marketers using a CRM, 86% say it’s effective at improving alignment between teams. And marketers with a single source of truth are 56% more likely to be strongly aligned with their sales team than those without one.
Furthermore, 76% of marketers with a CRM say it is important to the success of their overall marketing strategy, and 57% say their CRM became more important in 2023.
Marketers who use a CRM are 128% more likely to say their marketing strategy this year was very effective compared to marketers who don’t use a CRM. And on top of that, 93% of marketers using HubSpot CRM say their marketing strategy was effective this year.
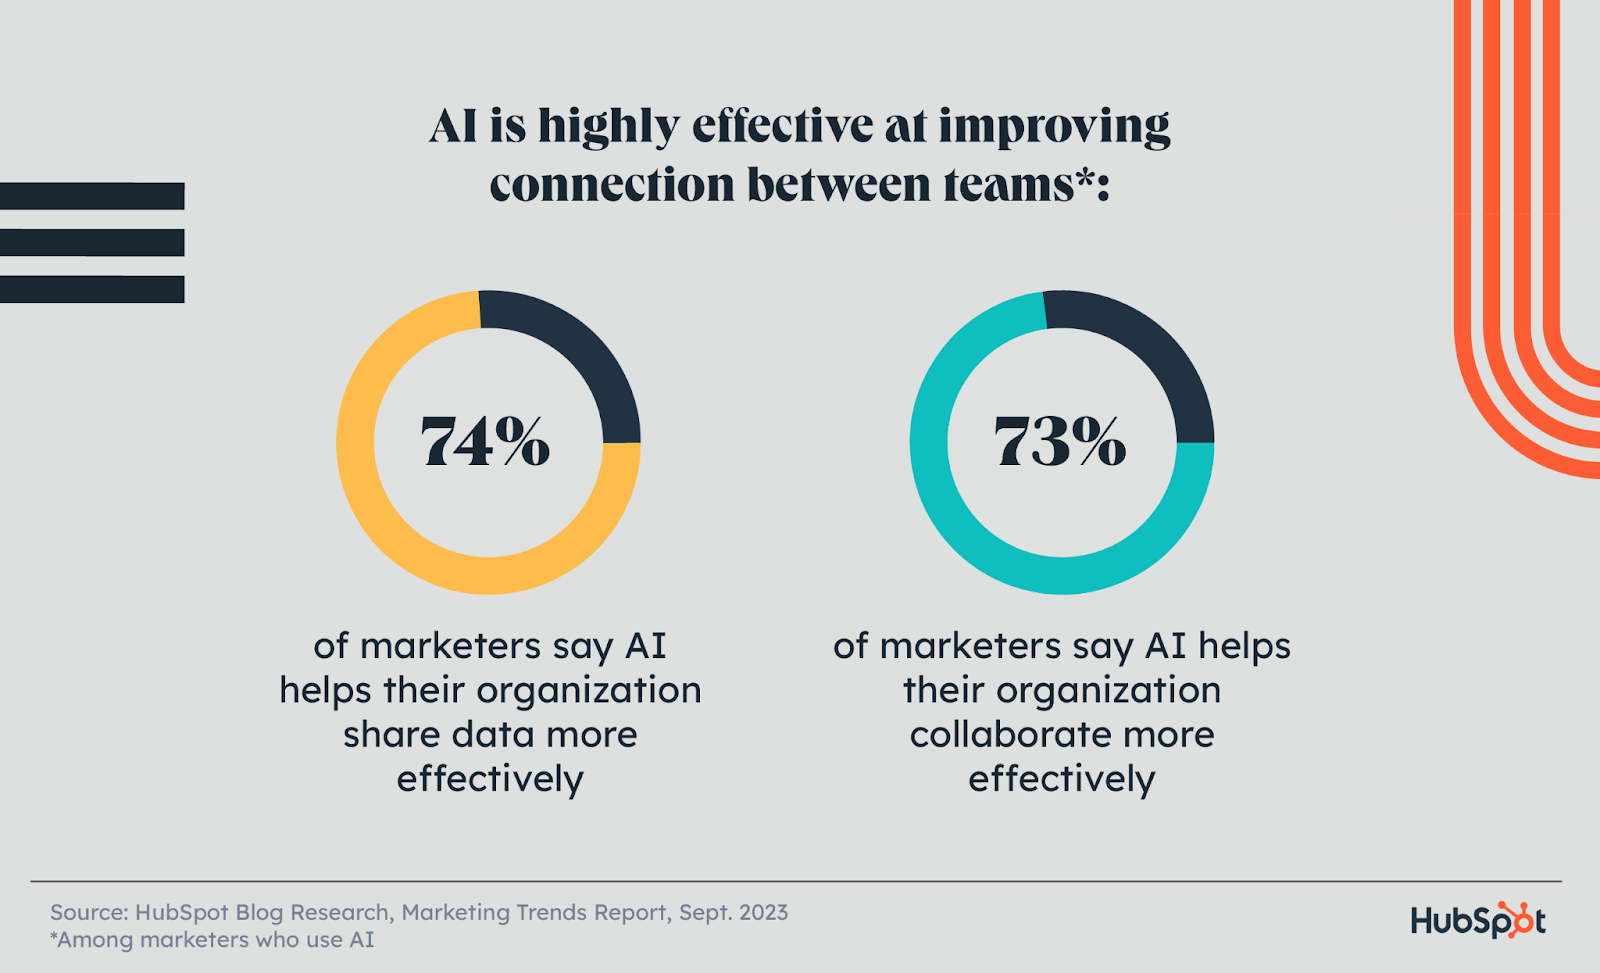
Lastly, AI also improves connection, with marketers who use it saying AI helps their organization share data more effectively (74%) and collaborate more effectively (73%).
What's Next in Marketing Industry Trends
When it comes to all the things shifting in today's landscape, the list above is just the tip of the iceberg.
For a detailed list of the top tactics, opportunities, challenges, channels, and content marketers will leverage in 2024, check out our 2024 State of Marketing Report.
![6 Steps to Create an Outstanding Marketing Plan [Free Templates]](https://www.hubspot.com/hubfs/marketingplan_20.webp)


![11 Recommendations for Marketers in 2024 [New Data]](https://www.hubspot.com/hubfs/Marketing%20Recommendations.png)