Everyone learns differently. Social media marketing has a lot of moving parts and processes which make it hard to get up to speed. This challenge is only compounded by the ever-changing nature of the market, in which new applications and opportunities arise daily. (Is your business taking advantage of Facebook, Twitter, LinkedIn, and Google+ for marketing purposes?)
Reading tons of blog articles, while important, takes a lot of time. Sometimes it is easier to see concepts visually to get a basic understanding, and then do further research on the topics that are most relevant to your business. In today's post we collected some great visualizations of social media concepts including social media monitoring and content distribution.
Download Now: The 2025 State of Social Media Trends [Free Report]
22 Amazing Social Media Graphics
1. Social Media Participation Chart by Oversocialized

2. Social Media ROI by Intersection Consulting

3. Social Media Plan: Basic Guide by thefreshpeel

4. Tools and Methods of Social Media by deanmeyersnet

5. The 4Cs Social Media Framework by Gauravonomics

6. Facebook Reaches 400 Million Users by Oversocialized

7. Social Media Syndication Network Flowchart by LocalGoogleGuru

8. Social Media Process v. 1.0 by Damien Basile

9. Social Media Monitoring Chart by hyku

10. Ripples of Social Change by cambodia4kidsorg

11. Social Media Venn Diagram by pescatello

12. The Six Gs of Social Media Marketing by kivilm

13. The 2010 Corporate Social Media Marketing Ecosystem by davefleet

14. Digital Mindsets by David Armano

15. Social Network as Imaginary Friend by daveelf

16. Social Media is Changing Business by volker.davids

17. Content Based Community Support Program by Tippingpoint Labs

18. Welcome to Social Town by E Factor Media

19. A Conceptual Map of the Social Web by tomzazueta

20. Social Arena Marketing by juicedigitalpr

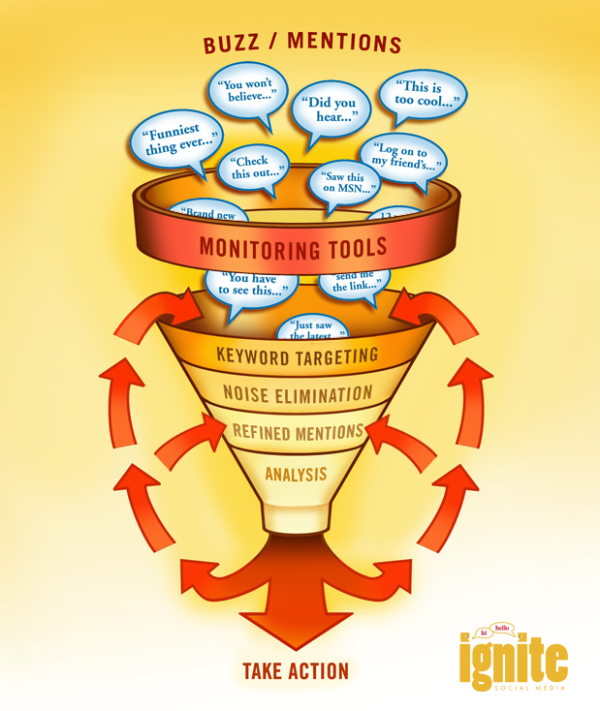
21. Social Media Monitoring Funnel by Ignite Social Media
22. Online Marketing Distribution Channels by toprankonlinemarketing
 Were these images helpful? Do you have others we should add?
Social Media Strategy
![The most effective types of content on social media in 2025 [new data]](https://53.fs1.hubspotusercontent-na1.net/hubfs/53/Copy%20of%20Featured%20Image%20Template%20Backgrounds%20(16).png)


-1.jpg)
.png)
![How to Create a Great Social Media Strategy in 2025 [+ New Data]](https://53.fs1.hubspotusercontent-na1.net/hubfs/53/social-media-strategy.webp)