

Even if you don't personally enjoy using Facebook, there's no denying the fact that it remains the largest social media platform in the world.
With over 2.8 billion monthly active users, anyone serious about marketing a business on social media needs to pay special attention to how they use Facebook.
To that end, we've curated the latest Facebook stats for 2021 to help you understand the social network better.
Whether you want insights on where to invest your ad dollars, or you’re interested in where to begin the buyer’s journey on Facebook or considering whether it's even worth it to use Facebook in 2021, you'll find all the Facebook statistics you need to know here.
Download Now: Free State of Marketing Report
[Updated for 2025]
Our Facebook stats are organized into five categories:
4. Facebook Marketing statistics
Facebook Statistics [2021 Data]
- Facebook has 58,604 employees.
- Facebook revenue for twelve months ending in December 2021 was $85 billion.
- In 2020, Facebook had an annual growth rate of 57%.
- 56% of people visit Facebook to get information.
- Facebook is the largest social media platform based on the number of monthly active users.
1. Facebook has 58,604 employees. (Source: Facebook, 2021)
2. Facebook revenue for twelve months ending in December 2021 was $85 billion. (Source: Facebook, 2021)
3. In 2020, Facebook had an annual growth rate of 57%. (Source: Facebook, 2021).
4. 56% of people visit Facebook to get information. (Source: Facebook, 2019).
5. Facebook is the largest social media platform based on the number of monthly active users. (Source: Facebook, 2021)
Mark Zuckerberg has grown Facebook from a startup in his Harvard dorm room to one of the most valuable companies in the world.
These stats show that Facebook has continued to enjoy increased revenue and overall company growth. Facebook remains a giant beside other social media platforms and doesn't look like it's dying anytime soon.
As a marketer, knowing where Facebook is and where it’s going gives you information about how you can use Facebook for your brand and best serve your customers on the platform.
Facebook Ad Statistics
- In 2020, Facebook reported Q4 ad revenue of $27.2 million, a 31% increase from 2019.
- The average price for an ad saw a 5% increase, while ad impressions grew by 25% in the fourth quarter of 2020.
- Mobile ads generated 94% of ad revenue in the second quarter of 2019, a 3% increase from 2019's Q1.
- Facebook’s ad revenue was $27.1 billion in Q4.
- The U.S. and Canada made up $13.7 billion of Facebook’s ad revenue in Q4.
- In Q3, 2020, Facebook had over 10 million advertisers on their platform.
- Facebook video ads have a low CPC, at $1.86.
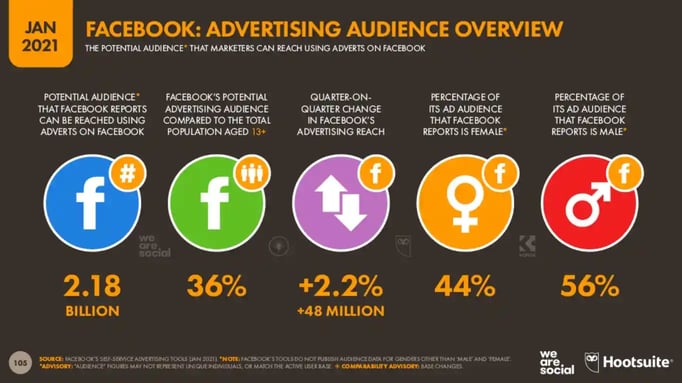
- Facebook ads have the potential to reach over 2.1 billion people.
- Facebook ads have the potential to reach over 2.1 billion people.
- On average, Facebook advertising generated $9.82 per user in Q4, 2020.
- Facebook ads provide the highest return on investment (ROI) among all paid advertising channels.
2. The average price for a Facebook ad saw a 5% increase while ad impressions grew by 25% in the fourth quarter of 2020. (Source: Facebook, 2020)
3. Mobile ads generated 94% of ad revenue in the second quarter of 2019, a 3% increase from 2019's Q1. (Source: Facebook 2019)
5. The U.S. and Canada made up $13.7 billion of Facebook’s ad revenue in Q4 (Source: Facebook, 2021)

11. Facebook ads provide the highest return on investment (ROI) among all paid advertising channels. (Source: Hubspot, 2020)
Advertising remains the biggest moneymaker for Facebook. As such, Facebook continues to look for ways to help marketers improve their ad results to keep spending money on the platform.
Now that you know Facebook ads by the numbers, how does your brand fit in with long-term ROI? Are you spending too much or too little?
Facebook User Statistics
- 69% of Americans use Facebook.
- 42% of American teens use Facebook.
- 37% of U.S. adults get their news from Facebook.
- 73% of U.S. adults visit Facebook every day.
- 98% of Facebook users access the app on mobile.
- 6. Facebook reported that 5% of profiles for monthly active users (MAUs) were fake and removed them in May 2019. That’s 120 million accounts.
- In the fourth quarter of 2020, Facebook flagged and removed 1.3 billion registered user accounts before they became active on the social network.
- Daily active users (DAUs) on average for Q4 were 1.8 billion, an 11% increase year over year.
- Facebook has 2.41 billion monthly active users (MAUs), a 12% increase year over year.
- In 2020, 30% of Facebook’s audience was under 25.
- Facebook users aged 65+ is 5%.
- 1.1 billion Facebook users speak English.
- 17.3% of Facebook’s active users access the social media platform from their desktop.
1.69% of Americans use Facebook. (Source: Statista, 2021)
2. 42% of American teens use Facebook. (Source: Pipersandler, 2020)
3. 37% of U.S. adults get their news from Facebook. (Source: Pew Research Center, 2019)
4. 73% of U.S. users visit Facebook every day. (Source: Statista, 2020)
5. 98.3% of Facebook users access the app on mobile. (Source: Statista, 2021)
6. Facebook reported that 5% of profiles for monthly active users (MAUs) were fake and removed them in May 2019. That’s 120 million accounts. (Source: HuffPost, 2019)
7. In the fourth quarter of 2020, Facebook flagged and removed 1.3 billion registered user accounts before they became active on the social network. (Source: Facebook, 2021)
8. Daily active users (DAUs) on average for Q4 were 1.8 billion, an 11% increase year over year. (Source: Facebook, 2021)
9. Facebook has 2.41 billion monthly active users (MAUs), a 12% increase year over year. (Source: Facebook, 2021)
10. In 2020, 30% of Facebook’s audience was under 25. (Source: Statista, 2021)
11. Facebook users aged 65+ is 5%. (Source: Statista, 2021)
12. 1.1 billion Facebook users in speak English (Source: We Are Social, 2021)

13. 17.3% of Facebook’s active users access the social media platform from their desktop (Source: We Are Social, 2021)
It’s essential to know how much of your audience is on Facebook to position your marketing strategy. Do you have thousands or millions of your target audience using Facebook?
Knowing if your market uses Facebook would help you understand what kind of content to create.
Optimizing content for desktop and mobile-based active users will also make your content more attractive to potential customers.
Facebook Demographics Statistics
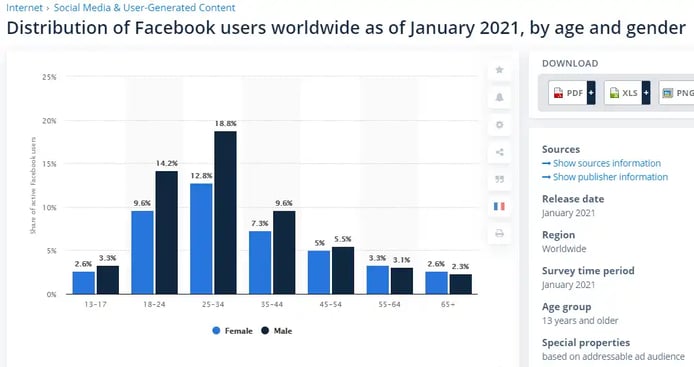
- Women in the 25-34 age group make up 12.8% of Facebook’s global active users.
- Men between the ages of 25-34 make up the most significant demographic group, at 18.8%.
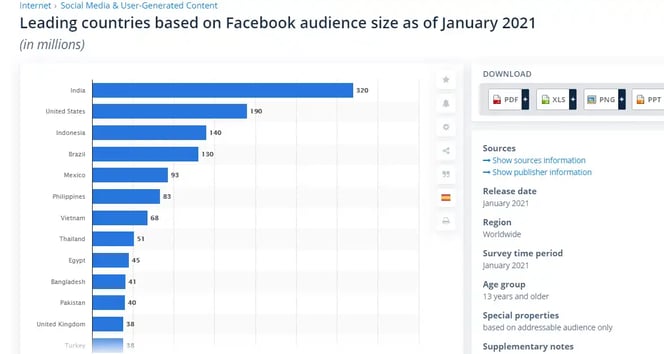
- India is the country with the most Facebook users, with 320 million users.
- Facebook users are 56.8% male and 43.2% female.
- There are 1.2 billion users from Asia on Facebook.
- Over 419 million users use Facebook monthly in Europe.
- Over 85% of Facebook’s daily active users (DAUs) come from outside of the US and Canada.
- 61.3% of Facebook users are under 35.
- Facebook usage is high among U.S adults who earn more the $70k annually.
- 70% of U.S adults use the Facebook platform every day.
- More than 1.8 billion people use Groups every month.
4. Facebook users are 56.8% male and 43.2% female. (Source: Statista, 2021)
5. There are 1.2 billion users from Asia on Facebook. (Source: Statista, 2021)8. 61.3% of Facebook users are under 35. (Source: Statista, 2021)
11. More than 1.8 billion people use Groups every month. (Source: Facebook, 2020)
Facebook's monthly average users are climbing. That means more of your audience is continuously checking Facebook, and your potential audience reach of over 2.18 billion users is growing.
Many users from different demographics and age groups also see your content, so it’s a good idea to keep that in mind when strategizing campaigns.
Facebook Marketing Statistics
- In 2018, 78% of US consumers made purchases through discoveries on Facebook.
- In 2019, 15% of Facebook users used the social platform to look and shop for products.
- 93% of businesses are active on Facebook.
- Over 200 million businesses use Facebook's apps and free tools.
- On average, 35.7% of posts from a Facebook page are images.
- Link posts receive 73% less engagement than video posts.
- The median engagement rate across all industries on Facebook is 0.08%.
- U.S adult users spend an average of 33 minutes per day on Facebook.
- More than 3.3 billion people use Facebook’s family of services (Facebook, WhatsApp, Instagram, or Facebook Messenger) every month.
- Facebook Stories has 500 million daily viewers.
- 4.6% of marketers use Facebook video ads.
- 35% of marketers report successful influencer campaigns on Facebook.
1. In 2018, 78% of US consumers made purchases through discoveries on Facebook. (Source: Kleiner Perkins, 2018)
2. In 2019, 15% of Facebook users used the social platform to look and shop for products. (Source: eMarketer)
3. 93% of businesses are active on Facebook. (Source: Buffer, 2019)
4. Over 200 million businesses use Facebook's apps and free tools (Source: Facebook, 2021)
5. On average, 35.7% of posts from a Facebook page are images. (Source:We Are Social, 2021)

12. 35% of marketers report successful influencer campaigns on Facebook. (Source: Buffer, 2019)
These stats provide more direction about where your strategy should head to earn more numbers on Facebook. For example, if you have a video of your company’s weekly Waffle Wednesday event, post that instead of the link to your blog post, which you can save for Twitter Cards.
Facebook Video Statistics
- In 2018, users aged 18-24 have 75% less of an attention span for video ads than users who are 65+.
- More than 1.2 billion users visit Facebook Watch per month.
- Users are 1.5 times more likely to watch a video on their phones.
- Facebook pages with over 100k followers published 17.6% of all the videos on the platform in 2020.
- Videos between 2 and 5 minutes gather more engagement from social media users.
- 62% of people have reported being more interested in a product after seeing it on a Facebook video.
- Video promotions are equally as important as photo promotions.
- Only 12% of brands use Facebook for live videos.
- 81% of businesses prefer video marketing on Facebook.
- Facebook is the second most popular video property behind Google.
- Politics is the highest category of Facebook Stories, at 36%.
1. In 2018, users aged 18-24 have 75% less of an attention span for video ads than users who are 65+. (Source: Facebook, 2019)
2. More than 1.2 billion users visit Facebook Watch per month. (Source: Facebook, 2020)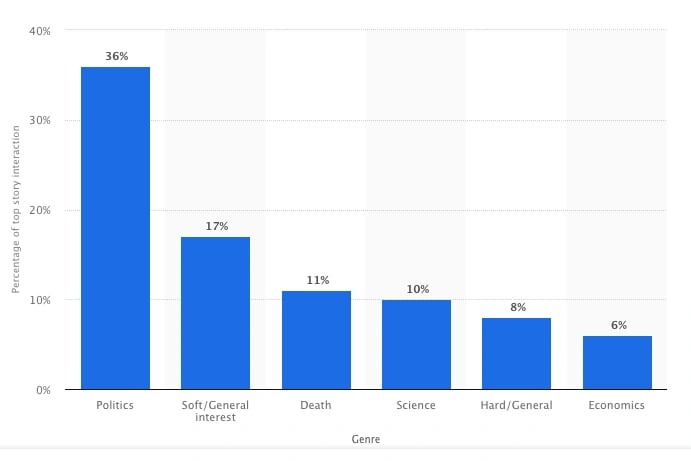
Facebook videos are massively popular and have an immense appeal to younger users of the site. If you have products to promote, videos have your back and your target audience.
Keeping up with Facebook is an essential factor in planning strategy. Not only because Facebook owns other platforms, like Instagram, but they also influence more than one channel of your planning.
The data also show that posting videos is the way to go for huge Facebook pages that want more engagement.
For more information on using Facebook in your social media planning, check out our ultimate guide here.


![Anatomy of a Facebook Ad: How to Create Scroll-Stopping Campaigns [+ Examples]](https://53.fs1.hubspotusercontent-na1.net/hubfs/53/anatomy-of-a-fb-ad.png)


.jpg)
![What Is Facebook CBO? Budget Optimization Done Right [Tutorial]](https://53.fs1.hubspotusercontent-na1.net/hubfs/53/facebook-cbo.jpg)