According to Social Media Examiner's annual Social Media Industry Report, 64% of marketers in 2014 spent more than six hours per week on social media initiatives. In other words, we spend over twenty-five hours in an average month, or a whopping total of thirteen days of our lives each year joining the conversation on Facebook, LinkedIn, Twitter, Google Plus, and others.

That said, most of us face a real roadblock when it comes to analyzing the impact social media has on our bottom lines. Nine in ten marketers struggle to answer the question of which social tactics are most effective, and barely more than a third of us even begin to measure the ROI of social.
In this post, we'll lift the black box from social reporting by walking you through the three HubSpot tools that are most critical to understanding the impact of social media on your business:
- Social Reports, under the "Social" tab within HubSpot
- Sources Reports, which can be found and customized under Reports > Sources.
- Companies Reports, an Enterprise-only feature found within Reports Home
1. Social Reports
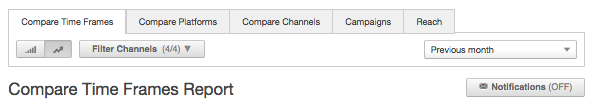
To get a close-up snapshot of how your social publishing efforts have panned out, your first stop should be the Social Reports tool in HubSpot. Social Reports provide five default reports for you to assess your social media success over time. Each report is broken into three uniquely valuable sub-sections. In the next few paragraphs, we'll walk you through the "Compare Time Frames" report as an example.
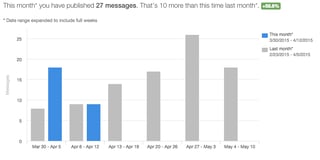
Here’s What You’ve Published
In this section, you'll see the number of total messages published in the time period selected in the upper-right hand corner.
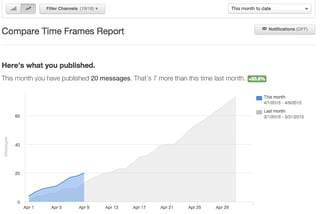
Use this chart to get an understanding of the volume of your efforts in the given time range. Has your team kept up publishing to the extent it did last month? In truth, there's no magic number for social posting. It's all about finding the sweet spot with each platform for each of your company's buyer personas.
Pro tip: Toggle the report to the "Bar Chart" in the upper-left to get a more granular look at the data.
Here’s What Your Followers Thought
The second subsection gives you comparative data on how your audience engaged with your social posts during your specified time period, as compared to the previous.
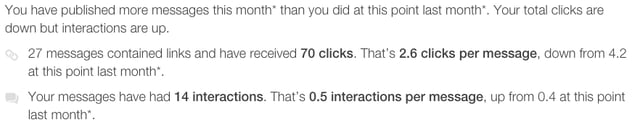 In the first bullet point, we're comparing the number of clicks for your messages. In other words, how many of your followers and fans opened a link contained within one of your social messages. In the second bullet point, we're identifying trends in interactions, like mentions, replies, comments, likes, favorites, retweets and +1’s on your published content. If you want to break the interactions out into their individual types, you can choose to see them individually under the corresponding chart.
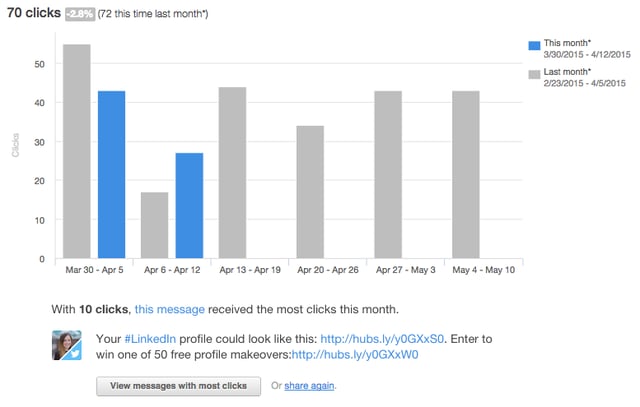
Note also, in the above chart, that we point out the messages that received the most engagement, for both clicks and interactions.
Overall, the goal of measuring engagement in social media is to understand how effective you've been in joining the conversation within your industry. Have you published content that has resonated with your target audience more and more over time? Have you been asking the right questions, and providing the right commentary? If you see that your engagement over time has improved, identify and document trends behind why that was the case. Perhaps you included more educational links this month or used hashtags and images more often than usual. If you see your engagement dipping, use your best-performing messages to isolate your most effective strategies, and emulate these in your posts moving forward.
Here’s the Impact On Your Business
The final subsection shows you how many fans and followers you gained on social media this month, as well as how many visits to your website social media, as a channel, has contributed. In short, this data allows you to determine how well your social efforts have expanded your brand's reach, and, equally importantly, how well your posts have done in bringing new sets of eyes to your website.
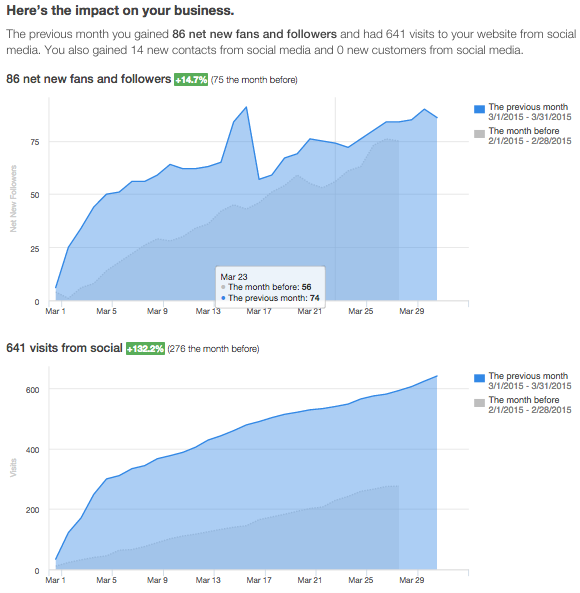
Use this subsection to present the high-level impact of your social publishing to your team internally. These reports can be especially useful for monthly marketing meetings. Download a screenshot tool, like Jing, take a snapshot each month and show your CEO how well the team has been performing!
Pro Tip: To make your regular reports even easier to access, sign up for your Social Inbox notifications by clicking "Notifications" in the upper-right of your screen, then selecting "Monthly Email Summary."
These three subsections are present throughout the five individual reports within Social Reports in HubSpot. In this post, we won't walk you through each report in-depth --- you can find the full rundown here. For your reference, here's a quick summary of the other four.
- Compare Platforms --- Understand which platforms (LinkedIn, Twitter, Facebook, etc.) are impacting the business the most. An example takeaway from this report might be that Twitter drives TONS of new followers to your account, but Facebook is more effective in driving visitors back to the site.
- Compare Channels --- Dig into each platform to identify the specific accounts that are contributing to your successes. For example, your Twitter success may be tied to great engagement with one of your employees' personal feeds.
- Campaigns --- Break down your social performance by individual marketing campaigns.
- Reach --- Analyze tabular and graphical information on your aggregate number of followers on each network, and its growth over time.
In sum, Social Reports are the perfect jumping-off point into analyzing your social success. But they don't tell the whole story. In the next two sections, we'll walk you through two other reports that speak more specifically to social's impact on conversions further down the funnel.
2. Sources Reports
Navigating to your Sources report (Reports > Sources), we get to see the payoff from our social efforts from another angle - this time, with a focus on how well our social traffic moves down our marketing funnel. From the default Sources report, click into "Social Media." In the ensuing report, you can see just how efficiently your website turns social traffic from visits to lead and customers. In the first column, you'll see a listing of the social platforms that have brought your site traffic in the specified time range. In the second, fourth, and sixth columns, the report shows the visits, contacts, and customers, from each respective platform. The columns in between dig into the specific conversion rates from one metric to another --- for example, what percent of our website visitors from a specific platform converted to leads?
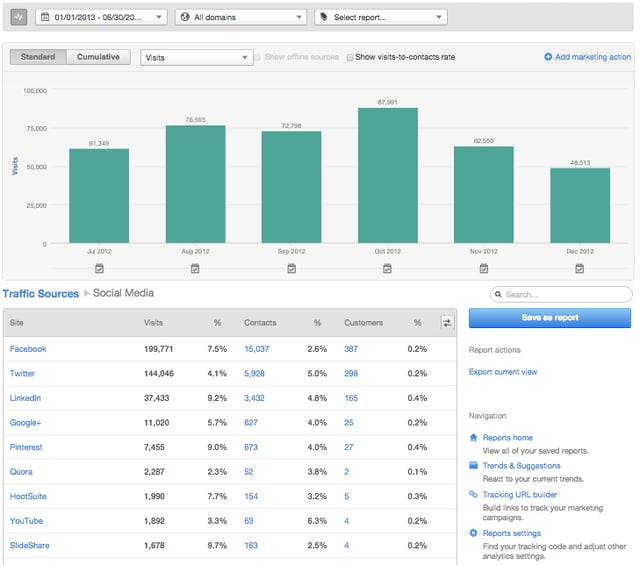
What specific takeaways can we pull from this data, and how can we utilize it to dictate our content strategy moving forward? Take a look at the chart above. Just to note, this is sample data, and shouldn't be taken as prescriptive planning advice. First, notice that Facebook, Twitter, LinkedIn, and Google+ bring the most traffic to the website --- we'd expect this from the "big four" networks. However, a deeper dive into the data tells a different story. Notice the trend in visit-to-contact conversion rates in the third column. While they're not our breadwinners in terms of traffic, Pinterest and Slideshare bring
First, notice that Facebook, Twitter, LinkedIn, and Google+ bring the most traffic to the website - we'd expect this from the "big four" networks. However, a deeper dive into the data tells a different story. Notice the trend in visit-to-contact conversion rates in the third column. While they're not our breadwinners in terms of traffic, Pinterest and Slideshare bring high-quality traffic to this sample site, converting at over nine percent. In conceiving a social strategy moving forward, if we have specific goals around lead generation, we should double down our efforts on those two platforms. Of note as well, leads that come from YouTube convert to customers at the highest rate of any platform.
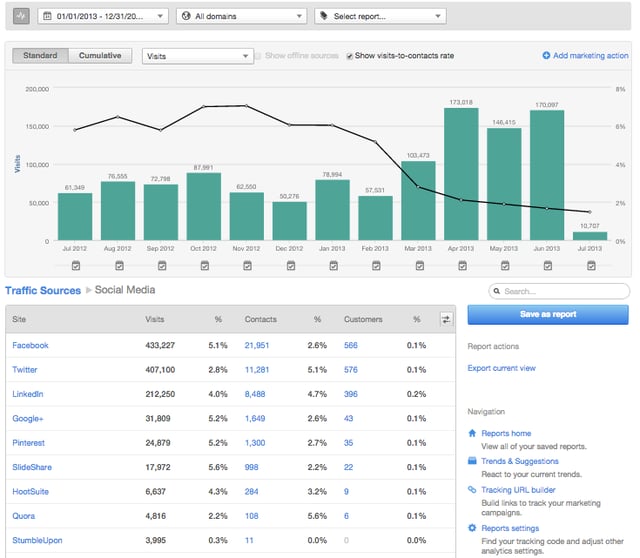
Pro Tip: Check off the "Show Visits-to-Contacts Rate" checkbox at the top of the report to add a conversion rate trendline over time. This additional data allows you to zoom in on the effectiveness of your site in adding contacts to your email database. In the example below, note how much the conversion rate of our sample site dipped over time. What changes were made along the way that might've contributed to such a dip? Perhaps we lengthened our forms, or changed the cadence of posting our lead generation offers over time. This view enables us to track the trends in social conversions over time, which is pivotal in proving its worth.
3. Companies Reports
So far, we've seen two reports that provide both a high-level overview of our social activity and a detailed look at the way in which our social traffic moves through our marketing funnel. We have yet to mention the most important effect of social media on a business - its impact on the bottom line. That's where the Companies Report comes in.
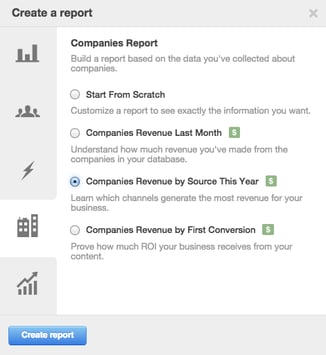
- First, navigate to your Reports Home, and choose "Create a new report."
- On the ensuing modal, select "Companies Report."
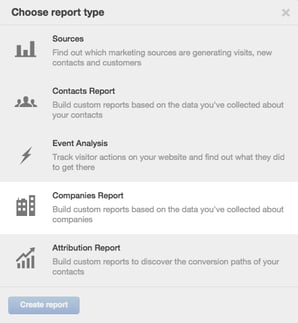
- Next, you will be presented with the option to "Start From Scratch," as well as several pre-built reports to choose from. For this example, select "Companies Revenue by Source This Year."
Below, you can see the final result. In the graph you have an overview of how much revenue you made each month and the source it originated from. In the table below, you have more details about how many companies that source generated as well as the amount of revenue associated with each source.

Use this report to pinpoint precisely how your social efforts at the top of the funnel impact the business's bank account. In the above example, we see that twenty-eight companies closed during the time frame selected, worth an average of about five thousand dollars each. When your boss asks you if social media is worth it, this should be your final answer.
Please note that the above report is best utilized for a B2B company. If your company is B2C, you'll set up a similar pre-baked report with a Contacts Report. Here is what the report would look like if we ran it as a Contacts Report. As you can see, it is similar except for the Contacts column, which shows the number of Contacts associated with each source instead of the number of Companies.

In addition, note that this report is only available at the Enterprise level of HubSpot, and you'll need to store revenue in a specific way in order for HubSpot to display it in this report.
To sum up, next time you tell your boss how worthwhile your six weekly hours on social media really are, and they tell you, "Prove it!", show them these three tools within HubSpot: Social Reports, Sources, and Companies Reports. In doing so, we can all promise that, next year, you won't be a part of the two-thirds who fail to measure social ROI.
In the comments below, let us know your favorite reports for measuring social ROI!