
Social media reporting is your team’s time to evaluate how it’s doing with the medium truly, communicate that to your company at large — and maybe even brag a little bit.
So, how do you put together one that does all of this effectively? Read on for step-by-step instructions on how to create a social media report and some great social media report templates to help you get going even faster.
Table of Contents
Free Social Media Report Template
Share the results of your social media campaigns clearly and efficiently. Highlight your:
- Mentions.
- Engagement.
- Impressions.
- And more!
What is a social media report?
A social media report is a summary of how a business’ social media platforms and efforts on them are performing. I’m not talking about the analytics dashboards used to monitor and track social media performance in real time here.
Social media reports can include raw metric data (followers, successful clickthrough rates, likes, post shares, purchases, etc.) but focus more on delivering the big picture. Think greater trends, insights, and progress toward goals.
Types of social media reports
A social media report can take any shape you need, but, in my experience, it’s not uncommon to create smaller, niche reports to focus on critical areas.
Platform-specific
How’s Instagram doing for your brand? How about YouTube? Every social media platform has its unique culture and nuances, and these reports allow you to tailor your analysis and discussions to them more precisely.
Campaign-specific
Did you launch a new product? Maybe publish a content offer to generate leads? You can also use a social media report to discuss campaign-level analytics.
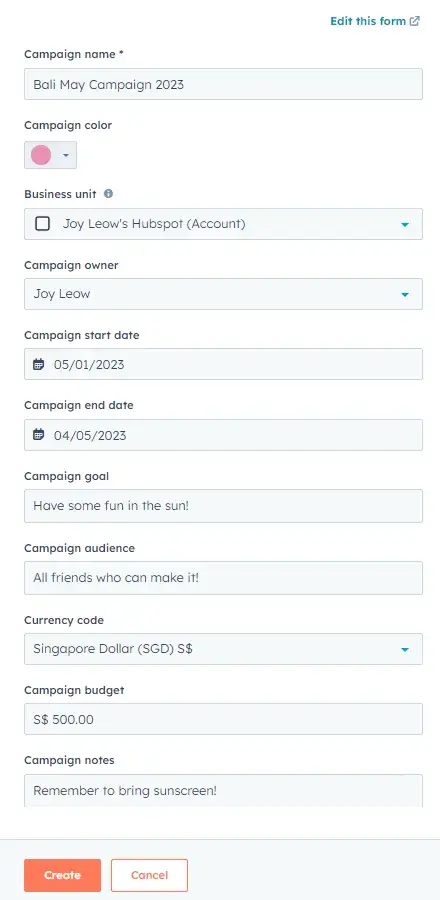
If your social media account is serving as a cog in a larger company initiative, this report helps you see and compare just how much each platform contributed to the project's success. (HubSpot Campaigns have always been helpful in this for me.)
Paid media versus earned media reports can also fall into this category.
Metric/Goal-specific
Was your team focused on boosting website traffic? How about boosting sales? Goal-specific reports, like campaign-specific, let you analyze and discuss how each platform helped you work toward a specific accomplishment.
Why use a social media report?
Social media doesn't just affect marketing. Prospects ask questions, customers write reviews, and others may follow you for thought leadership, education, or company news. It touches nearly every aspect of your organization and customer experience.
So, gathering and distributing the state of your social media channels via a social media report shows transparency, encourages cross-company alignment, and helps everyone work towards their goals.
A social media report is also arguably the most concise and clear way to update your team or stakeholders on these matters — daily, weekly, monthly, quarterly, and/or annual.
HubSpot's free social media report template has pre-made slides for you to report on all of your predominant social media metrics.
Download the template today and simply plug in your metrics to customize your organization's social media report.
What should your social media report include?
The fine details can vary, but every great social media report tends to include four elements. Keep in mind, that what you call these doesn’t really matter, but you want to make sure you accomplish each of their purposes in your final product.
Report Overview
Think of this as the executive summary of your social media report.
It’s where you document the most important themes and findings of your larger document or presentation to set expectations of what’s to come. It’s also helpful to busy executives who may not have time to read or sit through an entire presentation.
Goals & Initiatives
What are you trying to accomplish with social media? Recapping these in your social media report gives the rest of the information context and direction. Knowing your goals tells the audience what information they should be looking for.
Metrics Analysis
You don’t need to include all the facts and figures, but you do want to include some overarching metrics related to your goals. For example, if you are trying to generate more leads, you’ll want to include your average conversion rate.
But the main focus here should be analysis. Talk about what trends you see.
Read: Social Media Analytics: The Ultimate Guide
Free Social Media Report Template
Share the results of your social media campaigns clearly and efficiently. Highlight your:
- Mentions.
- Engagement.
- Impressions.
- And more!
Key Takeaways & Recommendations
What story do your metrics tell? What conclusions can you draw about your strategy from them? What do they say about your goals? And most importantly, what do you do next?
Your social media report should capture insights on your strategy, campaign, audience, content, and any suggestions for moving forward.
What social media metrics should you include?
Remember, not every social media platform performs the same. In fact, our research shows that usage doesn’t necessarily equate to ROI.
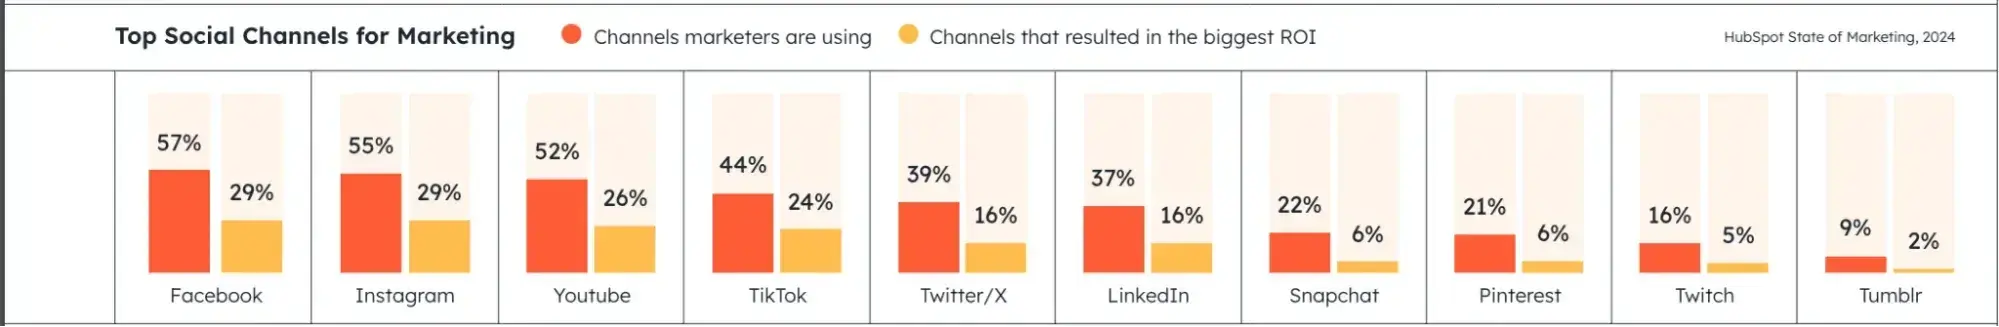
Because of this, your metrics, trends, and goals for every platform may differ, along with what goes into your social media report.
Some metrics are also just going to be different due to the nature of the platforms — I mean LinkedIn doesn‘t let you retweet, and X doesn’t let you click a cry-face button.
Every team’s social media report may look different, but let’s take a look at some of the most common metrics to include to help you figure out what makes sense for you.
1. Audience Size and Growth (Followers)
This metric tells you how large your reach is and how quickly it is growing. It is typically seen as the core social media metric, showing how large an audience you can leverage with your posts and content.
2. Post Frequency
This is pretty self-explanatory, but this metric represents how many times you posted in a given time period. It’s usually compared alongside other metrics — such as engagement rates — to help you determine the right cadence for your audience.
This metric should also be channel-specific because it makes sense to post more frequently on some channels than others.
3. Post Engagement
Post engagement measures how your fans and followers are reacting to your posts with likes, comments, and shares. A healthy post engagement suggests you have a loyal audience — and that your content is reaching them.
You can also track engagement as a percentage of your audience to determine engagement rate.
4. Mentions
One metric you have less control over is mentions. You can track mentions from customers, prospects, and even news outlets to gauge the perception of your business and brand online.
5. Clickthrough Rate
When a post links to a page on your website, you can measure how many people and what percentage of your audience clicked through to the page.
A strong clickthrough rate shows you're sharing website pages that your audience finds relevant.
6. Conversions & New Contacts
Conversions come into play if you‘re using social media to generate leads, subscribers, or even customers.
If you want to attribute contacts to your social media team’s efforts, make sure you‘re using proper tracking and setting reasonable goals, as it’s rare in some industries to go straight from social media to becoming a customer.
7. Return on Investment (ROI)
Directly tracing ROI to social media efforts can be tricky. However, if you determine it's worth reporting on this metric, ensure you have established proper expectations and attribution models.
Read: How to Measure Social Media Marketing ROI [With Expert Advice]
8. Cost per mile (CPM) / Cost per click (CPC)
This metric is essential for monitoring the performance of your social media ads. Similar to ROI, it helps you evaluate how you know how much you’re spending in relation to what you’re getting. You can ignore this if you're solely reporting on organic social metrics.
9. Competitor Metrics
To provide a benchmark, consider analyzing the aforementioned metrics for your competitors.
Obviously, these metrics can vary drastically based on publicity, paid budget, and the size of the company, but it's still worthwhile to make the comparison.
Note: You can track all of these social media analytics in HubSpot. Lucky you.
Free Social Media Report Template
Share the results of your social media campaigns clearly and efficiently. Highlight your:
- Mentions.
- Engagement.
- Impressions.
- And more!
How to Create a Social Media Report
Step 1: Identify your social media metrics.
As we‘ve established, different companies and different social media teams value different social media metrics. It’s your job to choose the metrics that matter most to your team and your organization.
Keeping in mind the list from above, the specific social media platforms you use, and your goals, narrow down the metrics you need to present to your team.
For instance, if you’re focused on building brand awareness, you’ll want to highlight follower numbers and views. If your goal is website traffic, you’ll want to look at clicks.
Pro tip: When I’m unsure of what to include or my report feels a little incomplete, I ask my peers which metrics they'd like to see or which ones they need clarification on. Making these changes sooner rather than later helps keep your team informed and engaged.
Step 2: Gather your data.
Once you know what you‘re reporting on, it's time to start collecting data.
When setting up your social media reports, create bookmarks for your data sources. Make a folder for the analytics page for each social media channel you’re analyzing and/or your social media reporting software for an all-encompassing view.
If you‘re tracking click-throughs to your website, make sure you’re analyzing from a single master location, such as your tracking URL builder or your traffic tracking tool like HubSpot or Google Analytics.
Step 3. Choose your report format
Think about who your audience is and how they best consumer information.
Perhaps that’s a social media report presentation, spreadsheet, or memo template. Perhaps it’s a combination of a few formats, along with a video walk-through.
Pro tip: Whatever you choose, stick with it.
A consistent format brings familiarity, making comparing and understanding future updates easier. Plus, when you maintain your format, you can just copy over your most up-to-date metrics rather than reinventing the wheel every time.
Optional: Choose your social media report template
If you’re just getting started, we suggest using a social media report template to make your life easier. For instance, a PowerPoint or Google Slide Deck template can be shared with your team via email, used for in-person meetings/presentations, or both.
Need a social media report template to get started? We’ll share a few options later, but you can’t go wrong with ours.
Step 4: Analyze performance
With all of your data in place, it’s time to analyze.
What metrics went up or down? What posts did well or not so well? What does this say about your performance? How about the progress toward your goals?
Use this time to really dig in and see what your metrics are telling you.
Pro tip: AI has helped me a lot in this area. Check out our free guide, “How to Use AI for Data Analysis”
Step 5: Summarize highlights and add context
Next, summarize the key findings and highlights from your analysis. Don’t just think quantitatively here; think qualitatively.
Maybe a major celebrity commented on content for the first time, or you saw a record number of shares. Make sure to capture these in your report as well.
Also, add context to help your audience better understand the story you are telling. What do I mean by this?
A social media report should always remind people where you came from and where you plan to go. That means addressing how your numbers have changed since the last period of time you presented, in addition to why they changed.
Talk about how this compares to your competitors and how you are tracking toward your goals. Even if people’s eyes glaze over when you talk numbers, these highlights can win them back and get your message across.
Step 6: Add Visuals
A chart of numbers on a slide deck is, well, pretty boring.
While a numerical chart is important for sharing as much info as possible in an organized way, using visuals is a better way to convey the growth and success metrics your social media performance relies on.
Try incorporating one or all of the following into your social media reports:
- Linear graphs to show followers over time.
- Pie charts to show clicks to different pages of your website (blog pages vs. case studies, for example).
- Bar graphs to show the number of engagements on each platform.
- Typography highlighting key trends or findings
- Screenshots of top or low-performing posts
These examples are more eye-catching than cold numbers on a slid, and they further illustrate what you want your team to walk away with. Plus, you can easily make them on Canva.
If data visualization is new to you, check out our Guide on Data Visualization for Marketers.
Step 7: Make Recommendations
Each report should contain clear action items about how you plan to continuously improve your social media performance. Social media is constantly evolving, so your approach and strategy for it should, too.
Free Social Media Report Template
Share the results of your social media campaigns clearly and efficiently. Highlight your:
- Mentions.
- Engagement.
- Impressions.
- And more!
Social Media Report Templates
Creating your own social media report from scratch can be labor-intensive. Using a template to stay organized can help lighten the load. Here are four of my favorite options.
1. HubSpot
Ok, maybe I’m biased, but I’m a big fan of our free social media report template here at HubSpot.
What I like: It gives you something simple and neat to present, and you can customize it to fit the goals, platforms, and frequency you actually need. I also love that the template starts with an overview of all your owned social media channels on the first page.
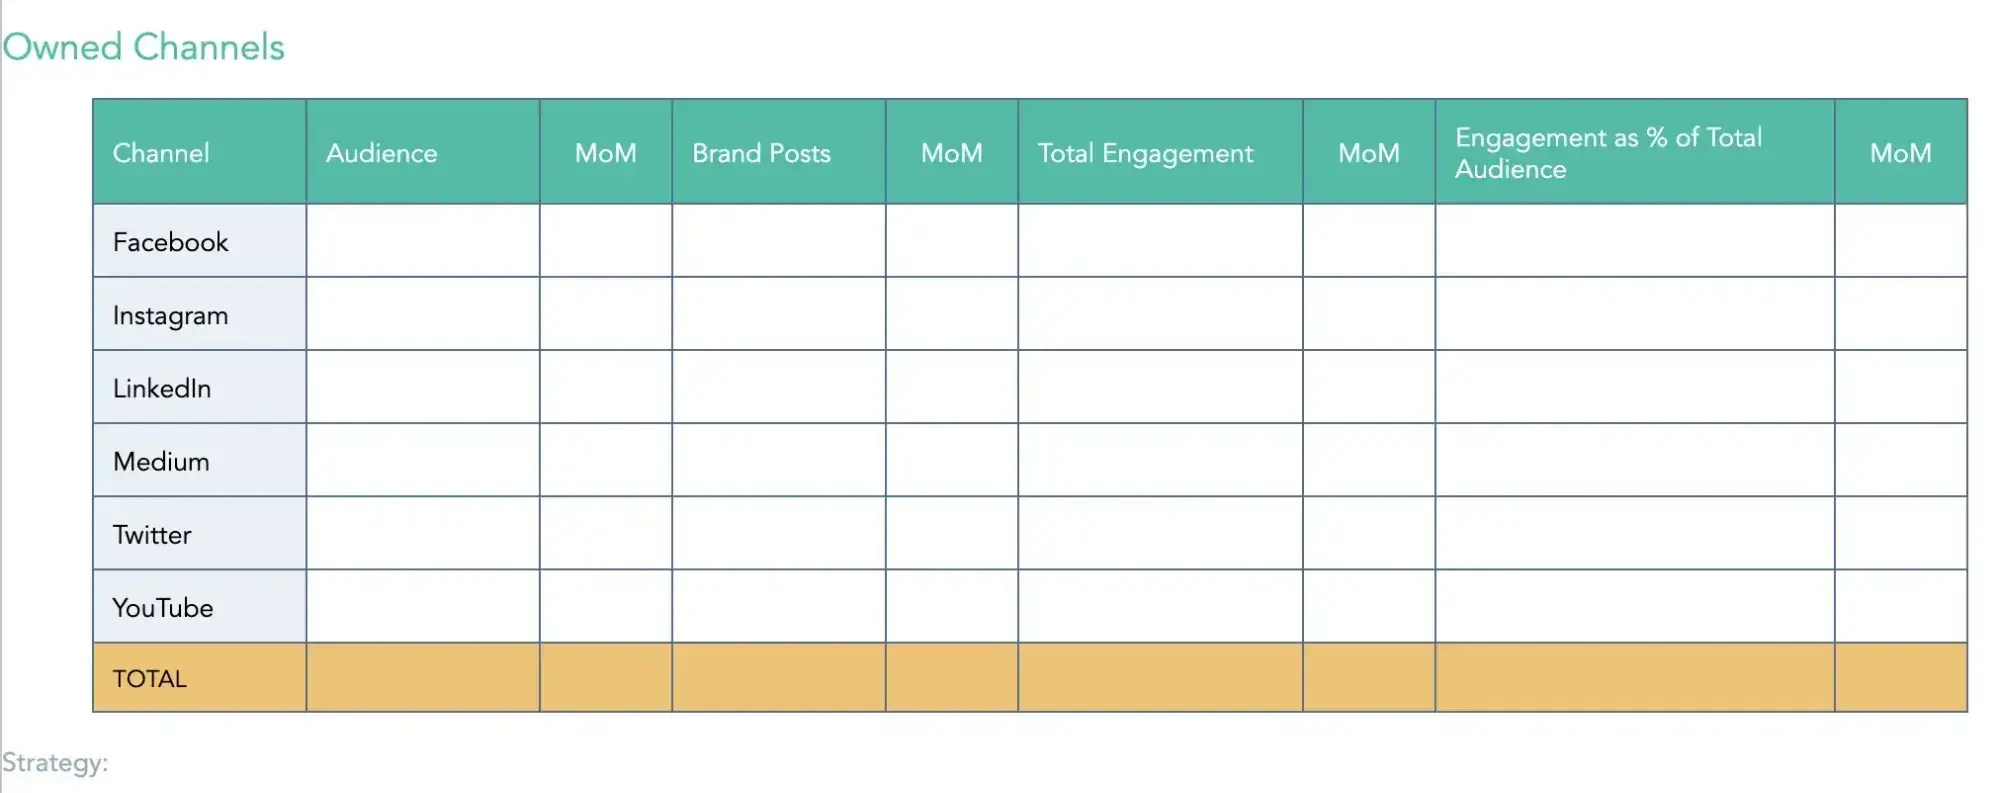
With this, you can see your audience for each channel, how many posts you made, how they performed (engagement), and what this looks like as a percentage of your total audience at a glance.
Then, on the following slides, you can explore each specific platform, its goals associated with it, and even its top posts.
Overall, this social media report template is the perfect blend of highlights and details. Plus, it’s available as a Word Doc, PowerPoint, Google Doc, or Google Slides deck, making it accessible to a wide audience.
2. Later
If you’re looking for something a bit more designed, Later has a free social media report template for you to try as well. But there are a few caveats.
This template only comes in one format — an editable Google Slides deck — and is organized as a monthly report. The design also could be too playful for some, however, you can edit it to match your personal cadence and brand.
To get started, you simply have to make a copy and plug in your information, but that said — you do need to have a Gmail account to take advantage of it.
What I like: While prioritizing Instagram (Later is an Instagram tool, after all), it does include charts for all social media platforms. You also can easily clone and edit fields to make the deck work for other platforms.
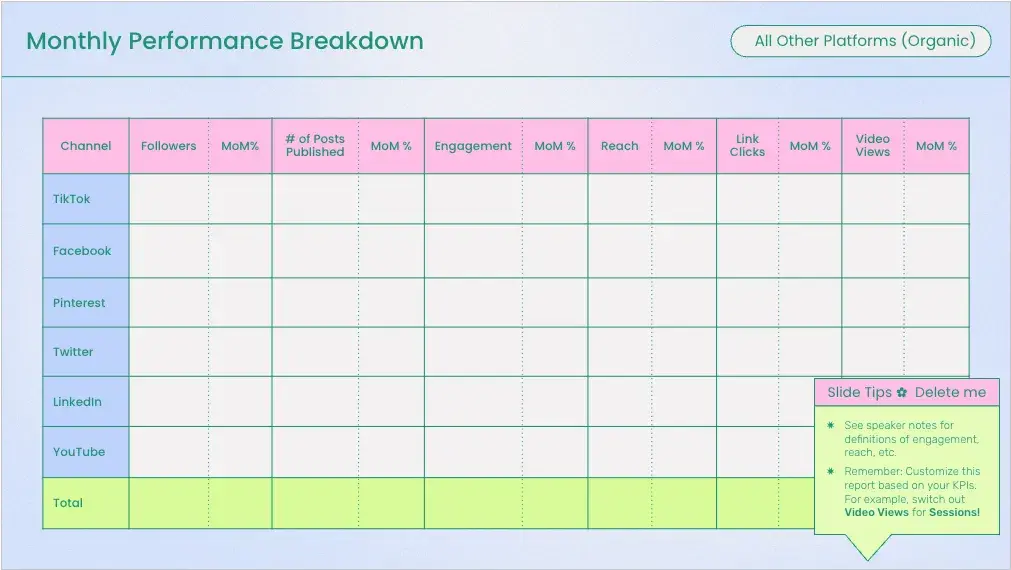
I’m also a fan of the key learnings slide. It makes it easy to get all of the most important information in one place.
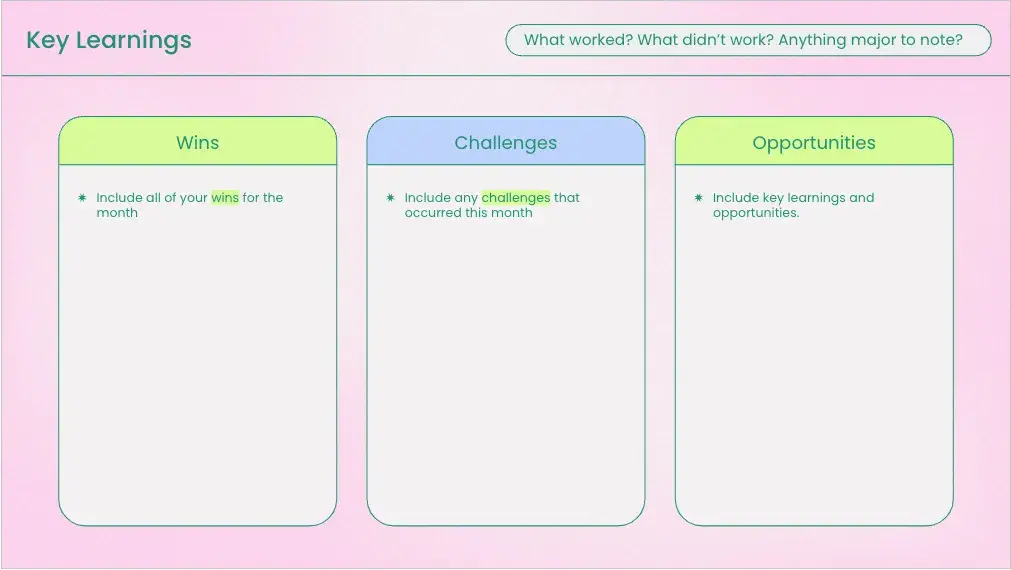
3. Hootsuite
Next, we have a social media report template from Hootsuite.
Like Later’s, this template comes with an editable Google Slides deck that you need to copy to use. It also has a well-organized and visually pleasing design that you can edit to match your brand colors.
I’d say this design is more universal and adaptable than Later’s.
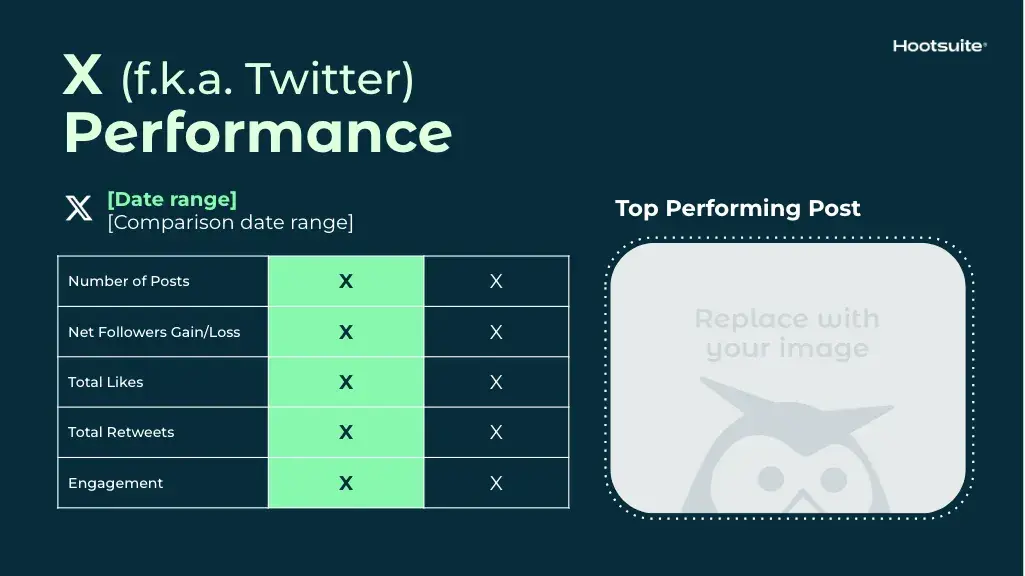
What I like: I love how this template includes instructions on how to fill it out right in the document. It makes it easy to complete slide by slide and it’s cadence agnostic.
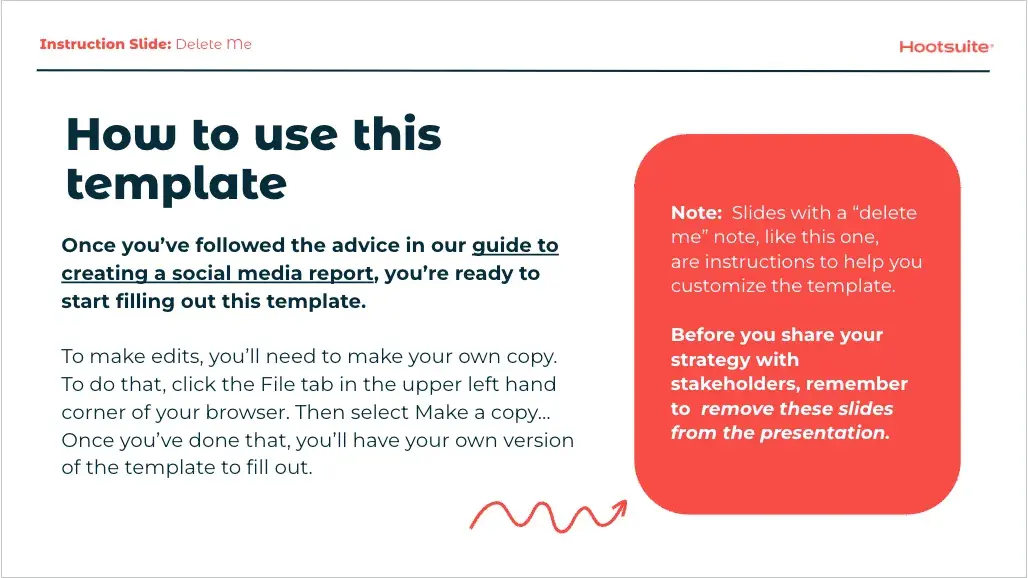
It also has dedicated slides for all major social media platforms already, highlighting key information like clicks, likes, and top posts as well as platform-specific metrics like retweets.
4. The CMO Club
Last up is the social media report template from The CMO Club. And, as you might guess with a chief executive audience, this one is all about the data. Unlike our other options, this template comes as an editable Google Sheet.
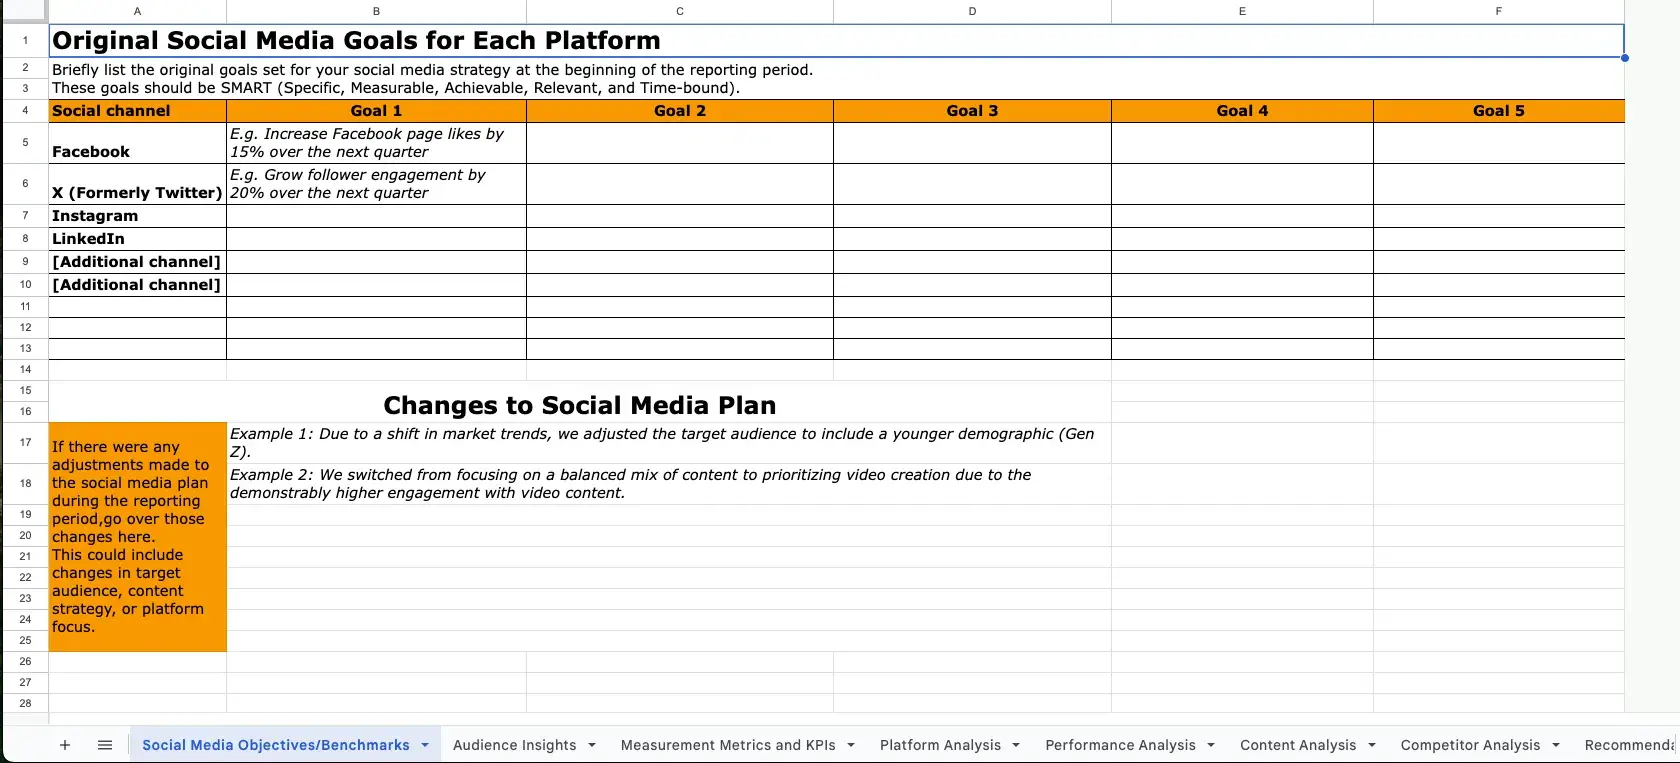
What I like: While less suited for a presentation, this social media report template gets extremely granular about your strategy's numbers and metrics.
It has separate tabs for crucial information your decision makers will want to see like:
- Objective and Benchmarks
- Audience Insights
- Metrics and KPIs
- Platform Analysis
- Platform Analysis
- Content Analysis
But it still ends with recommendations and key takeaways.
Pro tip: if you’d like to get more creative and visual with your social media report than what these templates offer, Adobe and Canva have a bunch of free designs you can experiment with.
Social Media Report Examples
Now, most social media reports are confidential (for obvious reasons), but I was able to find a small handful of examples to give you an idea of what a finished product may look like.
1. Top Performing Posts
In addition to creating a great template, Later offers an extremely helpful social media report example on its blog using it.
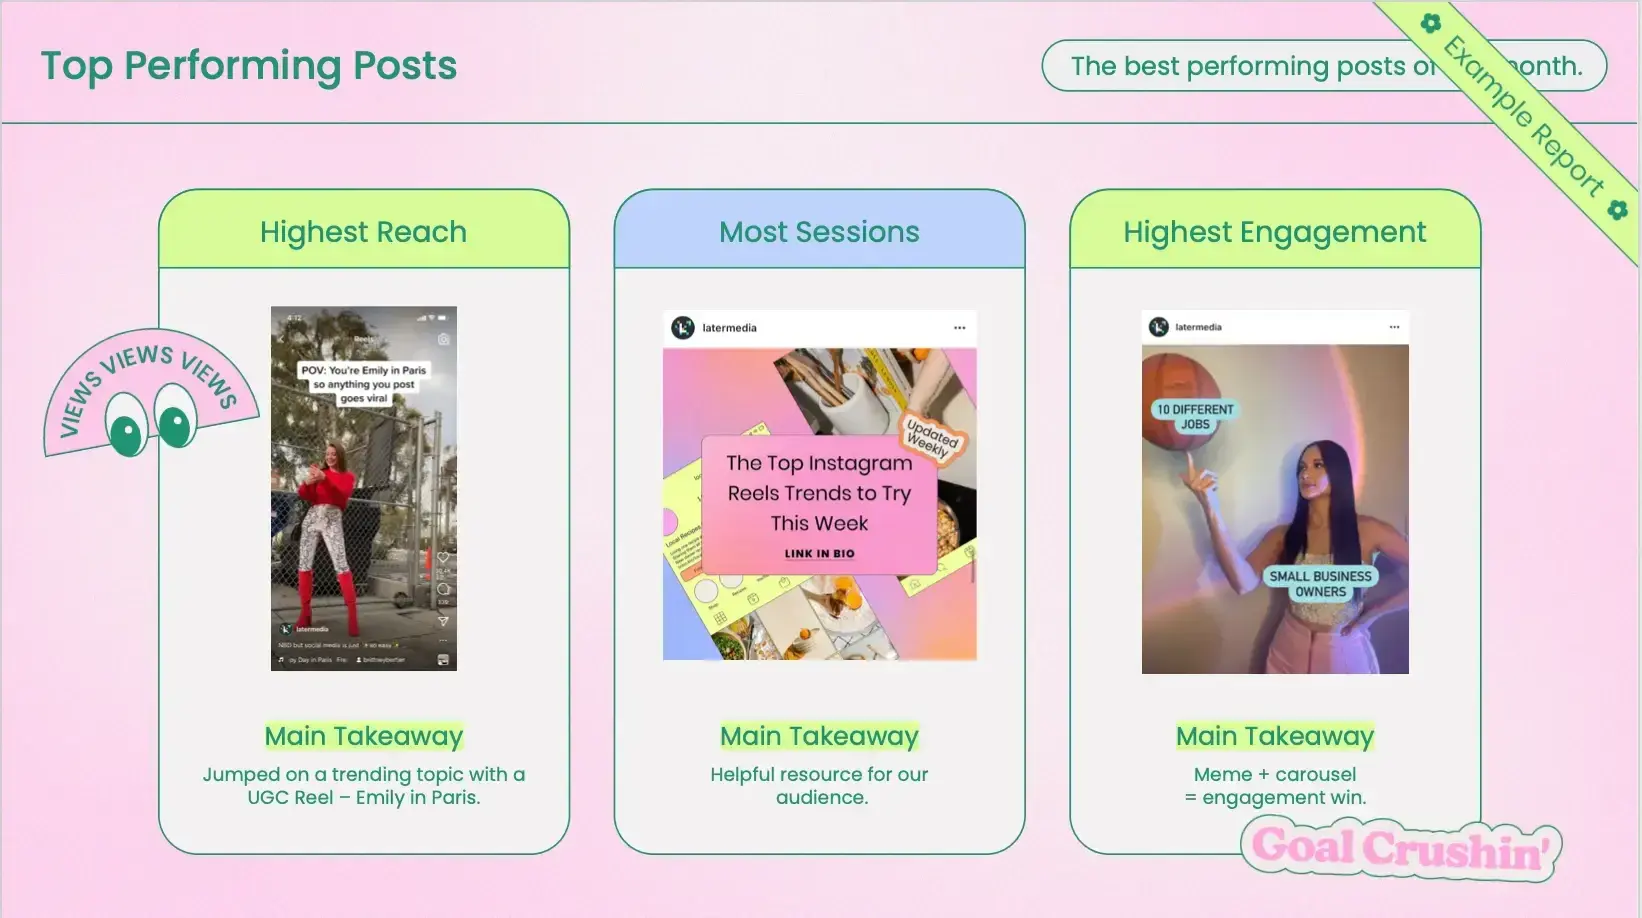
Here, you’ll see an example of a top-performing post slide. Not only does it show the actual posts and what it accomplished, but it also offers insight into why the team believes it did well.
2. Profile Traffic
Keyhole did an excellent job gathering different types of reporting that Coca-Cola could include in its social media reports in this blog. This example looks at Coca-Cola’s overall profile traffic over a set amount of time (in this case, a year).
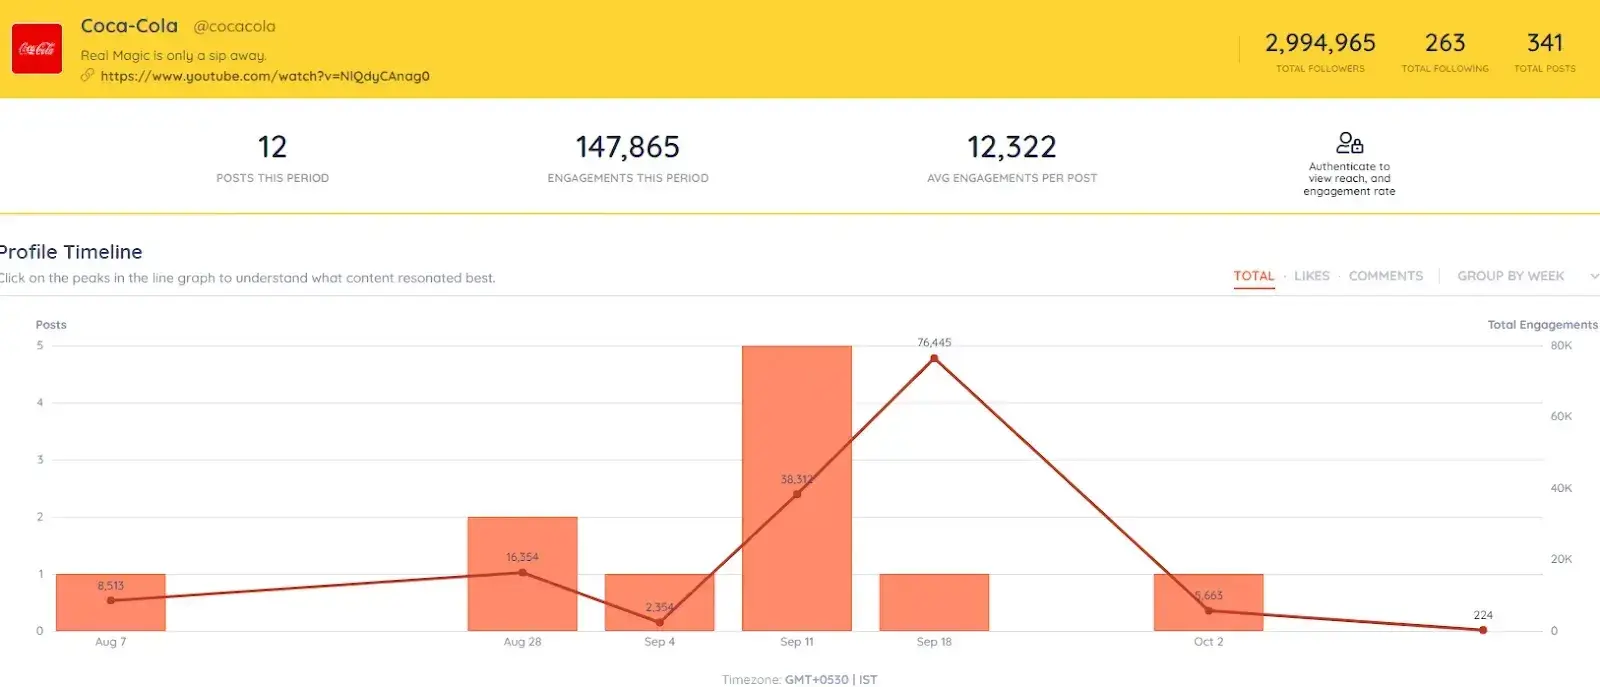
I like this type of reporting because it allows you to evaluate the ebb and flow of audience behavior and if there’s a trend over time.
3. Follower Growth
Next, we see a report of Coca-cola’s follower growth over a specific period of time.

For a brand or team focused on brand awareness seeing a chart like this (especially one that shows continuous improvement) really helps highlight the effectiveness of the work they’re doing on social media.
4. Post Type
This example from Coca-cola analyzes Coke’s different types of content — both how frequently the company shares certain types and then which types perform the best.

Seeing the charts side-by-side allows you to see if your post strategy aligns with the posts that are most popular. The color coding also makes it easier to see which parts of the two charts go together.
5. Social Traffic
Another giant company, Walmart, closely watches its social media traffic. Take this report image from 2023:
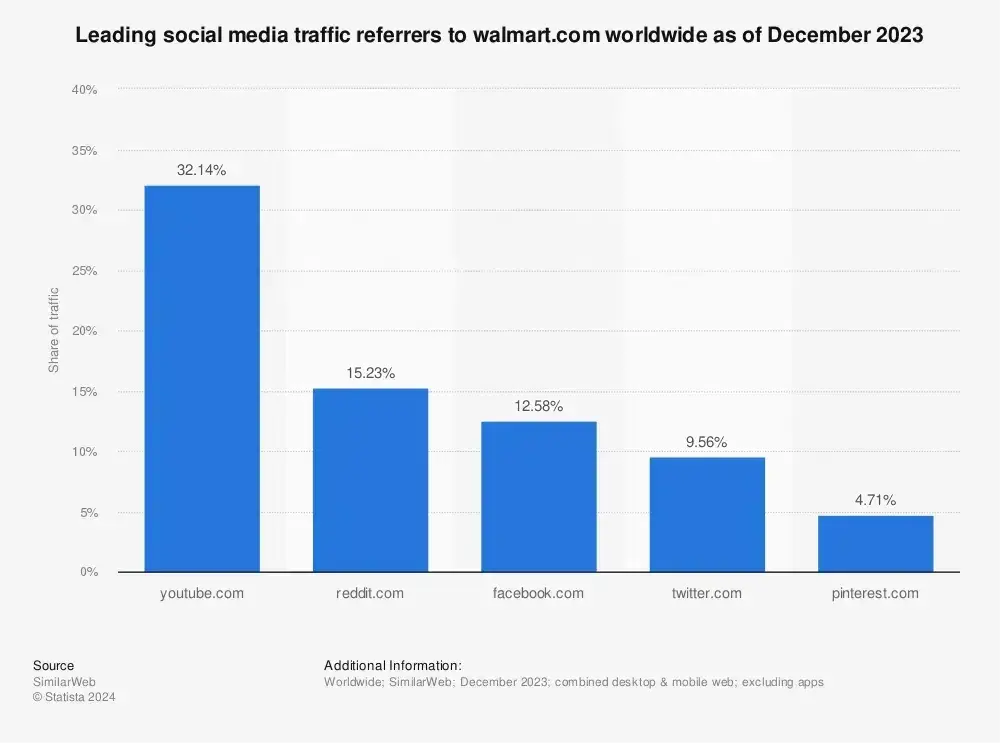
This report looks at different types of social media traffic based on platform. You can clearly see that YouTube is their top social media performer, with Reddit and Facebook only achieving half of YouTube’s engagement.
I like this type of report because it puts into perspective what your share of traffic is for any given platform. If I’m going to invest in paid social media, I will invest in the platform that’s performing the best organically to get more bang for my buck.
You can see how each type of report follows a similar curve, giving you insight into which months you grew the most and which platforms performed the best.
(Social Media) Reporting for Duty in 2025
Social media reports are essential for understanding your performance, aligning your team, and demonstrating the value of your efforts to stakeholders.
By thoughtfully organizing metrics, analyzing trends, and providing actionable insights using the social media templates and guides I shared here, your social media report can serve as a powerful tool to refine your strategy and achieve your goals.
Free Social Media Report Template
Share the results of your social media campaigns clearly and efficiently. Highlight your:
- Mentions.
- Engagement.
- Impressions.
- And more!
Social Media Analytics

![How to measure social media marketing ROI [with expert advice]](https://53.fs1.hubspotusercontent-na1.net/hubfs/53/social-media-roi.png)


![8 Shifts Social Media Marketers Should Make [Insights from 1,000+ Professionals]](https://53.fs1.hubspotusercontent-na1.net/hubfs/53/social%20media%20recommendations%20for%202023.jpg)


![Blog Conversations Don't Lead to More Views or Links [New Data]](https://53.fs1.hubspotusercontent-na1.net/hubfs/53/analytics-1.jpg)