
Excellent customer experience leads to loyal customers, who are likely to sing your praises via word-of-mouth marketing, which 92% of people trust more than advertising. So, what makes a great customer experience?
Read on to learn everything you need to know about customer experience and some tips and tricks you can implement today.
What is customer experience?
Customer experience (CX) is the impression your customers have of your entire brand throughout all aspects of the buyer’s journey. It results in their view of your brand and impacts factors related to your bottom line, including revenue.
There are two main factors to consider when it comes to crafting customer experience: products and people.
Does the product solve problems, meet needs, and generally blow you away? If so, you have a good product that bodes well for customer experience.
The other aspect is people. You could have the best product in the world, but if the people surrounding that product (think customer support, account managers, etc.) don’t inspire customer delight, then you’ve got an issue.
If you’ve got a great product supported by great people, you have the makings of a great customer experience.
.webp)
Free Customer Journey Template
Outline your company's customer journey and experience with these 7 free templates.
- Buyer's Journey Template
- Future State Template
- Day-in-the-Life Template
- And more!
Download Free
All fields are required.
Are customer service and customer experience the same?
Customer service and customer experience are not the same thing. However, they are related. Customer service is a narrower term for helping customers solve problems and better use your products. Meanwhile, customer experience is an umbrella term that encapsulates every interaction a customer has with your brand throughout their customer journey.
In a HubSpot survey, we asked over 1,500 companies about their top challenges when crafting the customer experience. Top responses included:
- Understanding customer needs (22%)
- Adapting to increasingly demanding customer expectations (21%)
- Scaling my customer experience operations as my business grows (21%)
What do these data show? These responses make it clear that aligning with customer needs is the main challenge and key to customer success.
Importance of Customer Experience
A remarkable customer experience is critical to the sustained growth of any business. A positive customer experience promotes loyalty, helps retain customers, and encourages brand advocacy.
Today, customers have the power. Thanks to the internet, customers have the necessary resources to educate themselves when choosing from various product options.
This is why providing a remarkable experience is important.
With so many options, I only want to do business with companies that provide a top-tier customer experience. So, how can you measure your customer experience to determine what you’re doing well and where there’s room for improvement?
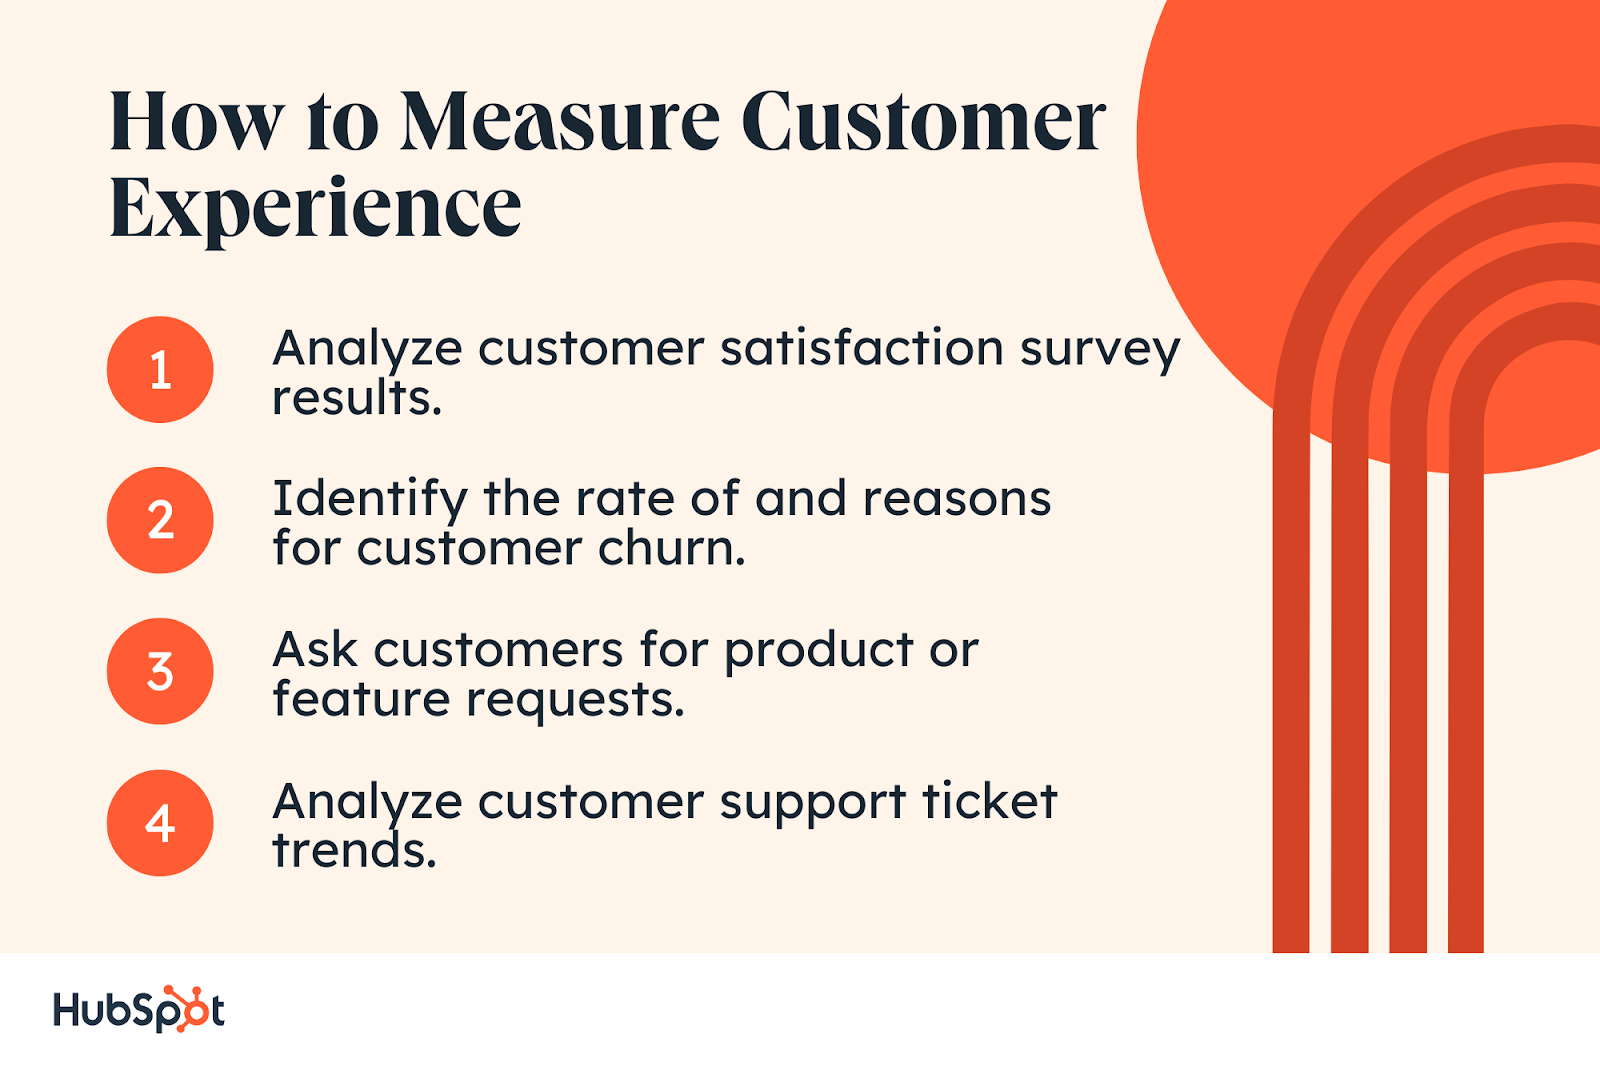
How to Measure Customer Experience
- Analyze customer satisfaction survey results.
- Identify the rate of and reasons for customer churn.
- Ask customers for product or feature requests.
- Analyze customer support ticket trends.
1. Analyze customer satisfaction survey results.
Using customer satisfaction surveys (which you can easily create in HubSpotor one of the integrated tools like Survicate) regularly — and after meaningful moments throughout the customer journey — provides insight into your customer’s experiences with your brand, product, or service.
In our 2024 State of Service Survey, the majority of respondents from companies across the world indicated their intention to increase their investment in collecting and analyzing customer feedback.

Analyzing customer feedback remains one of the most straightforward ways to understand customer needs and craft a great CX. So, it is no surprise that most companies plan to continue investing in the process.
A great way to measure customer experience is by using the Net Promoter Score (NPS). This measures how likely your customers are to promote you to their friends, family, and colleagues based on their experiences with your company.
When measuring NPS, consider data in aggregate across teams. Since multiple teams impact your overall customer experience, you’ll need a clear picture of performance — and that comes from numerous data points.
For example, what is the NPS for in-product usage? For customer service teams across communication channels (phone, email, chat, etc.)? For sales? For attending a marketing webinar? And so on.
Analyzing NPS from multiple touchpoints across the customer journey will tell you what you need to improve and where you’re already providing an excellent experience while showing customers you listen and care about what they have to say.
With your NPS score, dive into your team-by-team performance to ensure you perform well across the board. Also, you may follow up on customer feedback — whether positive or negative — to connect with customers, deepen your relationship with them, and improve your retention and loyalty.
2. Identify the rate of and reasons for customer churn.
20% of companies in our State of Service 2024 survey identified preventing churn and boosting retention as a challenge when creating a great customer experience.
Churn happens — it’s part of doing business. But you must learn from churn to prevent it from happening again.
Ensure you’re doing regular analysis of your churned customers so you can determine whether your churn rate is increasing or decreasing, the reasons for churn, and actions your team may take in the future to prevent a similar situation.
3. Ask customers for product or feature requests.
Creating a great customer experience is all about giving customers what they need. One of the best ways to figure out what their needs are is to ask them!
Create a forum for your customers to request new products or features to make your offerings more valuable and helpful for the problems they’re trying to solve. Whether that forum is shared via email, social media, or a community page, allow customers to offer suggestions proactively.
While you might not implement all the suggestions you receive, it’s worth looking into recurring trends or requests that pop up.
4. Analyze customer support ticket trends.
You should also analyze the customer support tickets your support reps are working to resolve every day. If there are recurring issues among tickets, review possible reasons for those hiccups and how you can provide solutions across the board.
Doing so allows you to decrease the total number of tickets reps receive while providing customers with a streamlined and enjoyable experience.

We asked over 1,500 companies what they felt was their most effective customer service channel, and results pointed to AI chatbots (15%) followed by online chat with a human rep (14%), which I think is telling. Not only is chat-based support quick and easy for customers, but the analysis of the data is much simpler on the company end.
What is customer experience management?
Customer experience management (CXM) is the process of surveying, analyzing, and enhancing customer interactions with your business. CXM monitors customer touch points and evaluates how you can improve the experience related to each.
Free Customer Journey Template
Outline your company's customer journey and experience with these 7 free templates.
- Buyer's Journey Template
- Future State Template
- Day-in-the-Life Template
- And more!
Download Free
All fields are required.
Customer experience management is a fundamental component of a customer-first strategy because it demonstrates a clear investment in customer needs.
By monitoring and enhancing different touch points along the customer journey, your company consistently brings users more value — which is crucial for new and existing customers.
New users want to see results fast, assuring their recent purchase. However, if you don’t add any additional value over time, these customers may lose interest and look for benefits elsewhere. CXM accounts for these customers and provides programs and features that prevent potential churn.
If you’re curious about how this process works, take a look at the next section for tips on creating an excellent customer experience.
How to Make a Great Customer Experience
What makes a great customer experience?
Customer experience is ultimately subjective. Certain customers will value different things regarding their interactions with a brand, but when I encounter a brand that values customer experience, I just know.
I value brands that create a personalized experience. When a brand makes an effort to show they care about me personally, I feel special. Who doesn’t want to feel special? It makes me feel excited to be a customer and want to share my positive experience with others.
For example, I’m a bassist and I have a healthy obsession with effect pedals. Walrus Audio is a company that makes top-tier effect pedals, just like many others. However, the reason I keep coming back to them is attention to detail and personalization. Each pedal comes meticulously packed with stickers and a free tin of picks, but more importantly, I can always expect a phone call from my guy Liam to check up on how I’m getting along with the product. Walrus’ personal touch makes me feel good about being a customer. Isn’t that what we all want?
Here are some common characteristics of great customer experience:
- Personalization. Tailoring services and communication to the needs and history of individual customers.
- Efficiency. Quick and streamlined service. Time is money!
- Consistency. Offering a reliable and consistent product provides a comforting experience that people can trust. Think about how a McDonald's burger is the same anywhere you go.
- Empathy and Understanding. Showing customers genuine concern for their issues and needs. Active listening and understanding the customer's perspective.
- Follow-up. The customer relationship doesn’t end after a purchase or closed ticket. Checking in with customers to ensure and gauge satisfaction is important.
- Clear Communication. Don’t keep customers in the dark. Customers deserve to be kept in the loop, particularly if there are issues.
- Feedback Mechanisms. Providing a way for customers to deliver feedback improves your business and shows that you value customers’ input.
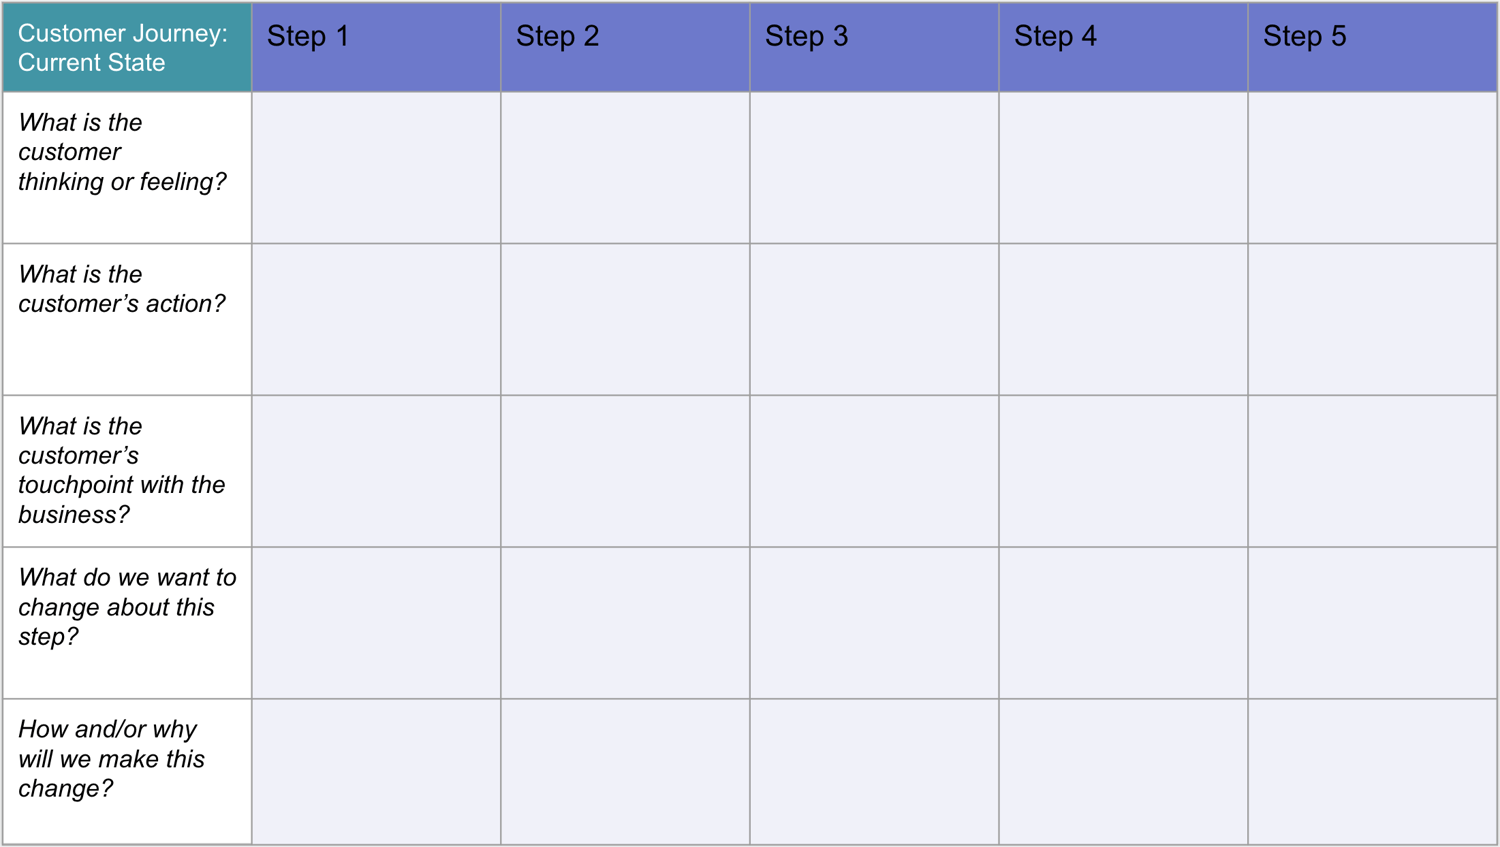
To make a great customer experience, I like to start with a customer journey map. You should also create buyer personas, establish a positive connection with customers, ask for and act on feedback, create helpful content, and build a community.
In my experience, understanding the customer journey is the foundation of creating an excellent customer experience. Consider your customer journey map to understand every touchpoint you have with your customers. From there, focus on making each touchpoint a positive experience for the customer. If I can understand where customers are coming from, it's easier to provide them with a positive experience.
For instance, If I want to return a product, a great customer experience during this touchpoint would be if you included a return shipping label or package for your customer, as Stitch Fix does. Stitch Fix, a clothing subscription company, sends customers clothes they can purchase. If they don’t want them, then they return them.
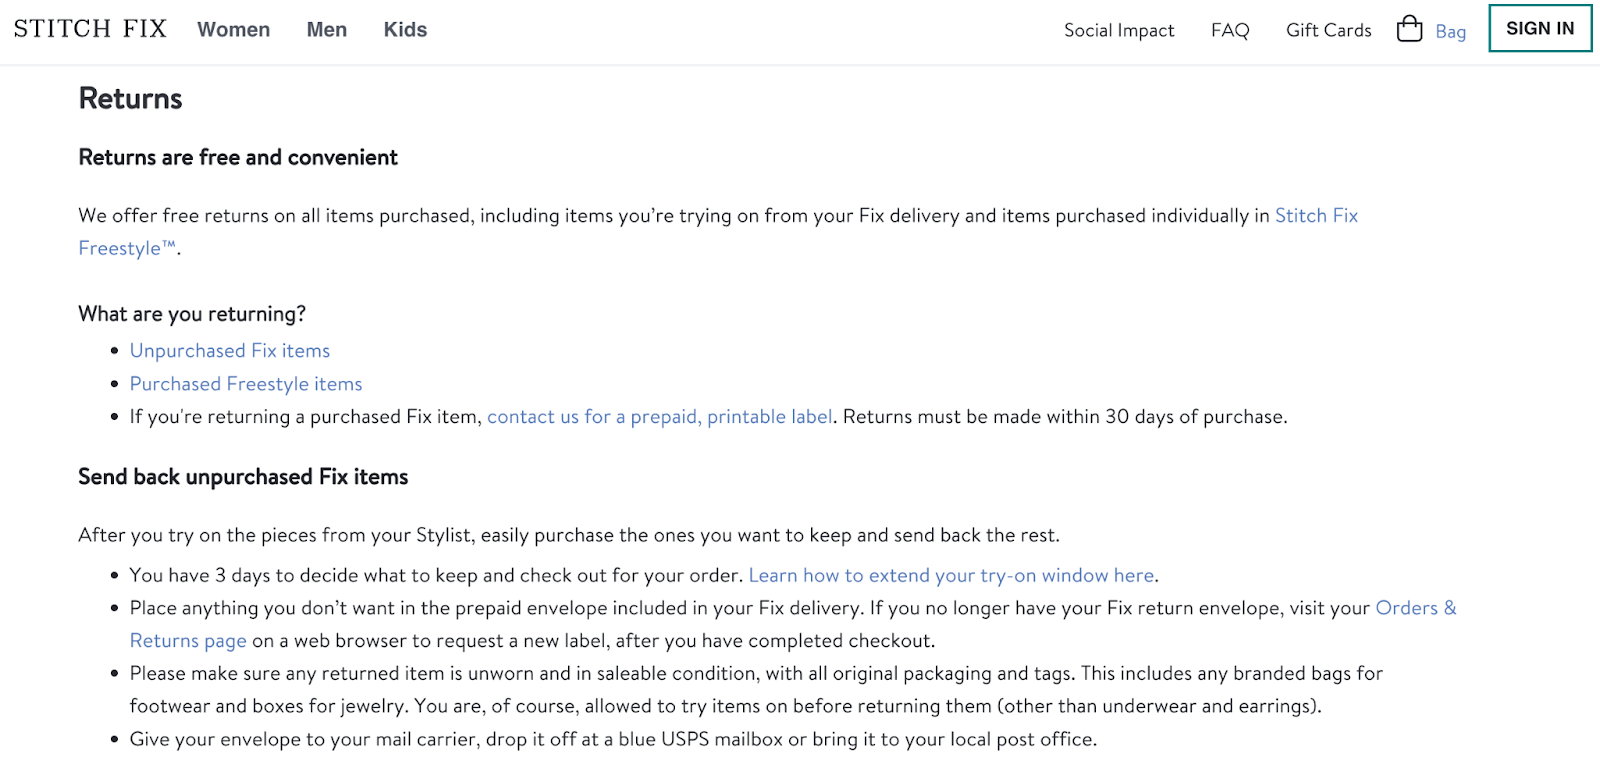
It’s simple: You’re given a return package and label already printed. All you need to do is put the clothes in and drop them off at the post office.
I like Stitch Fix’s return process because it's simple for me to pop unwanted pieces in the box. There is no need to hassle with printing a return label or finding the correct box. Stitch Fix handles all the details, and I like that!
Once you’ve focused on creating positive customer experiences, you must evaluate your success. Ask for feedback and build a community. The more you’re in contact with your audience, the easier it will be for you to create an excellent customer experience. Need templates for creating satisfaction surveys and collecting feedback? Look no further.
Featured Resource: Customer Experience Mapping Template
 Download this template.
Next, let’s look at some examples of poor and remarkable customer experiences.
Poor Customer Experience Example
I’ve had my fair share of bad customer experiences, unfortunately. However, in an age of technology, one stood out to me beyond the rest: trying to delete my Groupon account.
Blake Morgan wrote about Groupon and how difficult it is to delete a basic account — and, as a result, how that creates such a frustrating customer experience. When I make an online account, I expect to manage it easily, including deleting or deactivating it.
Morgan explains that businesses make it complicated to delete an account as a way to inflate user metrics. Higher user numbers look great to stakeholders, but achieving them underhandedly results in poor CX.
Companies that provide consistently good customer experiences try to delight customers at every touchpoint and do not need dishonest tactics. Other signs of poor customer experience include but are not limited to lack of empathy, long hold or waiting time, and inadequate communication channels.
Exemplary Customer Experience Example
Ever heard of Pi Day... March 14th or 3.14? I’m a math geek, so I get giddy about those little things.
A pizza company in Boston, Blaze, used Pi Day as inspiration to run a promo that offered a memorable and positive customer experience — it offered discounted pizza pies (get it?) for only $3.14 on Pi Day.
The promo was sent over email, but it was available in-store without having to pull out your phone or a coupon. The store I went to was packed, but every employee I interacted with greeted me and thanked me for coming in.
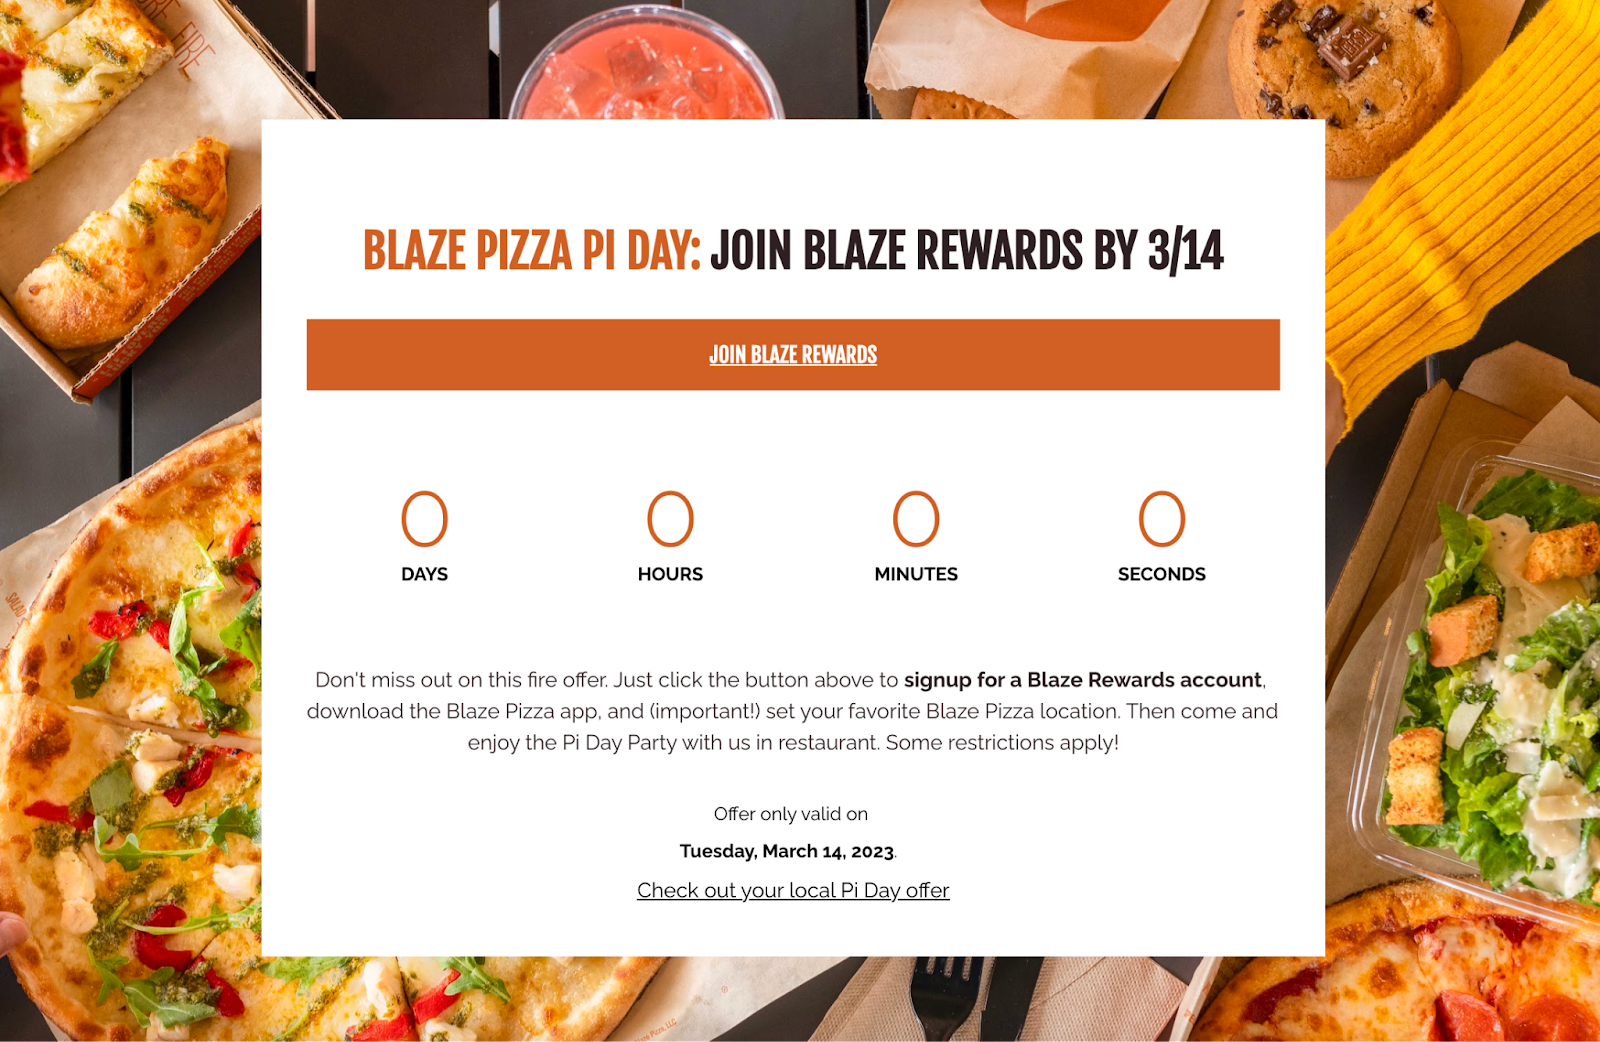
In a city like Boston, where lunch options are plentiful, experiences like these matter. I had a wonderful experience that made me excited to go back in the future. After lunch, I returned to my desk and told my coworkers and friends about the deal — some of whom made their way over to Blaze.
There were a few other things to note about this experience.
First, being part of Blaze’s email list was key. I never receive more than one email a week, and this one was highly relevant, with a day-of offer that I actually cared about.
Second, the ease of the experience left me with a positive impression. I didn’t need to use my phone or print out a coupon code to take advantage of the deal, and despite it being bustling, I was greeted and served kindly and quickly by the team.
Third, I went to Blaze with my girlfriend, who ordered a gluten-free pizza crust. Sometimes, when you have allergies or dietary restrictions, you get a grunt when your request requires workers to change gloves, clean the surface areas, and switch out utensils — but not this time.
Employees stopped for a few moments to swap out their gloves, wipe down the area, retrieve the gluten-free crust, and prepare it for use. They created a level of trust through their accommodations and transparency.
And for what it’s worth, the pizza was delicious — and sometimes, customer experience is as simple as that. I ate the entire pi (ha!) in one sitting for less than half the usual price.
Free Customer Journey Template
Outline your company's customer journey and experience with these 7 free templates.
- Buyer's Journey Template
- Future State Template
- Day-in-the-Life Template
- And more!
Download Free
All fields are required.
While these examples give us a good idea for creating a positive customer experience, they’re focused on more traditional, brick-and-mortar businesses. If you’re running a SaaS company, you’ll need to consider a few additional factors during your analysis.
Let’s review those components in the section below.
Online Customer Experience Management
Online or digital customer experience management refers to the experience your business creates online or through a mobile app.
As more businesses take their companies online, building relationships through digital channels is becoming increasingly important. Companies that don’t have brick-and-mortar locations need to rethink touch points in their customer journeys to build brand loyalty.
If you’re a SaaS company or launching a website or app, here are a few details to remember when considering the customer experience.
Mobile Experience
We asked 701 consumers which device they most often used when searching online. Results are as follows, organized by age.

The data show that people overwhelmingly use their smartphones to search, so a mobile-optimized website should be a top priority.
If you’re online, you’re accessible via a smart device, which means customers can find your company anywhere there’s cellular or Wi-fi service. The experience these customers have should be nearly identical to those using standard desktop devices.
This means your website should have a comprehensive, well-working app. If it doesn’t, your site should be responsive and user-friendly cross-device. There’s nothing more disappointing than a company with a fantastic desktop website, but it’s cut off and unresponsive on mobile.
Additionally, your app or mobile site should be as effective as your desktop version. You should be able to accomplish the same amount of tasks using either a mobile or a traditional device.
Don’t sacrifice features for your team’s convenience. Instead, put in the extra effort and resources — customers will genuinely value an omnichannel experience.
Usability
It doesn’t matter how effective your product or service is if your customers can’t navigate their way around it. Websites and apps should be intuitive, making it clear to the user which steps to take to achieve their goals.
Your team can create a user-friendly design by running usability tests on your website or app. Usability testing evaluates how easy it is to operate your product or service. By running these tests before production, you can create a website design that’s easy to use and ensures every customer can achieve their goals.
User Onboarding
For some companies, customers need to be taught how to use their website or app. Not everyone is tech-savvy, and many SaaS businesses provide onboarding to users who aren’t familiar with their products or services.
Onboarding is the process of teaching new customers how to use your product or service. A representative from the company’s customer success team works with the user to ensure they understand the value and purpose of their purchase. This way, customers don’t have to go through a time-consuming learning curve and can get value from your business immediately.
Whether or not you’re a SaaS company, it can be difficult to improve upon your customer experience. That’s because you must make changes across multiple departments and ensure every employee is on the same page. This is where software can simplify the process for your team.
There are plenty of tools available that can monitor and analyze customer experience. Let’s review a few options.
Tips for Making a Great Customer Experience
1. Understand your customers. I’ve found no substitute for putting yourself in the customer's shoes. To create a great customer experience, you need to experience what it's like to be a customer. That can mean many different things depending on your company, but when I worked at HubSpot Support, it meant knowing the product inside and out and using it myself.I used my HubSpot portal to host my blog and as a CRM when booking shows for my band. Using the product myself gave me a unique insight into the customer perspective that I don’t think is possible to understand otherwise. In doing so, I could foster great customer experiences through a shared understanding of customer needs and goals.
2. Optimize your website. There’s nothing quite as disappointing as a slow or poorly designed website. Ensure your website is aesthetically pleasing, fast, and designed with the customer in mind.You want to make it as seamless as possible for customers to access their accounts and locate relevant information. When you execute your website correctly, no one will notice. But that’s what you want. When the UX is optimized, everything will be where the customer expects it, which makes for an effortless customer experience.
3. Listen and engage via social media. Social media is often where customers go to voice concerns, delights, and desires regarding their products and services. You’ll miss valuable insights that can improve your customer experience if you don't listen. When I worked in HubSpot Support, we used social listening software to monitor HubSpot mentions and offer customer support across social channels.In my experience, monitoring and engaging with customers via social media is crucial to understanding their needs, which is the cornerstone of customer experience.
When creating content for social media, it's essential to ensure that it is both high quality and authentic. Customers know when they are being sold something, and they can tell if your brand truly cares about solving their problems and meeting their needs. Check out the chart below to see how different age groups prioritize quality versus authenticity in content.

As a customer service representative, I found that customers appreciated it when I identified their needs/challenges and suggested new features to optimize their workflow. So, if you notice a way to help customers as they grow and their needs change, let them know.
5. Clear communication. The ability to communicate technical details in a way that anyone can understand is a cornerstone skill for customer success. As a technical support representative at HubSpot, I worked with many customers, from the savviest IT professionals to the least technically concerned mom-and-pop small business owners.What do these groups of people have in common? They just want everything to work.
The key is understanding your customers and communicating clearly on a level they expect and understand. Clear communication doesn’t just mean simplifying your explanation as much as possible (although sometimes it does). Instead, you must have a comprehensive enough grasp of your products and services to level with anyone.
6. Honest communication. You know what they say – honesty is the best policy. Being honest and authentic with your customers is a recipe for customer success.No one wants to feel like they are being given the runaround. Let’s say your product is experiencing a service disruption, or maybe a shipment got lost in the mail. These things happen. Be upfront instead of burying your head in the sand and ignoring customer complaints.
Let your customers know exactly what has gone wrong and the steps you are taking to address it. Sure, issues like these are frustrating for everyone. Still, customers will feel valued and respected if you can level with them honestly, which is necessary for long-term customer success.
7. Respond promptly. In my experience, responding to customers as quickly as possible bolsters customer success. It makes customers feel like their time is valued and their concerns are being addressed seriously.However, if you’ve worked in customer support like me, you know you can’t solve every issue at the drop of a hat. That doesn’t mean you can’t respond quickly, though.
My strategy was to respond to customer email tickets as quickly as possible, and even if I needed extra time to solve an issue, I would send out an email along the lines of:
“Hi [Customer Name],
I wanted to let you know that I’ve received your support request, and I’m looking into it. I see you are encountering an issue with [describe customer issue].
I will dive into this on my end, which will require a little time. However, you can rest assured I’m actively working on this and will update you within [describe anticipated time frame].”
See what I did there? I could have just placed this customer inquiry on the back burner and waited to respond until I had approached a resolution. However, I’ve found that giving a timely initial response and setting expectations go a long way in creating a positive customer experience.
8. Leverage AI. We asked over 1500 companies how their investment strategies would change in 2024, and responses overwhelmingly pointed towards incorporating AI into the customer experience.71% said they would increase their investment in AI chatbots for customer service, 70% said they would increase their investment in generative AI for crafting customer communications, and 72% planned to increase investment in AI/automation throughout the customer experience.
So, I think the data are rather clear. AI tools allow for streamlining multiple business processes, and the customer experience benefits significantly from the increased efficiency.
9. Let customers help themselves. Hands-on support will always be a cornerstone of customer success. However, younger generations are moving towards a preference for self-service. See the data below from our survey of 701 consumers.
As shown above, most Gen Z consumers prefer self-service, and if you ask me, that number will only grow over time. Consider investing in a thorough knowledge base and other self-service tools to empower your customers to help themselves.
We also asked over 1500 firms whether they would prioritize offering service reps better tools to solve issues for customers or offering customers better tools to solve issues independently. The response? 68% indicated they would be prioritizing self-service tools.
10. Offer value. Offering a valuable product should go without saying. We all want the most possible benefit out of a product for the least possible cost. However, I’m not saying you should offer a cheap product.Instead, focus on creating something that genuinely benefits people's lives and is worth their hard-earned money. Especially today, as the cost of goods rises and purse strings tighten. Check out the data from our research below.

Every age group feels the effects of today’s economy. Now more than ever, offering value to your customers will be a top factor in determining customer satisfaction and success.
Customer Experience Management Tools
1. HubSpot Service Software
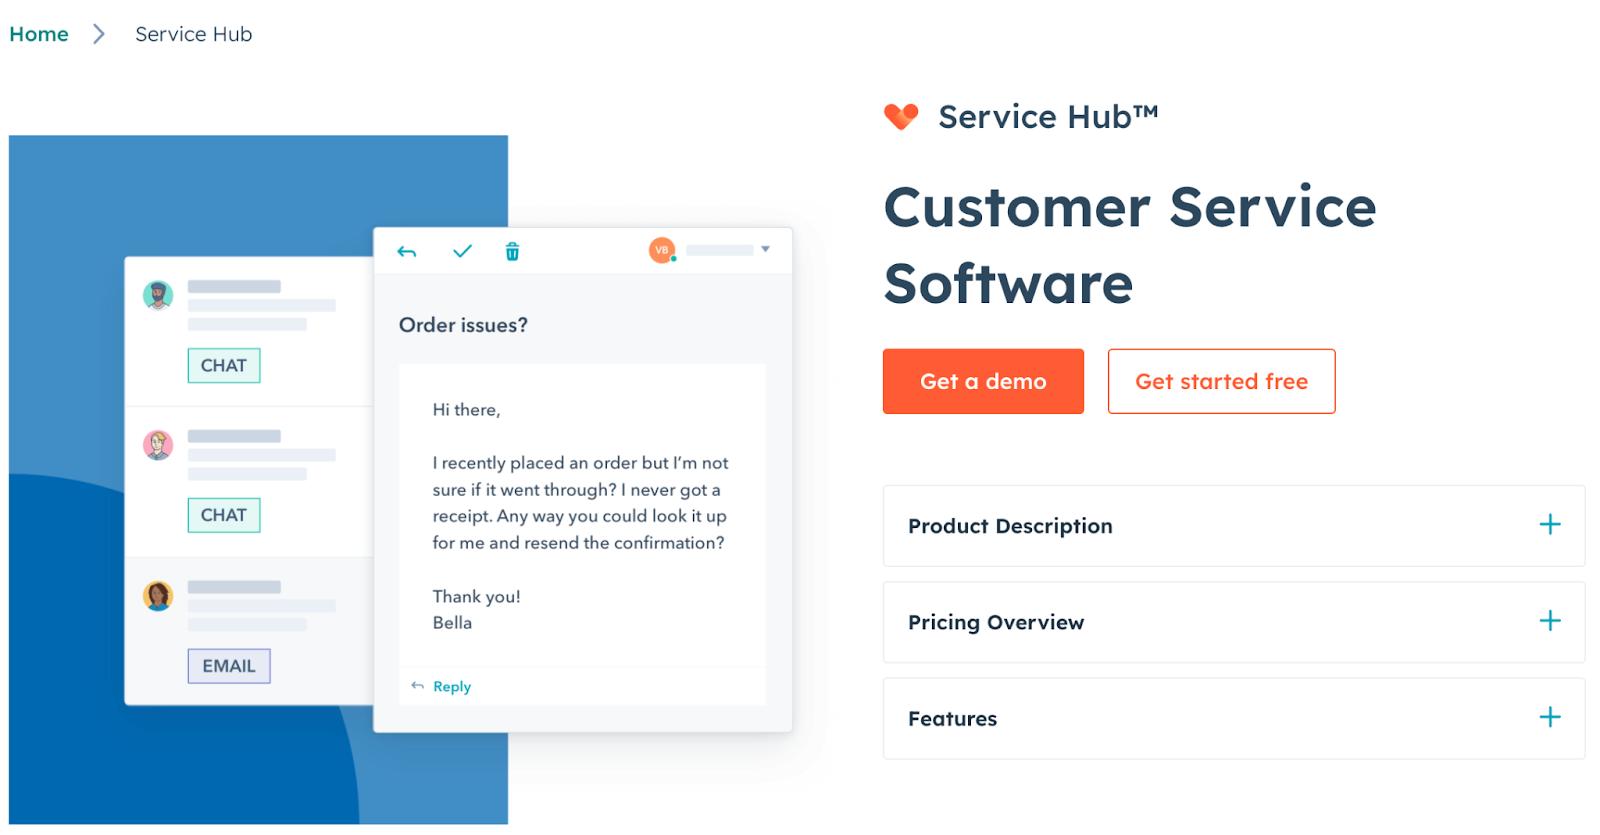
HubSpot’s Service Software is a customer service platform that includes various features used for customer experience management. For example, the tool offers ticketing and help desk automation to help record customer inquiries, track recurring support cases, and more.
It also has customer feedback capabilities to determine NPS® for customer interactions. These features make it easy for your team to identify common customer roadblocks and roll out changes that help users overcome them.
Price: Free plans are available. Starter plans cost $45 monthly. Professional plans cost $450 monthly. Enterprise plans cost $1,200 monthly.
What I Like: I like that HubSpot is continually integrating and iterating on AI features in the product to help you streamline and scale your service efforts.
2. Infobip
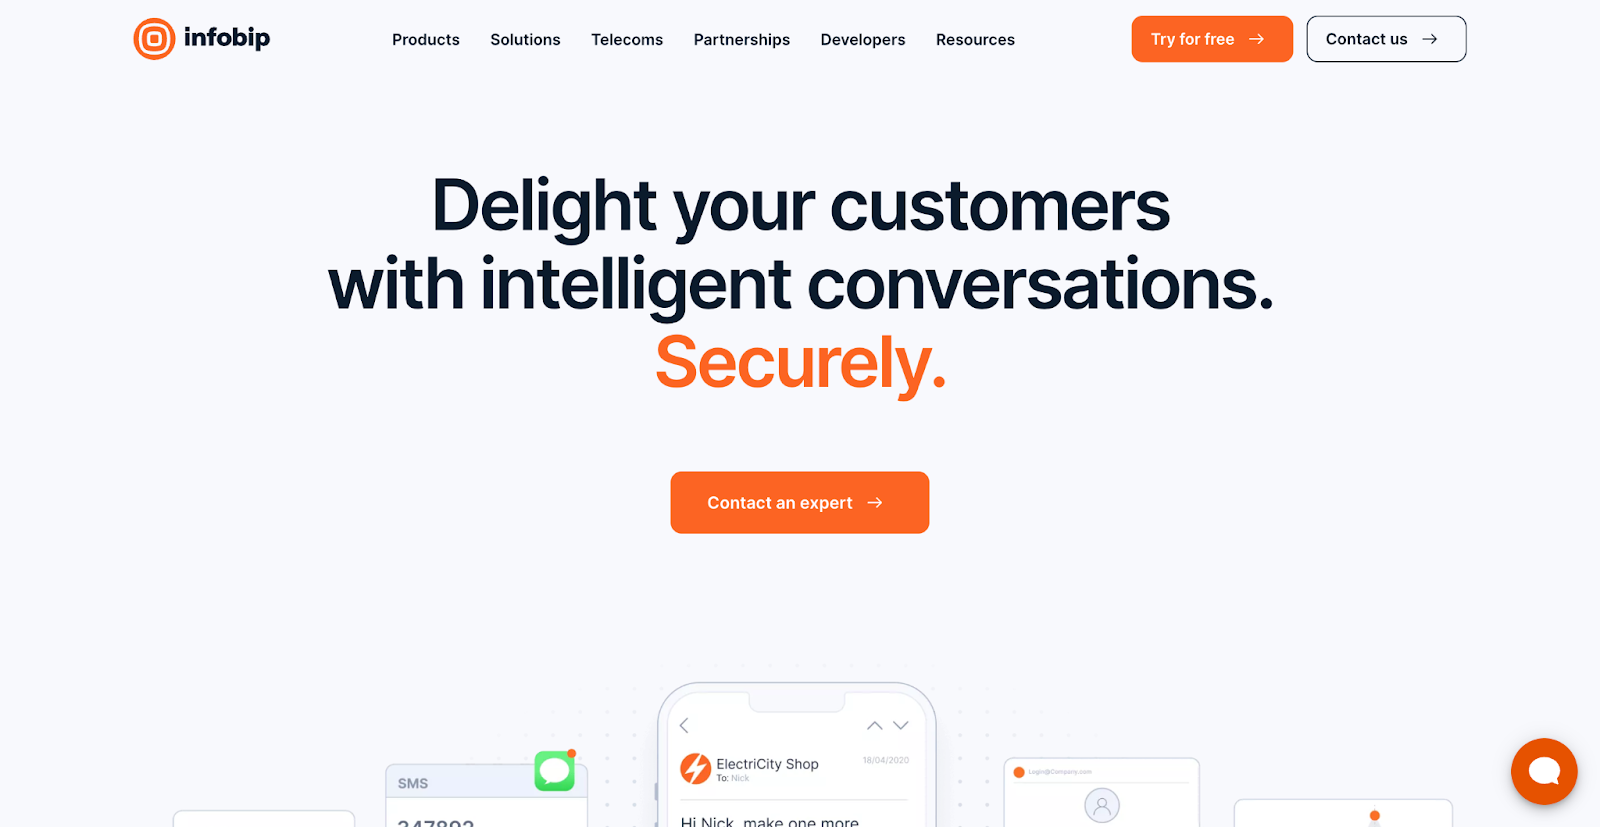
Infobip is an omnichannel communications platform that enables businesses to build personalized customer experiences on any channel, including WhatsApp, Facebook Messenger, Live Chat, SMS, and more.
With a customer engagement solution, chatbot building platform, and cloud contact center, the Infobip platform makes it easy to engage, notify, and support customers at each stage of their journey.
Price: Pricing is available upon request.
What I Like: I like Infobip’s WhatsApp chatbot, which is especially useful for companies that do a lot of business outside the U.S.
3. Tealeaf
Tealeaf is an analytics engine that monitors and evaluates online customer engagement and website interactions. It uses AI to identify recurring problems and provides insights into how you can correct them in the future. It offers timely updates to help your team fix bugs and glitches before they become a widespread issue.
Features like real-time data processing, intelligent data management, and seamless integration with other tools in your tech stack make Tealeaf a great CX tool for companies.
Price: Pricing is available upon request.
What I Like: I like that Tealeaf lets you capture and replay customer interactions in real time, so you can gain insights into customer behavior when it matters most.
4. Whatfix

Whatfix is a digital adoption platform (DAP) that helps organizations improve customer experience by simplifying how users interact with complex digital products. It enables product teams, CX leaders, and support managers to create in-app guidance, like interactive walkthroughs, Smart Tips, and self-help widgets, that guide users in real time, reduce friction, and proactively resolve customer pain points.
Whatfix is especially valuable for onboarding, support deflection, and product education. By providing contextual help exactly where and when it’s needed, brands can shorten time-to-value, reduce ticket volume, and improve overall customer satisfaction, without disrupting the user journey.
Price: Pricing is available upon request.
What I Like: I like Whatfix's user-friendly nature. They have a ton of service solutions that feel personalised and solve a specific customer need. Their no-code creation and in-app guidance make it simple to get started.
5. Nice

Nice Feeback Management provides you with a summary of your overall customer experience. It does this by comparing direct feedback, indirect feedback, and KPIs — all in one report. This gives you a complete picture of the customer experience from the customer’s perspective and how it relates to business impact.
Price: Pricing is available upon request.
What I Like: Nice allows you to create automated triggers based on customer feedback to get ahead of potential churn.
6. WalkMe
WalkMe is a customer experience management solution for businesses primarily interacting with customers online.
It has self-service features that empower users to find their solutions, saving your support team time. It also has an extensive onboarding program, so your team can quickly get up to speed on the software.
With WalkMe, you get to build a satisfying relationship with customers from when they first become aware of your brand till they become brand advocates.
Price: Pricing is available on request.
What I Like: I like WalkMe’s DeepUI feature, an AI-powered element recognition feature that ensures it can continually adapt to UI changes in other apps it integrates with.
7. Khoros
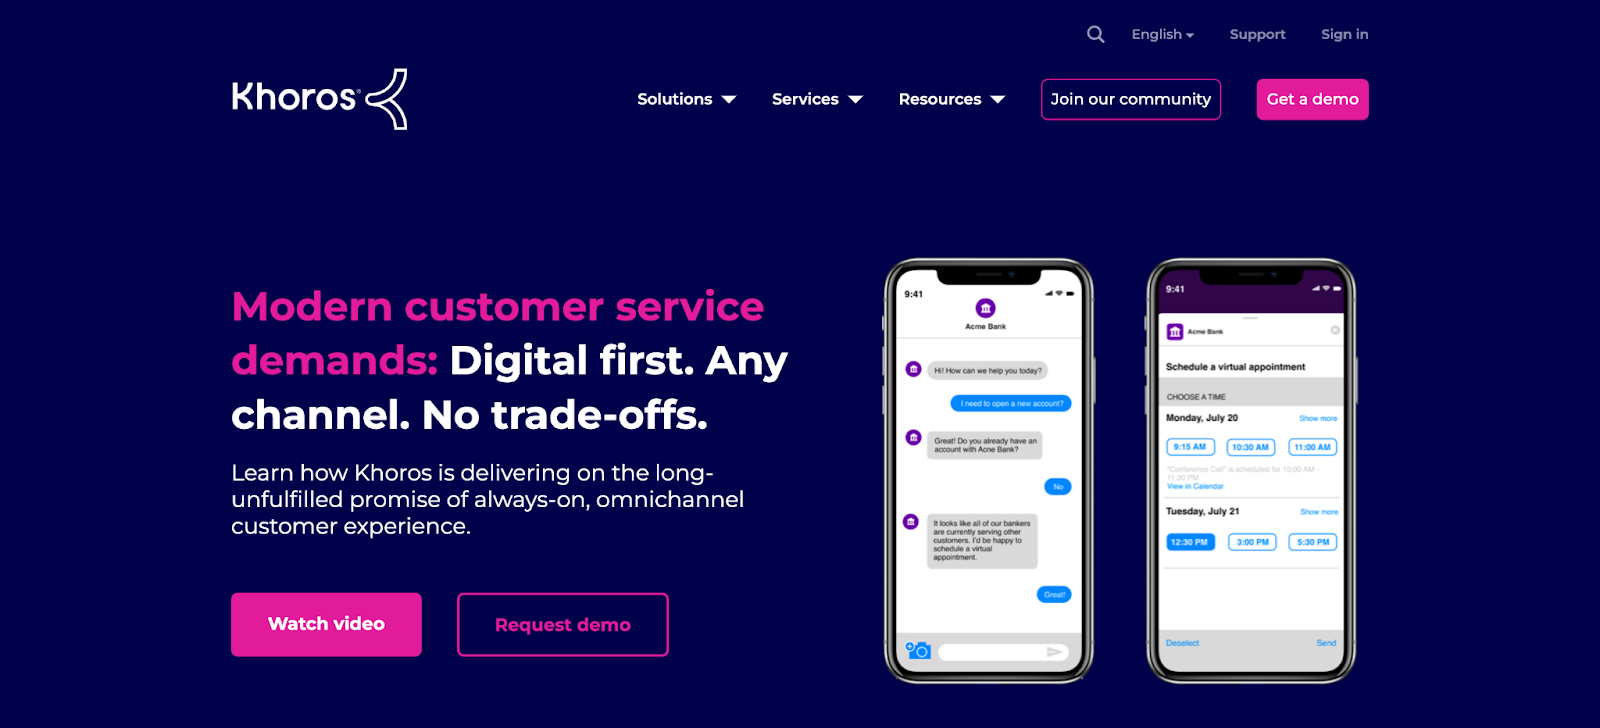
Khoros is a customer experience management tool that helps businesses monitor their social media engagement. It has omnichannel features that allow you to communicate with customers wherever they’re most comfortable.
Free Customer Journey Template
Outline your company's customer journey and experience with these 7 free templates.
- Buyer's Journey Template
- Future State Template
- Day-in-the-Life Template
- And more!
Download Free
All fields are required.
Khoros has workflow and personalization tools that save your team time without sacrificing the quality of your customer service.
Price: Pricing is available on request.
What I Like: Khoros’s no-code bot-builder tool lets you create sophisticated AI chatbots using a drag-and-drop interface.
8. Podium
If you want a simple, straightforward solution, Podium is a great option for SMBs looking to enhance customer experience.
It has features like live chat, text campaigns, and payment — all of which let you nurture new visitors to your site, communicate faster, and increase revenue. It also has feedback options to survey customers using NPS.
Price: The essentials plan costs $249 monthly. Standard plans cost $409 a month per user. Professional plans cost $599 monthly.
What I Like: I like Podium’s AI-employee feature that automatically responds to customers and schedules meetings. I also like that they named it Jerry.
9. Birdeye

Birdeye is a reputation management software, which means it specializes in managing online reviews across many channels. Online reviews are often the first place potential customers look in the consideration stage, and Birdeye helps you get more positive reviews quickly.
It features tools that automatically trigger customer review requests, auto-reply to customers, and share reviews on your website.
Price: Pricing is available upon request.
What I Like: I like that Birdeye solves a specific customer need. Not every business is based on customer reviews, but for those who are, Birdeye is super valuable.
Create a Remarkable Customer Experience
Identifying key touch points along your customer journey, collecting customer feedback to improve or keep iterating on those experiences, and analyzing trends will help you improve customer sentiment about your company — and keep them telling their friends and family about your organization.
Net Promoter, Net Promoter System, Net Promoter Score, NPS, and the NPS-related emoticons are registered trademarks of Bain & Company, Inc., Fred Reichheld, and Satmetrix Systems, Inc.
Editor's note: This post was originally published in May 2021 and has been updated for comprehensiveness.


![How to conduct survey analysis like a data pro [all my tips + secrets]](https://53.fs1.hubspotusercontent-na1.net/hubfs/53/survey-results-1-20241031-6355381.webp)
![Customer Profiling in 10 Easy Steps [+ Templates]](https://53.fs1.hubspotusercontent-na1.net/hubfs/53/customer-profiling_2.webp)


![What is a customer journey map? The complete overview [examples + templates]](https://53.fs1.hubspotusercontent-na1.net/hubfs/53/%5BUse-Oct-08-2025-10-53-10-8746-PM.webp)

![Is The Customer Always Right? [What It Means + Why It Matters]](https://53.fs1.hubspotusercontent-na1.net/hubfs/53/customer-is-always-right-origin-1-20250202-6448090.webp)