

I get it. That’s why I put together this overview of top marketing trends for 2025. I’ll share some of my favorite highlights from HubSpot’s recent survey of more than 1,700 B2B and B2C marketers, which explores the key trends, tools, and challenges that today’s marketing professionals are focusing on the most.
Plus, I’ll share insights and advice from leaders at OpenAI, Asana, Adobe, Bitly, and more.
Table of Contents
- Top Digital Marketing Trends in 2025
- Digital Marketing Trend FAQs
- What's Next: Your Marketing Action Plan
TL;DR
Digital marketing trends in 2025 include AI-driven automation, voice search optimization, immersive AR/VR experiences, social media, and hyper-personalization at scale. Marketers should prioritize AI tools for content creation and analytics, optimize for voice and visual search, and invest in video and social commerce strategies. Data privacy and ROI measurement also remain critical.
To stay ahead, focus on quick wins like voice search optimization, leverage marketing automation, and use unified platforms like HubSpot’s Marketing Hub for seamless execution.
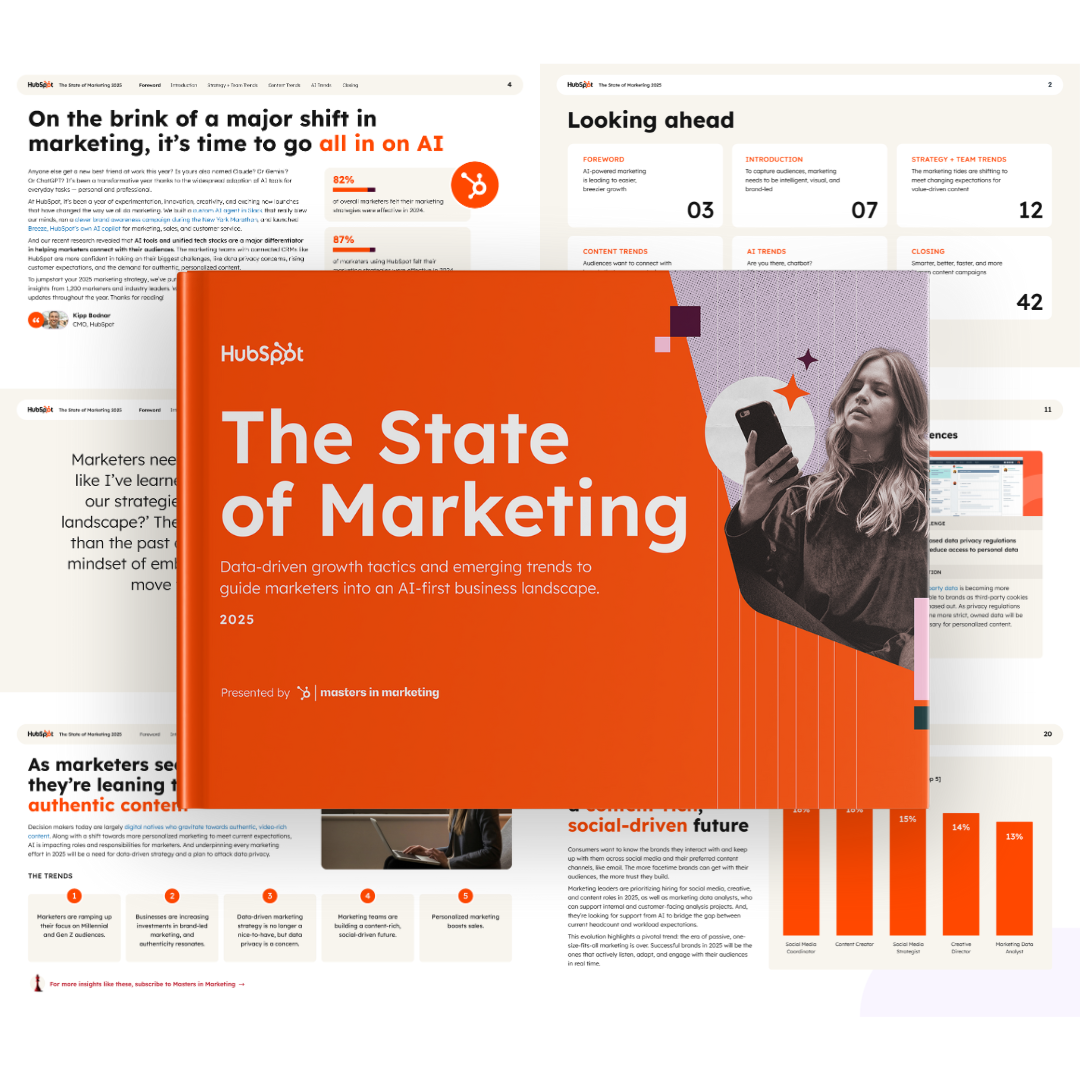
The State of Marketing in 2025
HubSpot's Annual Inbound Marketing Trends Report
- Top Marketing Channels
- AI in Marketing
- Managing Privacy
- The Future of Marketing
Download Free
All fields are required.
Top Digital Marketing Trends in 2025
1. AI helps marketers keep up with increasing content needs.
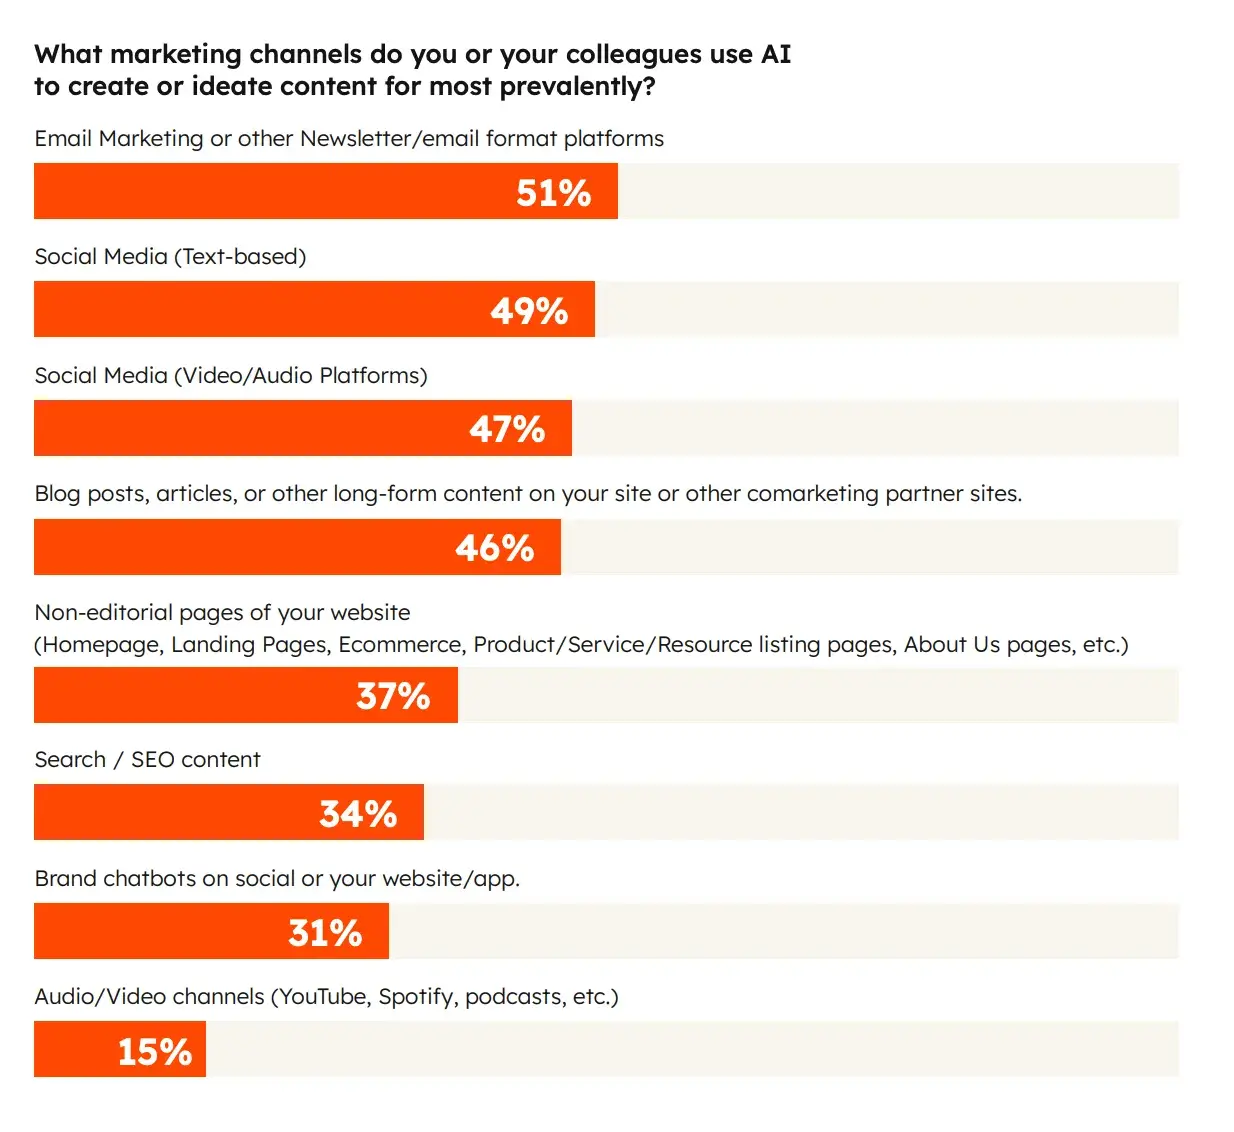
In 2024, AI usage among marketers rose at a staggering rate. And while there are countless AI tools available to help with a wide variety of marketing needs, today’s marketers reported they have been particularly focused on using AI tools to create content to keep up with their increasing content needs.
Interestingly, different marketers use AI to create content in different ways. While some report using AI to develop entire drafts from scratch, one of the most common AI use cases was to repurpose content from one format to another.
For example, I’ve found that marketers may use AI tools to turn a blog post into a video script, or a video clip into a social media post. AI has enabled many marketing teams to increase their content output without having to hire more people.
Diving a little deeper, here are the top AI use cases identified by our survey respondents:
- Content creation (using generative AI to write copy, create images, get ideas, etc.) (43%)
- Research (using generative AI research audiences, find datasets, summarize articles, etc.) (34%)
- Brainstorming (using generative AI to brainstorm content ideas) (27%)
- Learning how to do things (using generative AI to learn an Excel function, debug SQL code, etc.) (40%)
- Data analysis/reporting (using generative AI to analyze or manipulate marketing data) (35%)
- Take notes or summarize meetings (27%)
When it comes to the types of content that marketers have been using generative AI to produce, we’ve found that social media posts, emails, blog posts, topic ideas, images, and product descriptions are the most common.
In addition, many marketers use tools like HubSpot’s Content Marketing Software to turn existing blog posts into social posts, newsletter content, audio files, and other content forms in just a few minutes.
Curious about using AI for content creation? HubSpot’s Free AI Content Creator is a great place to start.
It’s also important to clarify that while many of our respondents were focused on using AI to generate content, AI is poised to grow beyond content generation into a range of related domains.

As OpenAI’s Head of Strategic Marketing Dane Vahey notes, “Marketers have been scratching the surface of AI, but so far, it’s been mostly for content generation."
"In 2025, we expect to see marketers make the leap to using AI for creative ideation, data-driven decision-making, workflow automation, and strategic brainstorming.”
2. Many marketers struggle to integrate AI into their workflows.
Despite the growing popularity of AI content generation tools, our survey revealed that many marketers continue to struggle with learning to use these tools effectively and integrating them into their workflows.
Specifically, just 47% strongly or somewhat agreed that they had a clear understanding of how to use AI in their marketing strategy, and 48% strongly or somewhat agreed that they had a clear understanding of how to measure the impact of AI in their marketing strategy.
As Briana Rogers, VP of Marketing at Miro, explained, “The space is moving so quickly and we need to experiment with everything… from the more well-established use cases — like leveraging machine learning to improve ad buying, or creating predictive customer value models — to newer spaces, like identifying patterns in user research and data, assisting in creative development, and building full customer campaigns that are powered by AI.”
Moreover, even among marketers who understand the basics of AI implementation, integrating these tools in an ethical manner can also pose a significant challenge.
Dr. Rebecca Hinds, Head of Asana’s Work Innovation Lab, warns, “Gen Z is sounding the alarm: They’re more concerned than any other demographic about whether their organizations can trust generative AI vendors to uphold responsible AI practices.”
She goes on, “Vendors must lead with transparency, clear AI principles, and a commitment to ethical innovation to gain the support of Gen Z in 2025” — and doing so can be quite difficult for many marketers.
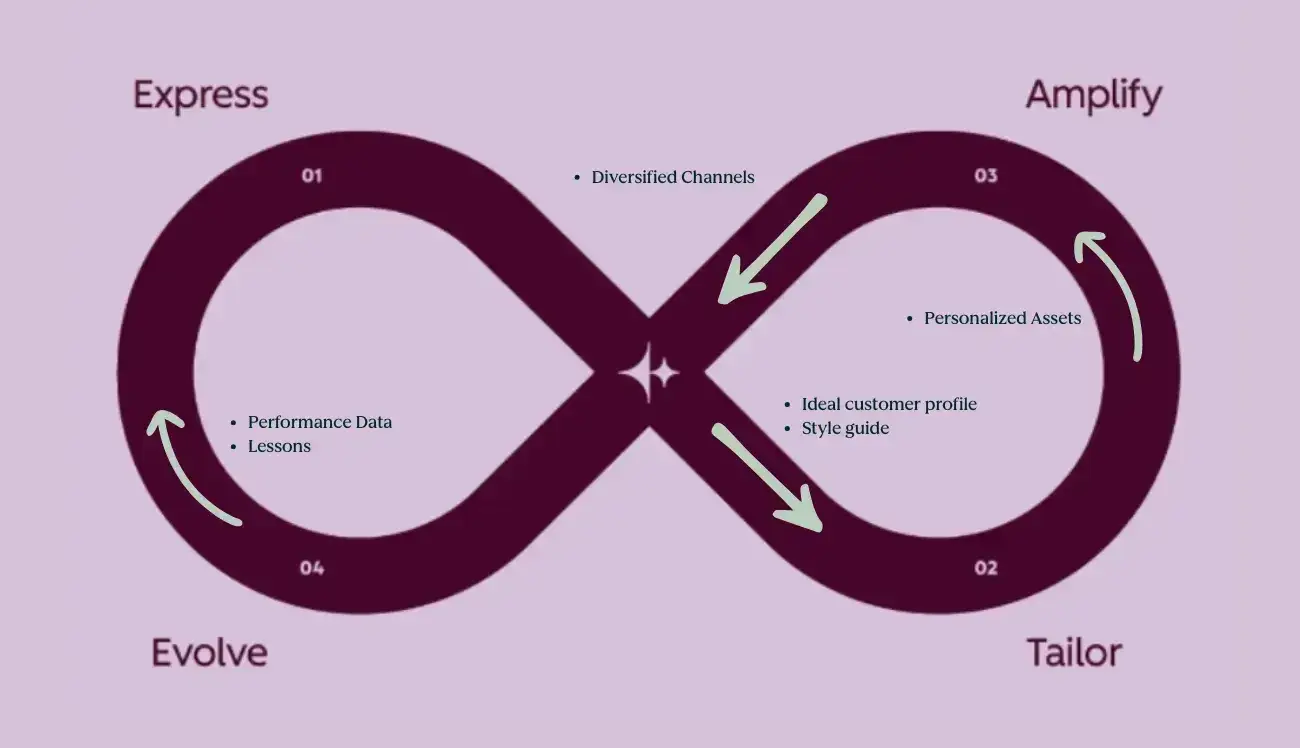
Our team at HubSpot is outlining how marketers like you can successfully integrate AI into your workflows using Loop Marketing. Learn more about it here.
3. AI is making a major impact — but it shouldn’t replace humans.
While many content marketers (me included) have voiced concerns about the potential for AI tools to replace human content creators, our recent data suggests that this is unlikely to happen.
Past HubSpot survey data show that the vast majority of marketers still edit content generated by AI, suggesting that AI tools are acting more like assistants than fully fledged, human content developers.
Plus, neither customers nor search engines are likely to reward an excessive reliance on AI-generated content.
For example, a recent post by HubSpot’s Curtis del Principe highlighted the punishment handed to one agency after farming thousands of posts with AI, in what has been called an “SEO Heist.”
Other research has highlighted the risk of plagiarism when using AI-generated content, and Google’s Gemini (formerly Bard) actually allows you to double-check its output by providing links to sources that confirm the information it provides.

Kendra Lee, President of the KLA Group, argues, "AI isn’t replacing your sales and marketing team — it’s amplifying them. When you build a revenue generation engine that uses AI to analyze behavior and automate routine touchpoints, your team can focus more on what really moves deals forward: building trust, understanding needs, and showing value in ways that make prospects want to work with you.”
In other words, AI is definitely making a major impact on the world of content generation — but I don’t think it’s likely to fully replace human marketers.
The State of Marketing in 2025
HubSpot's Annual Inbound Marketing Trends Report
- Top Marketing Channels
- AI in Marketing
- Managing Privacy
- The Future of Marketing
Download Free
All fields are required.
4. Social media is the highest ROI marketing channel.
In 2025, the top positions marketers report their organizations are hiring for are content-related, with a specific emphasis on social content.
Notably, this trend spans across organizational hierarchies, with an increased focus on social media for everyone from the individual contributors responsible for creating posts to managers and directors responsible for content strategy.

When we asked marketers to select the top three marketing roles that they expected to be the top priority to recruit in 2025, they listed the following positions:
- Content Creator (16%)
- Social Media Coordinator (16%)
- Social Media Strategist (15%)
- Creative Director (14%)
- Data Analyst (13%)
Clearly, social media is a top channel for today’s marketers. But what is driving this focus?
Our Consumer Trends Survey found that social media is actually the preferred product discovery channel for Gen Z and Millennials, with Gen X and Boomers also quickly warming up to it. In fact, 64% of Gen Z, 59% of Millennials, and 47% of Gen X respondents reported having discovered a product on social media in the past three months.
This survey also found that 17% of social media users reported having bought a product in-app in the past three months, one in four bought something based on an influencer’s recommendation, and 19% sent a DM (Direct Message) for customer service.
On platforms such as Instagram, TikTok, and Facebook, marketers can set up virtual stores for users to purchase without ever leaving the app. From brand discovery to influencer recommendations to in-app purchases and customer service via DMs, social media can become a one-stop shop for the entire customer journey.
As such, it’s no surprise that marketers are quickly embracing social selling. Our most recent social selling survey found that 87% of marketers say this approach is effective, and 59% report driving more social sales than in past years.
5. Facebook still proves to be a powerful platform for marketers.
So, social media is clearly the place to be. But what platforms are actually delivering the most value for marketers?
Despite what you may have heard about Facebook being “dead,” it’s still the most popular platform for marketers, with 58% of survey respondents reporting that they leverage the platform as part of their marketing strategy.
Marketers also report that Facebook has had the highest ROI of any social media platform over the past year, with 40% of respondents indicating that the platform is among the top three drivers of ROI.
As a result, I wasn’t surprised to see that more than two out of three marketers plan to maintain the same level of investment or increase their investment into their Facebook marketing efforts in 2025.
6. The Threads vs X showdown continues.
While Facebook remains a leader in the realm of social media marketing, the showdown between its Threads platform and X (formerly Twitter) remains ongoing.
Our latest survey data shows that 68% of marketers plan to continue or expand their investment into X in 2025, while 59% plan to continue or expand their investment into Threads. In addition, 8% of marketers plan to try Threads for the first time in 2025, and just 18% of marketers list X as among the top-three ROI-driving social media platforms.
To learn more about X versus Threads — and how you can leverage these competing platforms in your own marketing strategy — take a look at some of these deep dives:
- X vs. Threads: What Marketers Need to Know
- The Fastest Growing Social Media Platforms [New Data]
- Which Social Media Channels are Gaining & Losing Steam? [Data]
7. Video marketing dominates.
While an effective content strategy will typically leverage a range of platforms, our most recent survey data suggests that visual formats — including short-form video, images, and live-streaming video — are particularly popular.
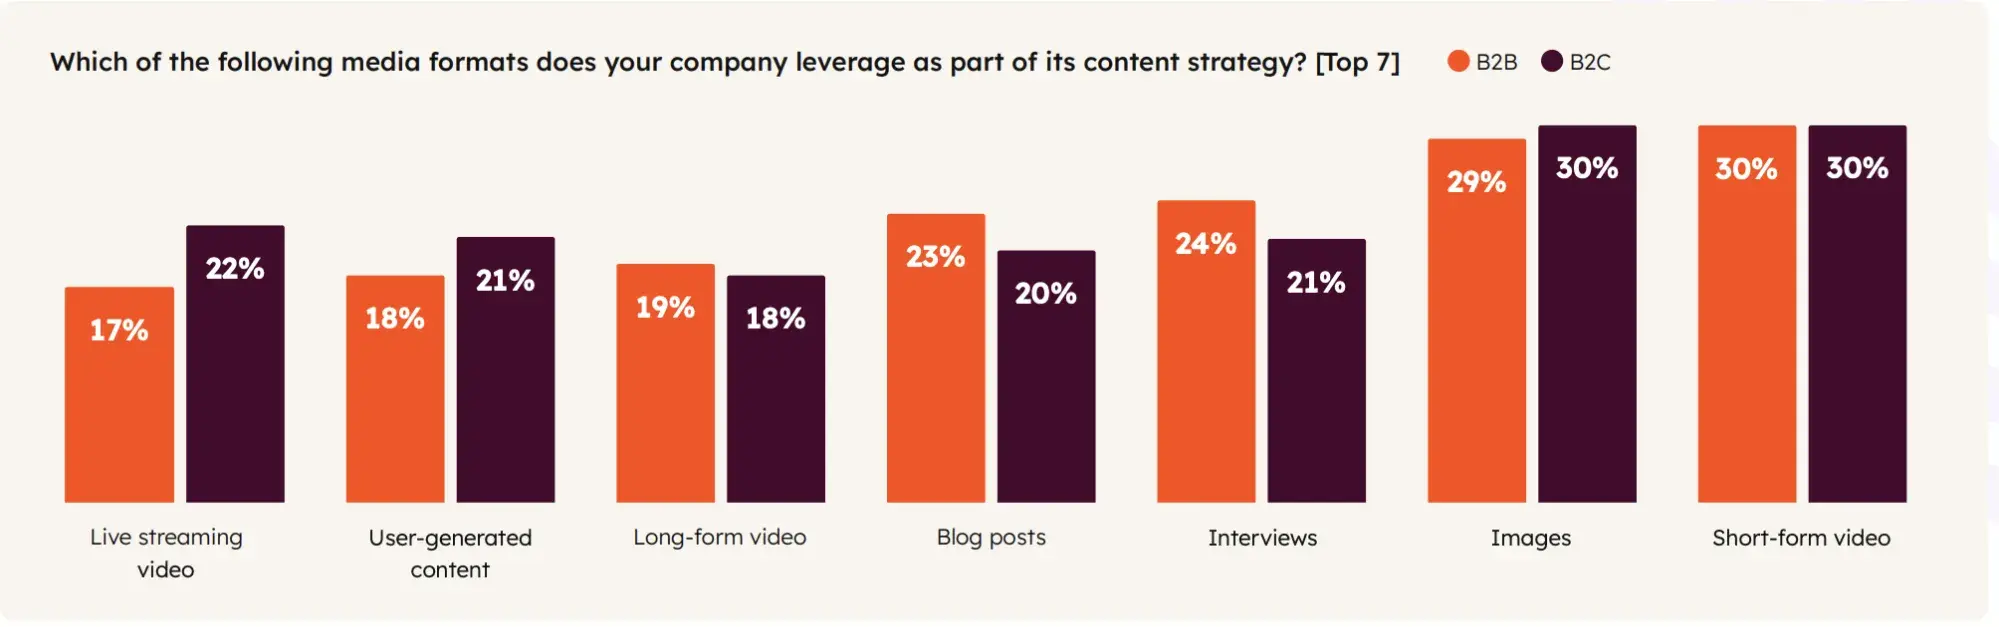
This doesn’t surprise me. After all, in 2024, all three of these formats were reported as among the highest ROI formats, and social media platforms that focus on visual content (such as YouTube, Instagram, and TikTok) are also seeing increased investment in 2025 at rates higher than other channels.
Our blog team has been predicting a short-form video renaissance since the rise of TikTok during the pandemic, and today, there’s hardly any contest.
Priya Gill, VP & Global Head of Marketing for SurveyMonkey, has found substantial success with visual marketing too.
She explains, “Short-form video, images, and user-generated content are impactful because they align with how today’s audiences consume and engage with content — quickly, visually, and authentically. These formats grab attention in seconds and allow businesses to tell compelling stories that resonate.”
In fact, short-form video now drives the highest ROI of any content format, with 21% of marketers ranking it as their top performer in our survey.
Platform-specific strategies, however, are crucial for success. Here are some to keep in mind:
- TikTok: 15-30 second videos with trending audio perform best
- Instagram Reels: 30-60 seconds optimal, with 7-10 second hooks
- YouTube Shorts: 60 seconds max, focusing on educational content
- LinkedIn: 30-90 seconds for B2B audiences, with captions for silent viewing
Also, the beauty of video marketing today is that you don't need Hollywood budgets.
Marketers are finding success with:
- Behind-the-scenes content that humanizes brands
- Quick tutorials that solve specific problems
- User-generated content that builds authenticity
- AI-powered video tools that transform blog posts into engaging videos
Overall, the data speaks volumes: brands using video grow revenue 49% faster than those that don't. So, start with one platform, master its unique format, then expand. Remember — authenticity beats production value every time.
Forty-seven percent of marketers report turning to AI to help them create and edit video for social media, according to our AI Trends for Marketers report.
Tools like HubSpot's Content Remix can automatically convert your existing blog content into video scripts, social posts, and audio content.
8. Voice search optimization becomes critical for discovery.
Voice search has transformed from futuristic to familiar with 8.4 billion voice assistants like Alexa, Google Home, or Siri being used actively worldwide as of 2024. Heck, even cars have voice assistants now.
This shift demands a fundamental change in how marketers approach SEO and content optimization in order to get found. Let me explain.
Voice searches are conversational and question-based. Instead of typing “best coffee shops Seattle,” users ask “What are the best coffee shops near me?” or “Where can I get organic coffee in downtown Seattle?”
This natural language pattern requires marketers to rethink their keyword strategies and messaging.
Here’s what you can do to start optimizing for voice search:
- Add speakable schema to key sections you want voice assistants to prioritize when reading answers aloud.
- Use long-tail conversational keywords that mirror how people actually speak.
- Include FAQ sections and question-based headers that directly answers common queries.
- Optimize for local search if relevant. 76% of voice searches are for things nearby or locally.
- Optimize for featured snippets as voice assistants often pull from position zero results.
Smart marketers are already creating dedicated voice search content strategies. By anticipating conversational queries and structuring content to provide immediate, clear answers, brands can capture this growing search segment before competitors catch up.
Read: “How and Why to Optimize Your Website for Voice Search”
The State of Marketing in 2025
HubSpot's Annual Inbound Marketing Trends Report
- Top Marketing Channels
- AI in Marketing
- Managing Privacy
- The Future of Marketing
Download Free
All fields are required.
9. AR and VR transform customer experiences.
Augmented and virtual reality are no longer gaming gimmicks but powerful marketing tools that drive real business results.
Major brands are already seeing success. For example, IKEA's AR app lets customers visualize furniture in their actual living spaces, while Sephora's Virtual Artist lets beauty enthusiasts see how product shades look on them.

Even Amazon is allowing users to see clothing on themselves on mobile.
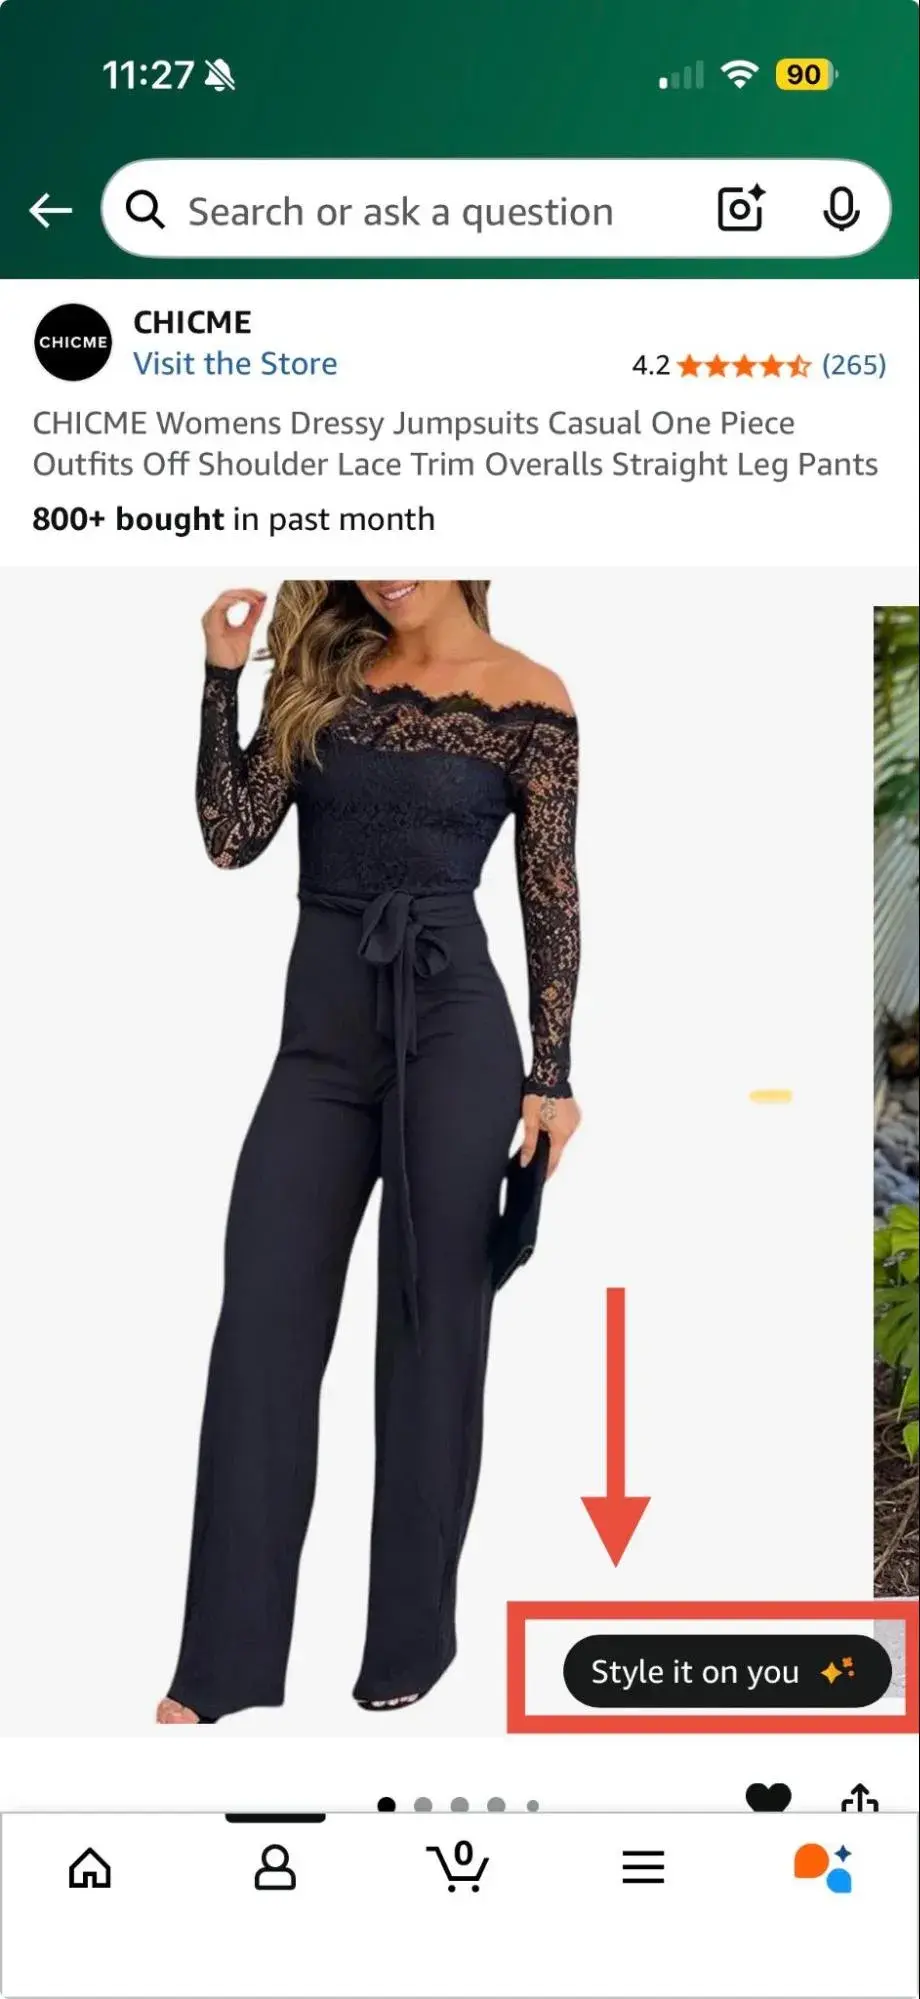
These immersive technologies solve a fundamental e-commerce challenge: the inability to experience products before purchase.
AR bridges this gap by overlaying digital elements onto the real world through smartphones, while VR creates realistic brand environments for deeper engagement. In fact, according to McKinsey these features can lead to 64% fewer returns.
For brands ready to explore and reap the benefits of AR/VR, consider:
- Starting small. Explore AR filters on social platforms like Instagram, Snapchat, and TikTok.
- Establishing a presence on existing platforms your audience may frequent like the Metaverse, ROBLOX, or MINECRAFT.
- Using QR codes to add a digital element to real-life experiences or physical assets.
I won’t lie to you: AR/VR comes with skill and budgetary barriers — but those barriers are lowering with each passing month. Get creative and watch this space to see how things evolve and become more accessible.
Check out these resources:
- Memorable Examples of AR in Customer Experience [+Tips for Implementing the Technology]
- AR/VR in Sales: 5 Early Applications
10. Niche influencers are emerging as a key channel.
While influencer marketing has been an important marketing channel for some time, our latest survey highlights the growing role of niche influencers in particular.
In 2024, marketers reported leveraging and benefiting from small-scale influencers — that is, influencers with fewer than 100,000 followers — more than larger-scale influencers.

Our respondents noted that despite their relatively small number of followers, these niche influencers offered access to audiences with strong brand loyalty and trust, making them especially valuable.
Parimal Deshpande, Senior Director of Product Marketing for Adobe Express, agrees that partnering with a content creator who resonates with your target audience can be incredibly valuable, arguing, “The key to successful marketing lies in building authenticity and trust.”
He continues, “Personality-led content, delivered through creators and channels that resonate with audiences, is integral to achieving that.”
As such, it makes sense that nearly one in four respondents listed influencer marketing as a top trend for 2024, with 68% reporting that they had partnered with a niche influencer in the last year.
In contrast, only one in four survey respondents reported working with an influencer who had between 100,000 and one million followers, and just 7% worked with influencers with audiences of over one million.
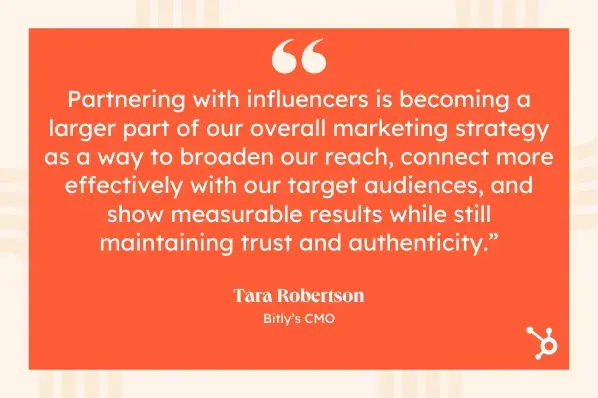
To learn more about how real-world marketers are working with influencers, we asked Bitly CMO Tara Robertson to shed some light on her organization’s recent experience with influencer marketing.
She shared, “In the second half of 2024, we launched an influencer pilot program on Instagram to better understand how established personalities and communities could further drive content,
conversation, and awareness beyond Bitly’s own channel.”
And what happened? Robertson reports, “The results were strong. Compared to our average Instagram performance, we saw 5X higher the impressions and video views, 6X higher engagement, and 82% growth in followers.”
“As a result, partnering with influencers is becoming a larger part of our overall marketing strategy as a way to broaden our reach, connect more effectively with our target audiences, and show measurable results while still maintaining trust and authenticity.”
Diving deeper, when we asked respondents about the benefits of working with these smaller-scale influencers and creators, the number one reason they cited was that these niche influencers were more trusted by their followers or subscribers.
Beyond this, respondents also noted that smaller influencers give them access to more niche, tighter-knit communities, as well as generally being a lot less expensive than influencers with larger audiences.
In other words, follower count isn’t everything. Our recent Social Media Trends Report found that most marketers say “quality of content” is the most important factor when determining which influencers to partner with, rather than just how many followers or subscribers an influencer has.
Indeed, as Aaron Cort, Head of Marketing, Growth and GTM for Craft Ventures points out,
“People have such a high bar for what they act on these days, for both business and consumers.”
In this environment, “Influencers help bridge that gap behind a dedicated effort toward establishing positive brand affinity and word of mouth first.”
11. Data privacy changes remain a challenge.
From iOS changes to GDPR and Google’s plans to phase out third-party cookies, I’ve seen firsthand that increased data privacy regulations have posed a substantial hurdle for marketing industry growth over the past few years.
As a marketer myself, I know these changes can be frustrating — but with 84% of respondents in our recent consumer trends survey reporting that they believe data privacy is a human right, public opinion is definitely shifting toward having more safeguards around personal data.
As such, it’s understandable that nearly nine out of ten marketers (88%) reported that data privacy changes such as GDPR, iOS, and Google phasing out third-party cookies impacted their overall marketing strategy over the past year.
The good news is that there are lots of tools and strategies that today’s organizations are pursuing to balance effective marketing with adequately protecting people’s data.
12. Personalization is essential.
According to our latest survey results, 86% of marketers report that their customers get a somewhat or very personalized experience with their brand. Even more impressive, a whopping 94% report that offering a personalized customer experience impacts their company’s sales.
In other words, the data shows that offering a highly personalized experience is more essential than ever.
At the same time, studies show that most marketers lack crucial information about their audience, with only 65% saying they have high-quality data on their target demographic.
Indeed, when we asked marketers what they knew about their target audience, less than half reported knowing where they consume content, their basic demographic information, or their interests and hobbies, let alone the kinds of products they are interested in or insights about their shopping habits.
To address these challenges, I’ve found HubSpot’s Marketing Analytics tool can be incredibly valuable. This tool provides helpful insights into customer behavior, preferences, and engagement patterns, helping marketers create more personalized and effective campaigns.
Learn more about personalization with HubSpot CRM.
The State of Marketing in 2025
HubSpot's Annual Inbound Marketing Trends Report
- Top Marketing Channels
- AI in Marketing
- Managing Privacy
- The Future of Marketing
Download Free
All fields are required.
13. Marketers still struggle with disconnected data and silos.
Personalizing your marketing efforts effectively is easiest when you have a single source of truth for your customer information.
Unfortunately, our data suggests that this remains a challenge, with many marketers reporting that they struggle with disconnected data sources, company silos, and a lack of a centralized and accessible source of information about their customers.
In fact, just one out of five marketers reported that their marketing data is fully integrated with the tools they use, and 30% shared that the interactions between the various tools they used in their marketing role were either slightly or very disjointed.
Similarly, 28% of respondents felt that it was somewhat or very difficult to get the data they needed from other teams at their company, while 34% felt that it was somewhat or very difficult to share their own data with other teams across their company. These issues create a “crisis of disconnection” that can prevent marketing teams from getting a holistic view of their data, as well as reducing the quality of that data.
Anna James, Work Innovation Analytics Lead at Asana’s Work Innovation Lab, speaks eloquently to the risks of this crisis, sharing: “Marketers are facing extremely high levels of digital burnout as a result of using fragmented tools and systems.”
As such, she argues that “in 2025, success won’t come from adding more technology — it will come from refining and streamlining technology, enabling marketers to focus on creativity and more high-value impact.”
And James is not alone in this perspective. Today’s marketers recognize the power of having a single source of truth to address these challenges of disconnected data and siloed teams: We found that 82% of respondents believe that having a single source of truth for their marketing data is slightly, somewhat, or very beneficial to their organization.
A single source of truth directly addresses the top challenges that emerge when teams are misaligned: A lack of effective communication, sales and marketing teams using different tools, and difficulty sharing data between teams. That’s likely why 69% of marketers report that their CRM is somewhat or very important for the success of their overall marketing strategy.
One of my favorite ways to gain access to a single source of truth is to implement a CRM like HubSpot. HubSpot’s CRM integrates data with tools, cutting across silos and boosting alignment across teams.
14. Being data-driven is no longer a nice-to-have.
While the importance of data is far from new, this year’s survey responses highlight just how critical it has become to ensure your marketing organization is truly data-driven.
Leveraging data effectively helps marketers understand how their various strategies are performing, in turn helping them demonstrate the ROI of their efforts and informing their decision-making on future strategy.
At the same time, we found that using data to understand and target customers has become less salient in the minds of today’s marketers, at least in part because the data landscape has become increasingly challenging due to increasing privacy and security requirements.
In addition, when we asked respondents to identify the greatest challenges they encountered with respect to understanding and gathering data from their target audience, 21% pointed to consumers being less trusting with their personal data, 19% pointed to poor data quality, and 18% noted increased data privacy regulations that reduce access to personal data.
Nevertheless, our research demonstrates that despite these challenges, being data-driven is no longer a nice-to-have. In today’s landscape, aligning a brand’s marketing initiatives with its customers’ values depends on maintaining access to accurate, up-to-date data about those customers.
That’s likely why when asked about the biggest changes in the marketing industry over the last year, 29% emphasized the importance of using data to inform their marketing strategy and 26% noted the importance of using data to demonstrate the ROI and business value of their marketing efforts.
Tools like HubSpot's free email tracking software help marketers stay data-driven by showing exactly when prospects engage with their messages, providing real-time insights into campaign performance.
Indeed, the biggest advantages of developing a data-driven marketing strategy that our respondents pointed to were to understand which marketing strategies were most effective (listed by 31% of respondents), to increase the ROI of their marketing efforts (30%), and to reach their target audience more effectively (27%).
As Priya Gill of SurveyMonkey explains, “We’ve found success using data (surveys and polls) to understand what our audiences care most about, keeping content short and snappy, showcasing authenticity, and testing and iterating on our ideas.”
Leveraging data effectively can be quite challenging — but to succeed in today’s business environment, marketers can't afford to not be data-driven.
Digital Marketing Trend FAQs
1. What digital marketing trend should I prioritize first?
If you’re just getting started, focus on AI-driven content creation and workflow automation. According to HubSpot’s 2025 State of Marketing Report, 51% of marketers now use AI tools, especially for content repurposing and analytics. Start by automating repetitive tasks, then expand into AI-assisted creative ideation, reporting, and strategy.
Quick win: Use HubSpot’s Free AI Content Creator or Content Remix to transform existing blog content into social posts, videos, or emails in minutes.
2. How much should I budget for AI marketing tools?
AI tools can fit nearly any budget. For instance, HubSpot goes from free to enterprise pricing.
Aim to allocate 5–10% of your total marketing budget to AI tools initially, then scale based on ROI. HubSpot’s data shows marketers who automate content and analytics report higher efficiency and faster campaign execution (HubSpot AI Trends Report).
3. Is voice search optimization worth the investment for B2B companies?
Absolutely. With 35% of households using smart speakers and over 8.4 billion voice assistants worldwide, optimizing for voice search boosts both discoverability and credibility.
It’s especially important if your business is brick-and-mortar or has multiple locations.
Read more: How and Why to Optimize Your Website for Voice Search.
4. What's the difference between marketing automation and AI?
While both improve efficiency, AI and automation serve different purposes:
- Marketing automation executes predefined workflows (e.g., drip campaigns, email sequences).
- Artificial intelligence adapts and learns (e.g., predicts lead scores or personalizes content dynamically).
Automation is the engine; AI is the driver guiding smarter actions over time.
5. How do I measure ROI from influencer marketing?
Start by setting measurable goals — impressions, engagement, conversions, or follower growth — and tie results to CRM data.
HubSpot’s research shows that niche influencers (under 100K followers) deliver the highest ROI. Even Bitly CMO Tara Robertson reported 5× more impressions and 6× higher engagement through a niche influencer pilot.
Use tracking links (e.g., Bitly) and HubSpot CRM integrations to attribute influencer content to real business outcomes.
6. Which social media platform offers the best ROI for B2B vs. B2C?
According to HubSpot’s 2025 Social Media Marketing Report:
- B2C: Facebook and Instagram dominate, with Facebook delivering the highest ROI. (40% rank it among their top three).
- B2B: LinkedIn and YouTube lead for engagement and qualified leads.
Social commerce, influencer partnerships, and short-form video continue to outperform other formats across both categories.
7. What’s the future of digital marketing beyond 2025?
The next frontier revolves around hyper-personalization, immersive experiences, and ethical AI. Expect to see:
- AR/VR commerce experiences from brands like IKEA and Sephora.
- Data privacy-first marketing, as 84% of consumers view data privacy as a human right
- Voice and visual search dominance across devices.
Marketers who combine human creativity with machine intelligence — leveraging unified platforms like HubSpot’s CRM for a single source of truth — will lead the next era of growth.
What's Next: Your Marketing Action Plan
Today’s marketing landscape demands both strategic vision and tactical agility. While this report covers twelve major trends, not every trend requires immediate action.
Instead: audit your current capabilities against these trends, identify 2-3 that align with your audience and resources, run pilot programs to test impact before full investment, then measure results and scale what works.
The winners in 2025 won't be those who chase every trend, but those who thoughtfully integrate the right innovations for their specific context. Start small, measure everything, and scale strategically.
Ready to dive deeper? Download our complete 2025 State of Marketing Report for detailed implementation guides, benchmarks, and exclusive data to guide your strategy.
The State of Marketing in 2025
HubSpot's Annual Inbound Marketing Trends Report
- Top Marketing Channels
- AI in Marketing
- Managing Privacy
- The Future of Marketing
Download Free
All fields are required.
Marketing Trends
![4 shopping trends to expect in uncertain financial times [data + how marketers can adapt]](https://53.fs1.hubspotusercontent-na1.net/hubfs/53/consumer-recession-spend.webp)
![The Future Consumer: State of Consumer Trends in 2025 [Data from 700+ Consumers]](https://53.fs1.hubspotusercontent-na1.net/hubfs/53/consumer%20trends%202023-1.png)
![The Top Marketing Trends of 2025 & How They've Changed Since 2024 [Data from 1400+ Global Marketers]](https://53.fs1.hubspotusercontent-na1.net/hubfs/53/Untitled%20design%20(68).jpg)

![4 Marketing Trends & Strategies That Might Not Survive in 2025 [New Research]](https://53.fs1.hubspotusercontent-na1.net/hubfs/53/marketing%20trends%20that%20might%20not%20survive%202024.png)
![The HubSpot Blog's Marketing Leadership Report: How 720+ Brand Leaders Will Get Ahead in 2025 [+ How to Join Them]](https://53.fs1.hubspotusercontent-na1.net/hubfs/53/Copy%20of%20The%20Future%20of%20Work%20is%20Flexible%20%5BImage%2c%20IG%5D%20(598%20%C3%97%20398%20px)%20(595%20%C3%97%20400%20px)%20(517%20%C3%97%20517%20px).png)
![Top Shopping Trends of 2024 & How They've Changed [New Data]](https://53.fs1.hubspotusercontent-na1.net/hubfs/53/shopping-trends_3.webp)


![How Each Generation Shops in 2024 [New Data from Our State of Consumer Trends Report]](https://53.fs1.hubspotusercontent-na1.net/hubfs/53/how-each-generation-shops-1-20240801-5345961-1.webp)