.png?width=112&height=112&name=Image%20Hackathon%20%E2%80%93%20Square%20(14).png)

Table of Contents
- What is a sales report?
- Types of Sales Analysis Reports
- What Is Sales Analysis?
- Importance of Sales Analysis
- Types of Sales Analysis
- Benefits of Sales Reporting
- How to Write a Sales Report
- Sales Report Templates
What Is Sales Analysis?
Sales analysis is the process of using a broad range of sales data to make informed business decisions and improve revenue growth. This is a large umbrella term that encompasses an enormous amount of business objectives:
- Using historical sales data to understand market trends and forecast future sales.
- Uncovering what‘s helping and what’s hurting your sales revenue.
- Improving sales team efficiency.
- Identifying opportunities.
Sales analysis can be done on an individual product level (AKA product sales analysis) or on a business-wide level. I can’t overstate its importance.
.png)
Free Sales Metrics Calculator
A free, interactive template to calculate your sales KPIs.
- Average Deal Size
- Customer Acquisition Cost (CAC)
- Customer Lifetime Value (CLV)
- And more!
Download Free
All fields are required.
Importance of Sales Analysis
What payoffs lie within the sea of spreadsheets? Here's what CEOs I talked to have to say about the importance of sales analysis for their companies.
Identify trends.
By gathering enough sales data for your company, you can search for predictable trends. This is called sales trend analysis, and it's incredibly powerful.
Joseph Passalacqua, CEO of Maid Sailors, says that sales analysis is the crystal ball at the core of his expansion strategy, and it has shown valuable sales trends for his company.
“We use sales analysis as a tool to sort through the chaos and concentrate on the things that are really important to our clients,” Passalacqua shared. With this data, Maid Sailors has been able to:
- Improve their service packages by closely analyzing their sales patterns.
- Foresee seasonal swings in demand.
- Adjust their scheduling.
“No matter how busy the city becomes, we're always ready to provide excellent service thanks to our data-driven strategy,” he added. “Our sales analysis doesn't just show us where we've been; it lights the route to our destination.”
Make data-driven decisions.
We've all experienced a manager or project leader who makes emotionally driven decisions. Not only is it ineffective, but this approach erodes trust within teams, impacting team performance and morale immeasurably.
What‘s your best product? When do you make most of your sales? What’s your most important time of the year? How much does your sales team make in a normal quarter? How satisfied are your customers? Which sales channels are most important?
All of these questions have factual answers, and answering them with anything but data is a costly mistake. I’ve found sales analysis enables data-driven, proactive decisions. This improves revenue and builds trust within teams. In-depth sales analysis is important at all times in business, not to mention during a recession or time of economic uncertainty.
Fuel sustainable growth.
Sales analysis is about more than just crunching numbers. James White, CEO of Amazing Moves, says that it explains the heartbeat of his business.
"Through sales data, we get very good insight into customer preferences, market trends, and operational efficiencies. That allows for improved decision-making and strategy optimization, which in the future will lead to attaining sustainable growth with profitability."
Free Sales Metrics Calculator
A free, interactive template to calculate your sales KPIs.
- Average Deal Size
- Customer Acquisition Cost (CAC)
- Customer Lifetime Value (CLV)
- And more!
Download Free
All fields are required.
Types of Sales Analysis
Remember the ghosts of Christmas past, present, and future who visit Scrooge in “A Christmas Carol” to deliver an urgent message about how he's living his life? Sales management (present), forecasting (future), and reporting (past) are these ghosts in your organization.
They have a pressing message about where you‘ve been, where you’re honestly at now, and where your sales are going. Here's what they have to say.
Sales management.
Sales management is an assessment of how successful your sales team's performance is. How effective is your team at identifying new prospects, nurturing relationships, and closing deals?
Sales management enables you to oversee how effective your sales strategies are in practice. Your sales management is the culmination of all of your forecasting and reporting efforts.
Insightful sales management statistics from our 2024 Sales Strategy Report:
- Efficiency is more important than ever: 70% of sales pros say that budgets are being scrutinized more than before.
- In-person meetings are the most effective sales channel, according to 51% of surveyed sales reps.
- Sales and marketing need to align, and companies are 107% more likely to exceed their goals when this happens.
Pro tip: An effective client relationship management (CRM) tool is needed for your team to reach their sales potential. Get instant access to HubSpot's Free CRM. Our research found that 43% of sales managers count CRM usage as one of the most important productivity measures.
Sales forecasting.
Sales forecasting is an estimate of your future sales. With enough historical data, you can get a predictive sales analysis for the week, month, quarter, and year. Sales forecasting is a valuable dataset that predicts revenue, but it actually does much, much more for sales teams. Sales forecasting ...
- Improves motivation for sales reps by setting realistic key performance indicators and sales goals.
- Identifies trends and revenue opportunities that otherwise would've been missed.
- Exposes threats and predictable dips in sales revenue.
Accurate forecasting also helps reinforce the trust between leadership and sales teams. Unfortunately, accurate forecasting is more difficult to achieve than I expected. Less than half of teams have high confidence in their forecasting accuracy. It's been estimated that only one-quarter of sales organizations have 75% or higher forecast accuracy.
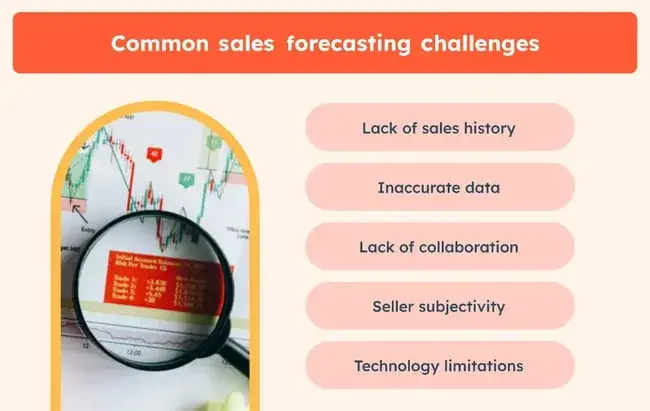
There are serious threats to accurate sales forecasting, including a lack of sales history, inaccurate data, lack of collaboration, seller subjectivity, and technology limitations. This is where effective sales reporting will save the day.
Sales reporting.
From the very basic data like revenue generated to advanced sales analytics like customer acquisition costs, sales reporting is the backbone of all sales processes. All sales analysis tools rely on accurate reporting data.
With tools like our sales reporting software, you have an unlimited amount of data at your fingertips for analysis, but where do you start? I’ll zoom in on sales reporting and examine the most influential sales reports that you can generate for your company today.
What is a sales report?
A sales report or sales analysis report is a document that shows trends impacting your sales operations within a specific period. While the content of sales reports may vary depending on your goal, they include metrics like revenue, accounts won, leads, and more. Insights from these reports help you identify the strengths and weaknesses of your sales strategy.
Tip: Skip the report learning curve with our Sales Software, which is built for productivity and efficiency.
Free Sales Metrics Calculator
A free, interactive template to calculate your sales KPIs.
- Average Deal Size
- Customer Acquisition Cost (CAC)
- Customer Lifetime Value (CLV)
- And more!
Download Free
All fields are required.
Benefits of Sales Reporting
In my experience, reporting data in a standardized way is crucial to the success of your business. Here are the common benefits of developing a sales reporting cadence.
Improving Team and Reps Performance
Sales reports provide data-driven insights about the sales performance of individual reps and your entire team. This allows you to know if underperforming reps need coaching. I think it’s also helpful that you can identify who would benefit from regular one-on-one meetings to level up and hit their quotas.
The same applies to your team. If your team isn’t hitting the company’s revenue goals, you can use sales reports to find gaps to improve your sales process.
Assisting Fast Decision-Making
Making informed and timely decisions is vital to the success of any sales strategy. This is where sales reporting shines.
With regular sales reporting, your C-suite or managers can quickly iterate on what drives the company's growth. You can also track and adjust sales tactics that are performing below par.
Boosting the Morale of Your Sales Team
Creating daily sales reports may be time-consuming. But whether you do this daily, weekly, or monthly, these reports can take team morale to new heights.
Monitoring and showing the sales performance of each team member motivates them to do more. Gamifying performance results can challenge other team members to quit settling for average performance. Put another way, sales reporting can create healthy competition and push your sales team to aim for the “best” outcomes.
Free Sales Metrics Calculator
A free, interactive template to calculate your sales KPIs.
- Average Deal Size
- Customer Acquisition Cost (CAC)
- Customer Lifetime Value (CLV)
- And more!
Download Free
All fields are required.
How to Write a Sales Report
The goal of every sales report is to pass actionable and detailed sales information to your team. To do this, you need to know the purpose and audience of your sales report. You’ll also need to use the right data, decide on a reporting timeframe, and create engaging slides.
Here’s my breakdown of how to write an engaging sales report.
1. Know the purpose of your sales report.
Identifying your goal is the first step toward creating a winning sales report. With your goal in mind, you can easily determine the best data to include and decide on a reporting timeframe.
Let’s say the purpose of your sales report is to motivate your reps. A weekly report showing several KPIs will show your team how far they are from the company’s monthly goal.
2. Tailor your sales report to your audience.
Metrics that interest your sales reps may not interest your CEO. Those that interest your CEO may not interest your director or VP of marketing. These folks are in the same organization as you, but they have different interests.
Sales reps may want granular details on their sales performance. Your marketing lead may only be interested in the sales reports from marketing campaigns. And, your busy CEO may only want the overall results of your marketing and sales activities without the specifics of how you reached your goals. See, different strokes for different people. I recommend you tailor your sales report accordingly.
3. Determine your sales reporting timeframe.
Your reporting timeframe depends on your sales objectives and how frequently you need to update your team or management. You can do this in three ways.
Daily Sales Reporting
A daily sales report tracks the sales activities of each business day. This report increases your rep’s accountability, encourages productivity, and includes sales performance metrics like:
- Duration of each outbound call.
- Number of sales opportunities.
- Number of outbound calls.
- Number of proposals sent.
- Number of emails sent.
Weekly Sales Reporting
A weekly sales report measures the weekly sales performance of individual reps and your entire sales team. This report allows sales leaders to know which reps are on track to hit their KPIs. Weekly sales reports track metrics like:
- Call/contact volume.
- Lead-to-opportunity ratio.
- Lead conversion ratio.
- Number of appointments set.
- Number of closed deals.
- Sales volume by channel.
- Total sales by region.
Monthly Sales Reporting
A monthly sales report summarizes your sales performance for the month. This report helps you determine the effectiveness of your sales strategy so you can tweak it if necessary. Monthly sales reports track metrics like:
- Number of deals at each stage of the pipeline.
- Number of scheduled meetings.
- Length of the sales cycle.
- Average close rate.
- Average deal size.
- Sales volume.
4. Get your sales data.
Collecting and analyzing your sales data is a lot easier when you’re using a CRM. With a CRM, you can use filters to remove duplicate records and pull specific information. That’s more fun than relying on clunky spreadsheets, right? You can create custom reports and dashboards with HubSpot’s sales management and reporting software.
Here’s a quick video I found on how you can gather sales data for your reports.
You can also create custom reports if you regularly use certain sales data. Here’s how:
5. Explain key insights from your sales data.
You need to make sense of your sales data by explaining the “why” of each one.
- If there was a dip in the close rate, why?
- If there was a high lead conversion ratio, why?
- If there are more won deals in a specific region, why?
Just as the questions are endless, so are the insights you can gain by evaluating your sales data. For instance, more won deals could have resulted from a new tactic your team tried, a new channel they started using, a partner ecosystem they joined, and much more.
In my opinion, when you state why there’s an upward or downward trend in your data, you provide a roadmap for what your team can improve and what they can continue doing to achieve the best sales results.
Note: If possible, I recommend you attribute which changes to your sales data were caused by team tactics and which are attributed to the larger macroeconomic environment. A spike or dip in sales may be the result of factors beyond your control. You’ll want to distinguish those factors where possible.
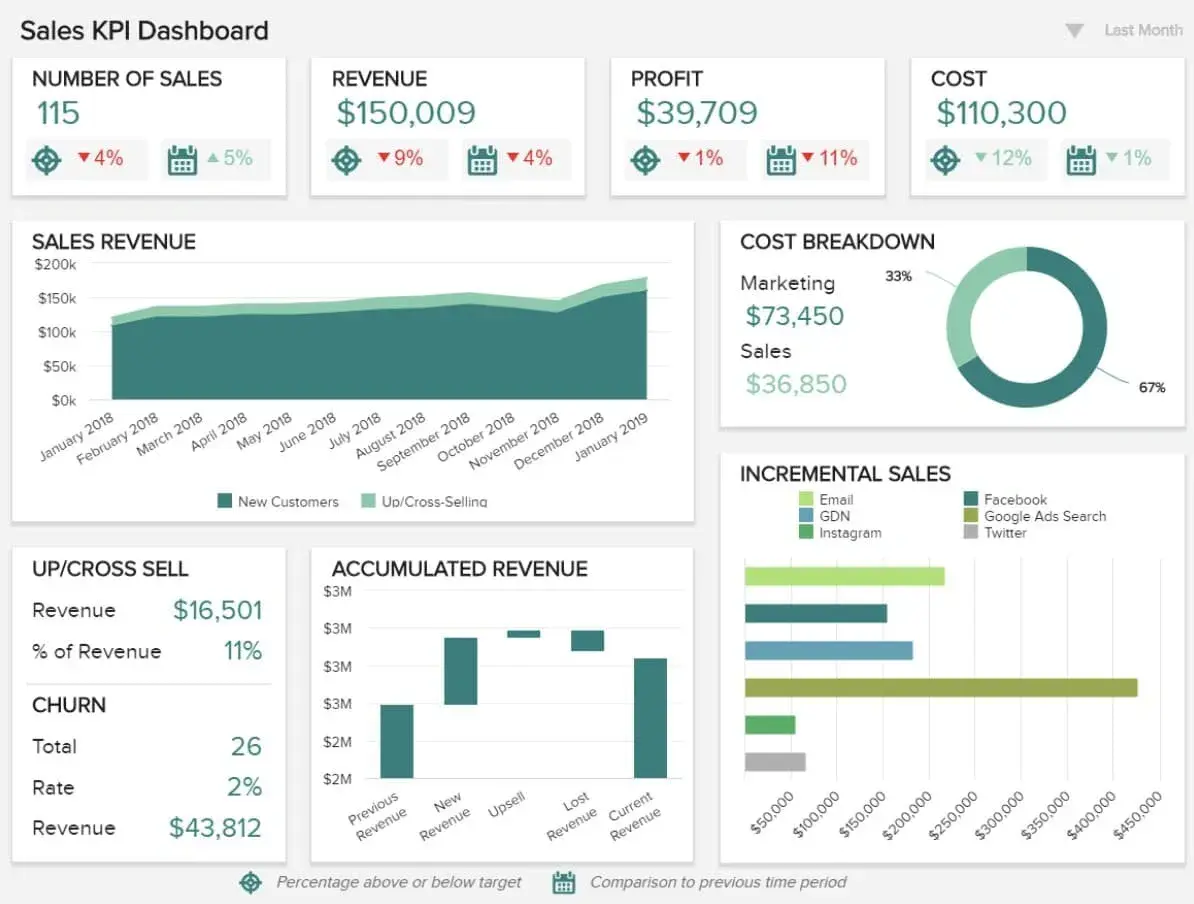
6. Use visuals to show vital sales trends and metrics.
Remember the popular saying, “A picture is worth a thousand words?”
It’s true, especially with sales reporting. In my experience, when you create attractive visuals, your audience won’t have to wade through spreadsheets with lots of numbers. This saves their time and allows you to quickly communicate the insights in your report.
The best part? You can generate engaging visuals directly on HubSpot. Think pie charts, bar charts, line charts, and more.
Having dedicated technology to track lead and customer data makes it easy for sales leaders to analyze team performance and identify areas for improvement. But what are some essential reports every sales leader needs to track? I've listed some of the most important ones below.
Free Sales Metrics Calculator
A free, interactive template to calculate your sales KPIs.
- Average Deal Size
- Customer Acquisition Cost (CAC)
- Customer Lifetime Value (CLV)
- And more!
Download Free
All fields are required.
Types of Sales Analysis Reports
- Sales Pipeline Report
- Conversion Rates Report
- Average Deal Size Report
- Average Sales Cycle Length Report
- Marketing Collateral Usage Report
- Won and Lost Deals Analysis Report
- Churned Customers Report
- Sales Call Report
- Lead Response Time Report
- Revenue Report
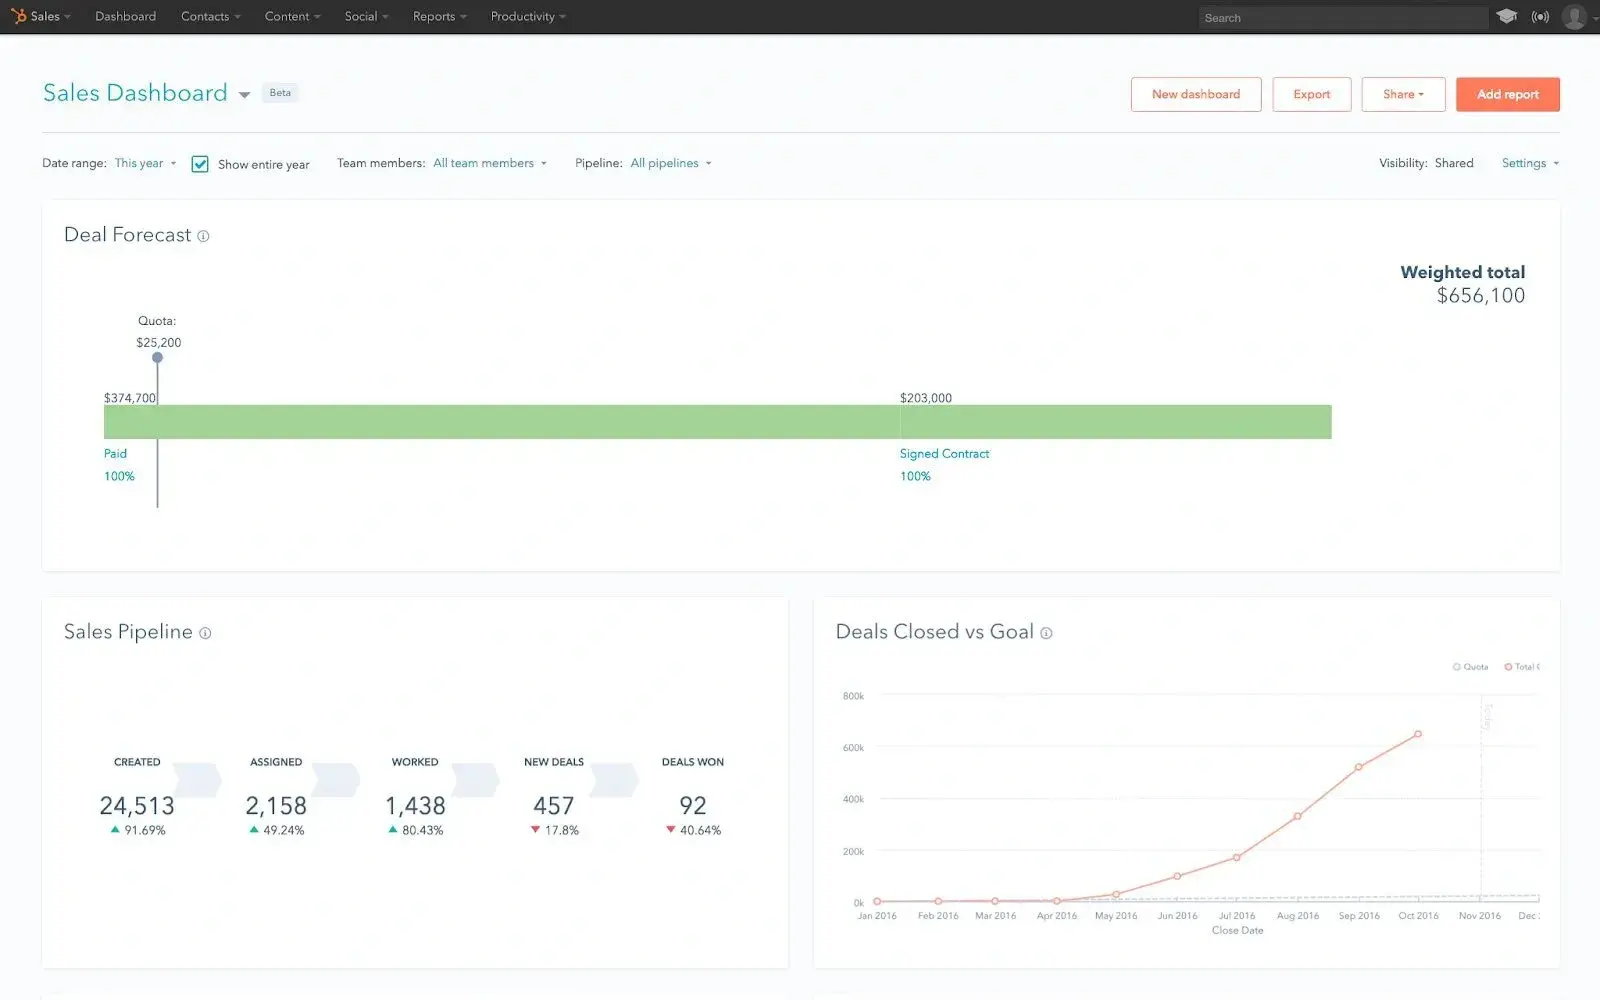
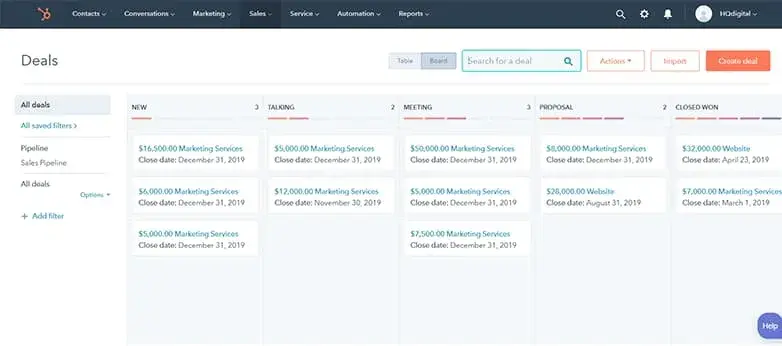
1. Sales Pipeline Report
A complete and accurate pipeline is a must-have. Without one, you can’t assess the sales health of your company. As a sales leader, you need to know the deals that are likely to get closed, those that may not, and how much of an impact each deal has on your bottom line.
To accurately forecast these, I suggest ensuring your reps are doing their due diligence to guarantee a realistic sales pipeline.
This is an example of what a pipeline report looks like in HubSpot Sales Hub. You’ll notice each stage of the pipeline and where opportunities are within it. You can even add forecasted deal amounts to see the worth of each deal and its proximity to closing.
Best for: Understanding the sales pipeline stages where your team excels and needs help. I also like how you can identify the specific actions your reps should take to move prospects through each stage of your pipeline, the number of prospects in the pipeline, and how close your team is getting to their targets.
2. Conversion Rates Report
Conversion rate measures the ability of your team to turn prospects into leads and leads into customers.
By monitoring your conversion rate, you can identify where your team excels or underperforms in the sales lifecycle. If your team consistently has a high conversion rate of turning leads into opportunities, you can scale the strategies that are already working. Otherwise, you can start finding areas for improvement.
This report is also a litmus test for the strengths and weaknesses of individual reps. If a rep is performing below par, looking into their conversion rate helps you uncover why.
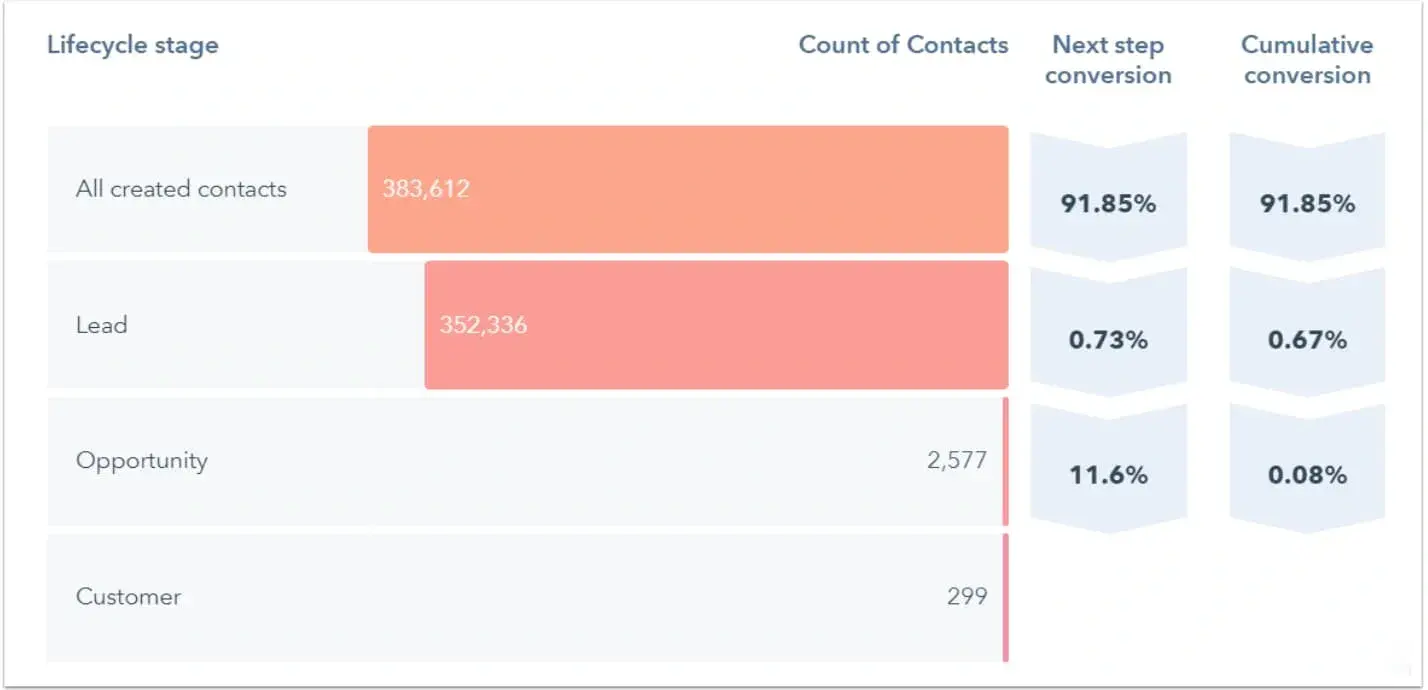
Best for: Revealing the efficacy of your overall sales strategy on an operational or team-wide scale. It also measures the effectiveness of your sales team at converting leads into customers.
3. Average Deal Size Report
Your average deal size helps in predicting revenue. For instance, if your revenue target is $200k per quarter and your average deal size is $20k, it means you have to land 10 deals to hit your quarterly target.
The average deal size report provides the basis for your reps‘ quotas and lets them know how many deals they’re expected to land. It also allows you to set expectations and milestones for your sales cycle. Ultimately, it might seem like a no-brainer, but I think it's still worth reminding you — always monitor your average deal size because it’s vital to your sales operations.
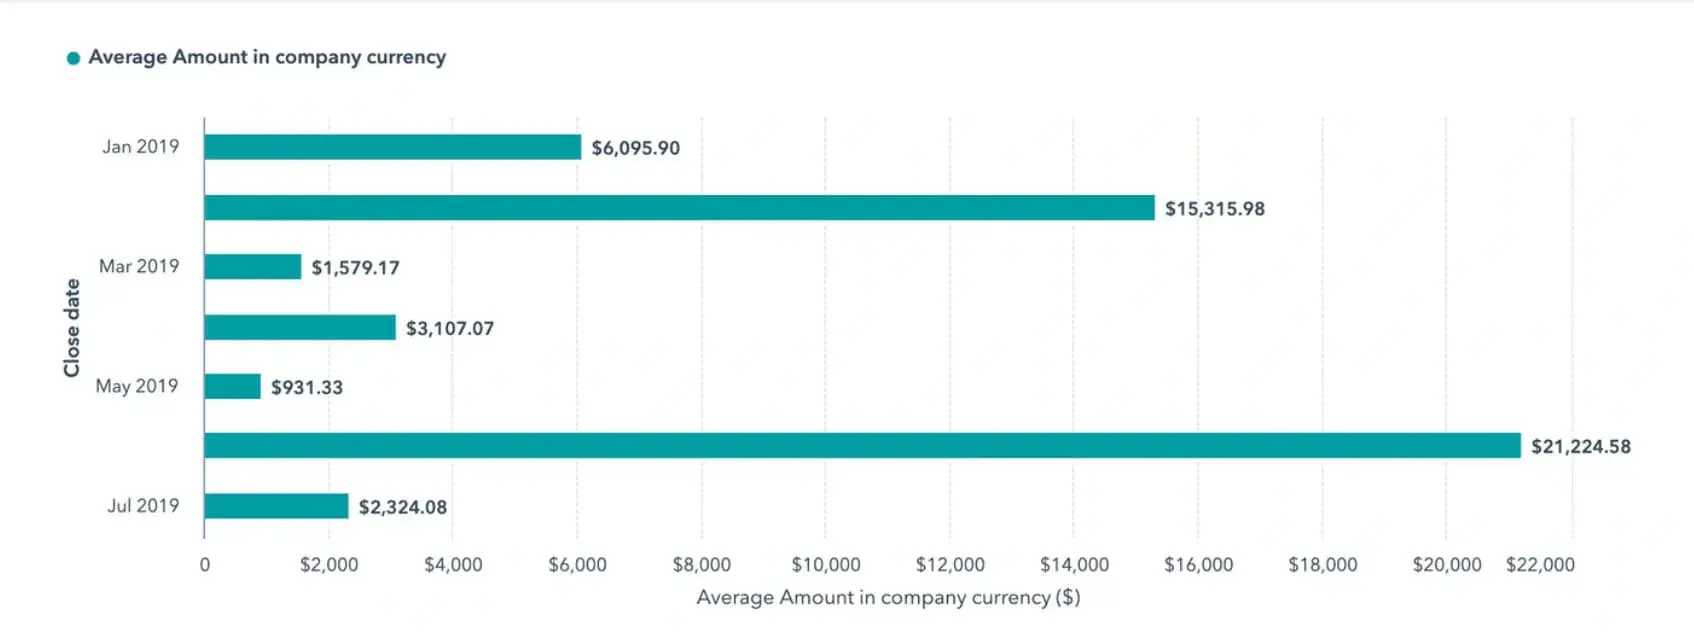
Best for: Setting expectations for each rep, creating weekly and monthly milestones, tracking the performance of each rep, and gauging the overall success of your company’s sales strategy.
4. Average Sales Cycle Length Report
Average sales cycle length is the average time it takes a rep to close a sale. This metric shows the sales performance of individual reps and the overall efficacy of your sales process.
When considering the metric, I suggest you establish an ideal timeframe to use as a benchmark. One of those benchmarks is how long it takes a rep to work through your sales cycle. If you find some reps with much longer sales cycles compared to their peers, you can evaluate their efforts and identify areas for coaching.
If all your reps can’t keep pace with your target average sales cycle length, then it‘s probably time to take an objective look at your operations. You might find flaws in your approach, training, or management style, and these insights can help you fix the issues. To enable your reps to see how they’re performing with real-time visualization dashboards, tools like Datapine can help.
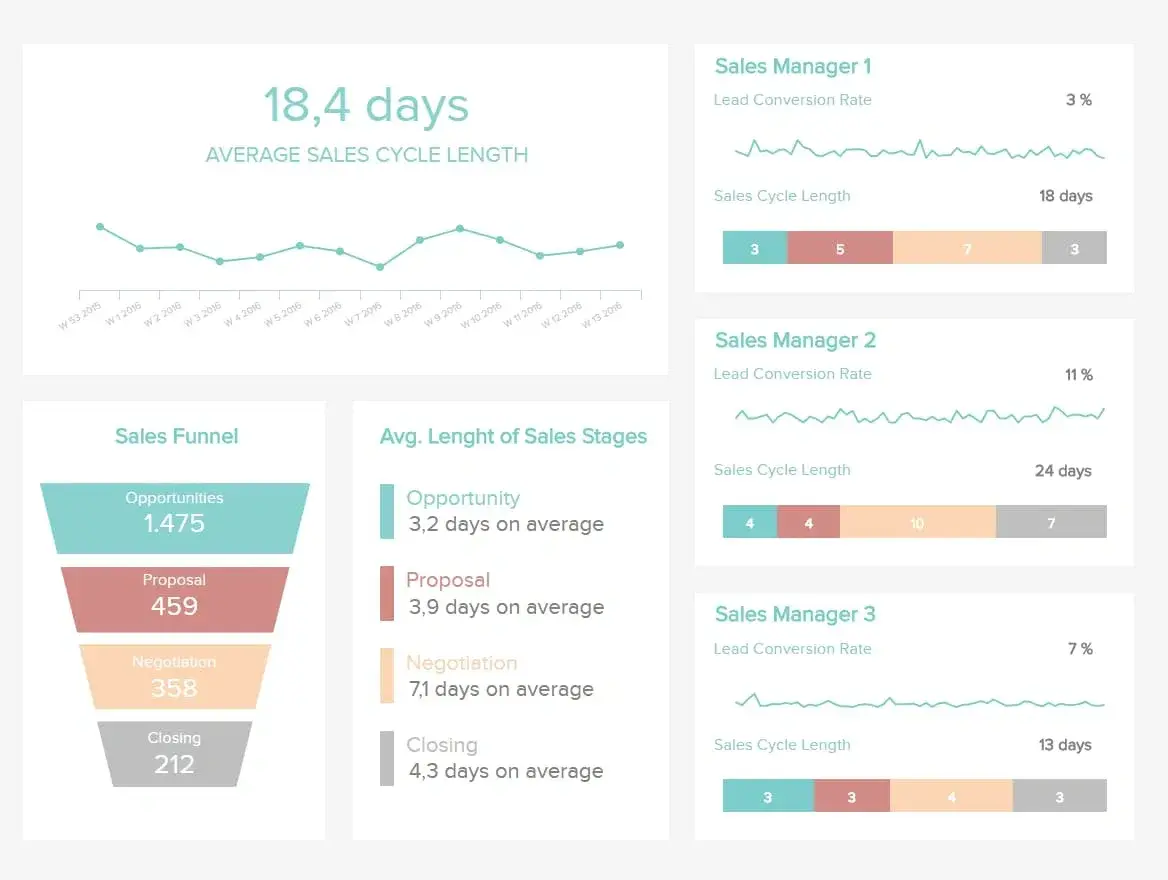
Best for: Knowing if your reps are closing deals at a similar rate as their peers. You can also create contests to foster healthy competition and unify your team to work towards a common goal.
5. Marketing Collateral Usage Report
Marketing teams expect sales reps to put the collateral they create to good use. This helps the sales reps move prospects through the sales process quickly.
That said, some marketing collateral may be irrelevant to your rep’s prospects. With this report, you’ll know which marketing content works. Communicating this information to your marketing team gives them the insights they need to create more useful content.
I like sales enablement platform SoloFire because it tracks how many people have used a piece of collateral, how many times they’ve interacted with it, and for how long.
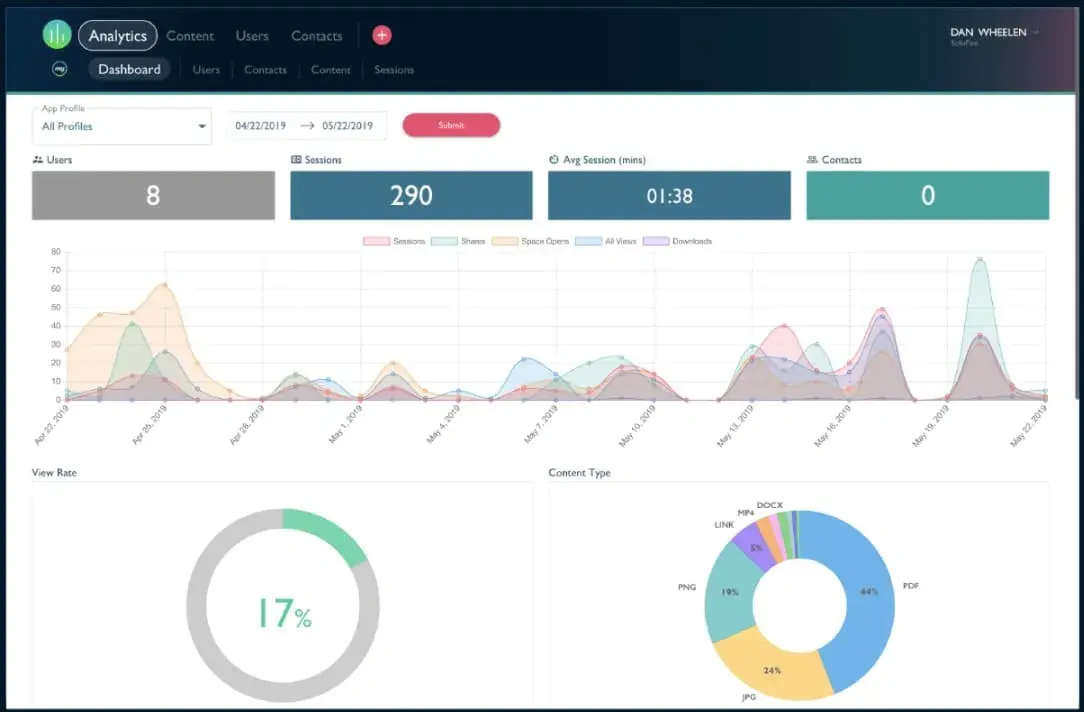
Best for: Determining which marketing collateral gets the most traction with prospects and collateral that could use a refresh.
6. Won and Lost Deals Analysis Report
To understand the state of your business, you shouldn’t track only deals in progress. You should track deals you win and lose.
Perhaps prospects go crazy for specific features that you offer. Or, you notice that there’s a preference for a competitor’s product. Both trends provide an overall picture of your product’s overall strengths and weaknesses.
I think this is also a good way to spot under- and over-performers. For example, two reps who have the same average quota attainment could both appear to be stellar but differ wildly in actual performance.
If your data reveals that one rep spends a lot of time helping others get deals across the finish line while still maintaining high attainment, you have a great manager candidate on your hands.
On the flip side, records could reveal that a second rep has the same attainment as the first but relies on other teammates to run demos or closing calls.
In my experience, there’s always a story behind the numbers. Analyzing won and lost deals by rep will reveal it.
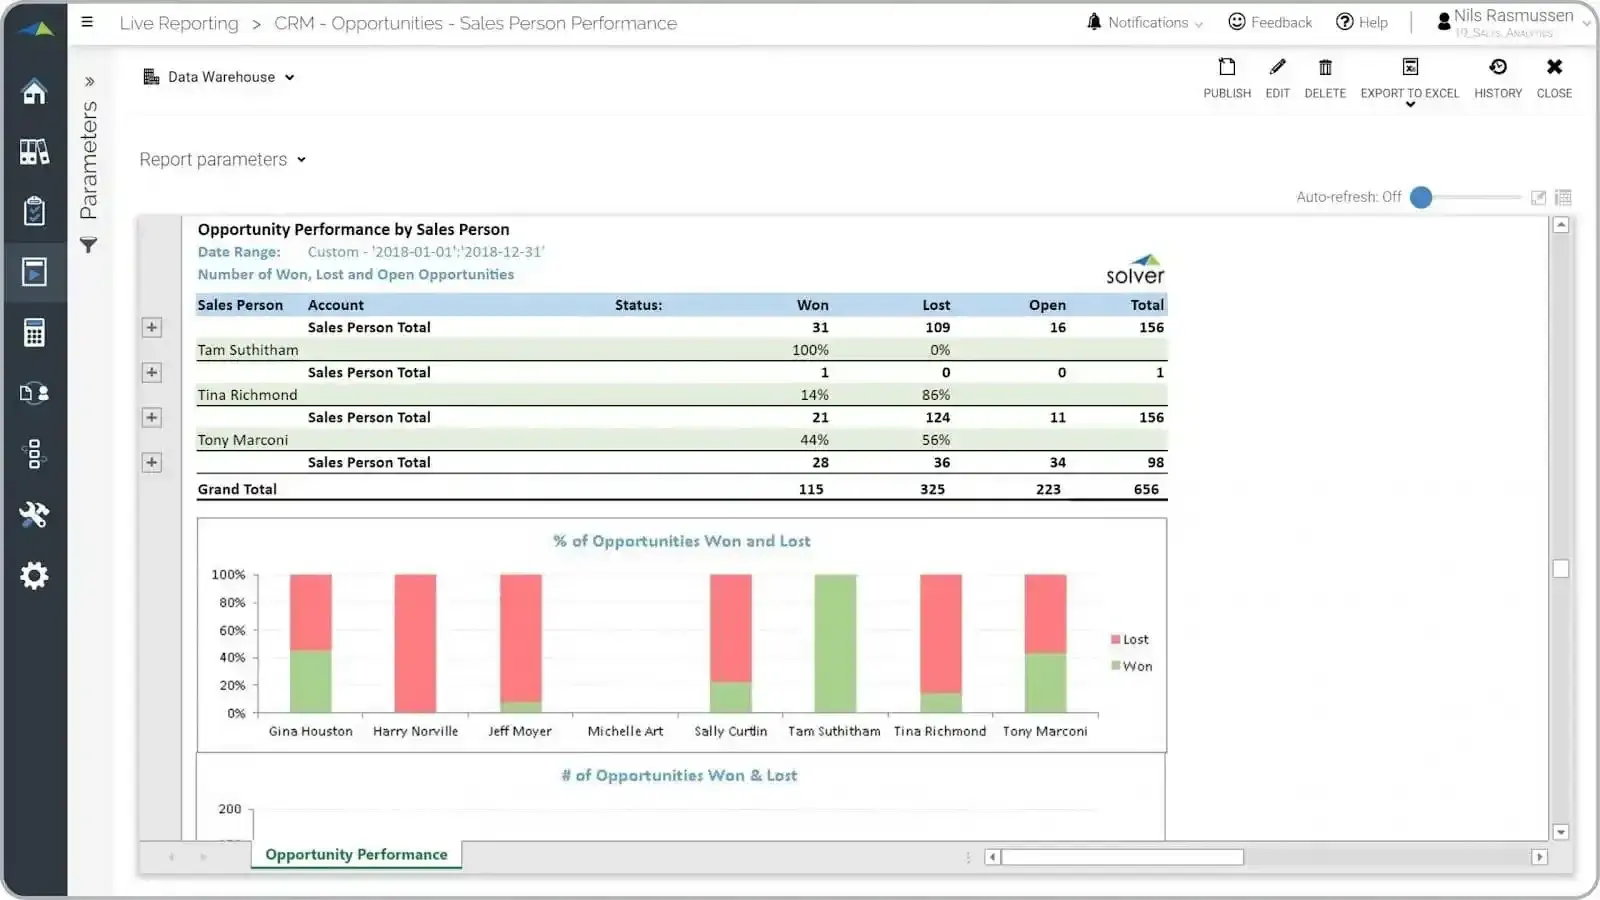
Best for: Evaluating performance against variables like company size, product type, sales reps, and sales teams.
7. Churned Customers Report
Every company will always experience customer churn. However, churn rates higher than your company or industry average can reveal larger problems.
There might be an issue with your pricing, service, product quality, product features, or delivery. You may also identify misalignment during the sales process or some other aspect of the customer experience.
If your report shows higher than normal churn, speak to your customers to understand their challenges and fix them. This can improve your customer retention rate and overall customer experience.
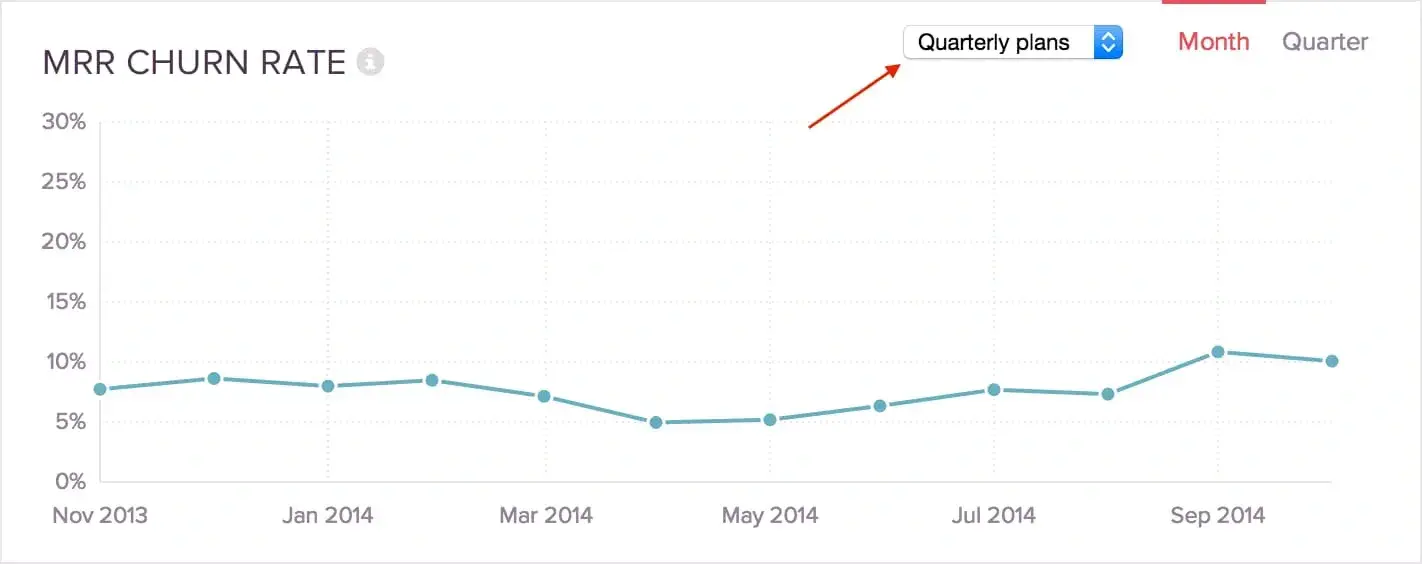
Best for: Closely monitoring trends in churned customers so you empower your team to fix bad patterns throughout the sales process.
8. Sales Call Report
One way to measure the effectiveness of your sales reps is to track the number of calls or visits they make to prospects. You can use this report to track and find gaps in your team's close rate.
Ideally, you want your reps to close a healthy number of deals compared to the number of prospects they meet with. If they meet with 10 per day but close none, this report will allow you to understand why and propose better closing techniques. If the opposite is true, you can find what’s working and share those tactics with the team.
I also think the sales call report is useful because it can help you segment data. For example, if a certain industry is responding well to your products and services, you could advise your team to narrow down their call list. You can then prioritize the highest converting segment.
Best for: Identifying the most effective tactics for closing deals, setting daily call benchmarks for new hires, and iterating on your sales closing techniques.
9. Lead Response Time Report
Regardless of the length of your sales cycle, lead response time should be relatively quick. Studies show contacting prospects within the first five minutes after they become a lead increases their likelihood of converting into an opportunity.
Five minutes is short, and if you’re far from meeting this time, the best thing to do is track your progress. You won’t move from a 48-hour lead response time to five minutes overnight. But by making strategic decisions and prioritizing your team’s workload, I know you can attain this goal.
Here’s how a lead response time report looks in HubSpot:
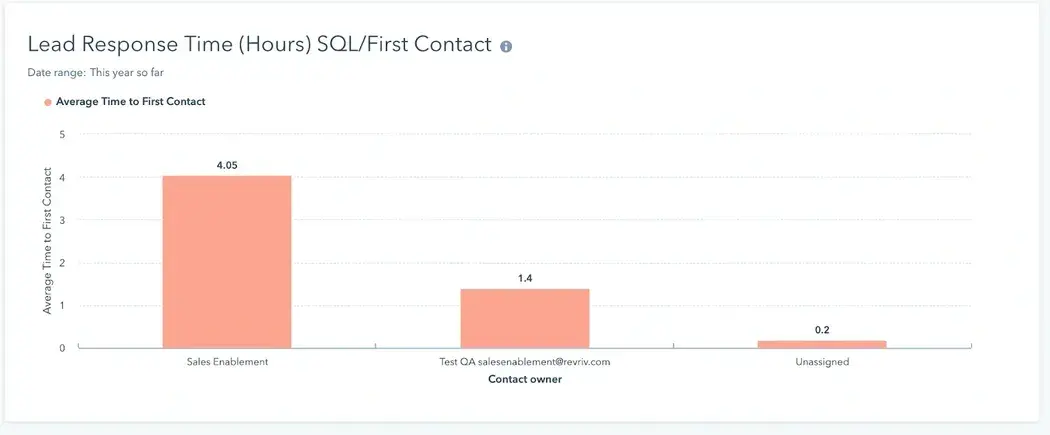
Best for: Measuring the average time it takes sales reps to follow up with a lead. Plus, you can compare this metric to industry benchmarks.
10. Revenue Report
As a nice complement to the average deal size report, a revenue report can help you and your reps see how their work impacts the bottom line.
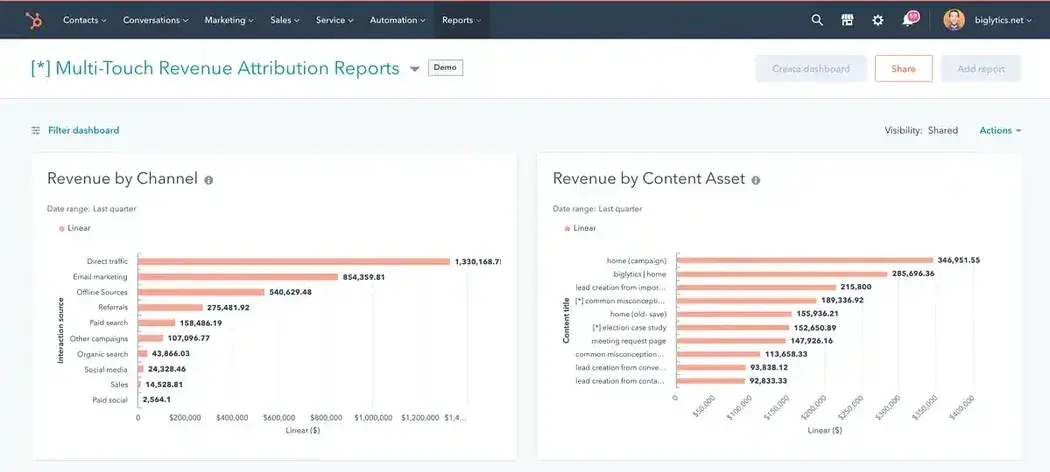
Best for: Seeing a breakdown of new business and renewals, as well as the reps who contributed to each. To get the most out of this report, you’ll want to first set your sales and revenue goals.
Sales Report Templates
Many sales teams focus on identifying potential clients and closing deals, leaving little time for detailed reporting. But I have good news for you: Your team can use several powerful templates to expedite your sales reporting.
Here are four sales reporting templates I recommend.
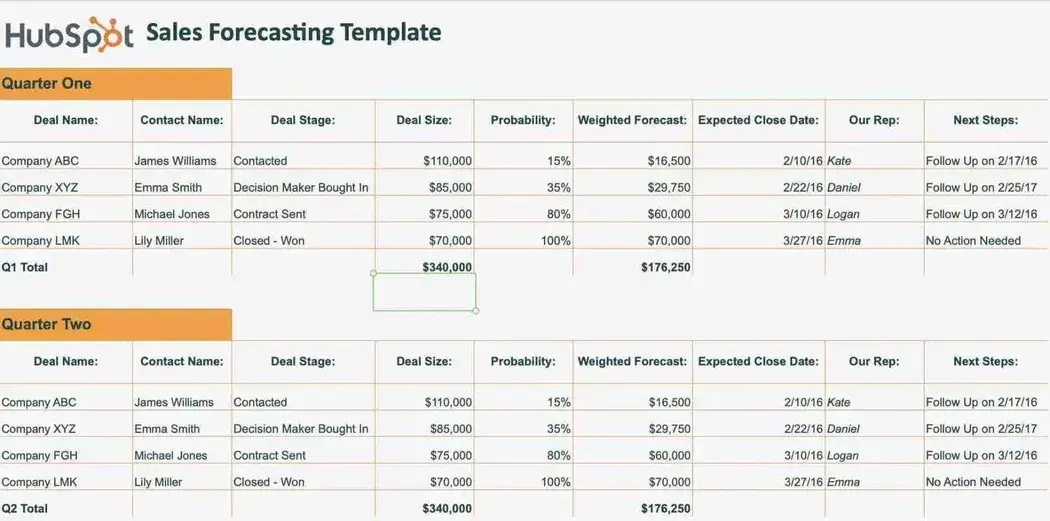
1. Forecasted vs. Actual Sales Report Template
A forecasted versus actual sales report can help your salespeople compare their progress against monthly and quarterly goals. These reports provide a quick way to analyze sales numbers and make adjustments as necessary.
For instance, this free sales report template from HubSpot allows you to track deals in your pipeline and know which ones to prioritize. That helps you hit your quota.
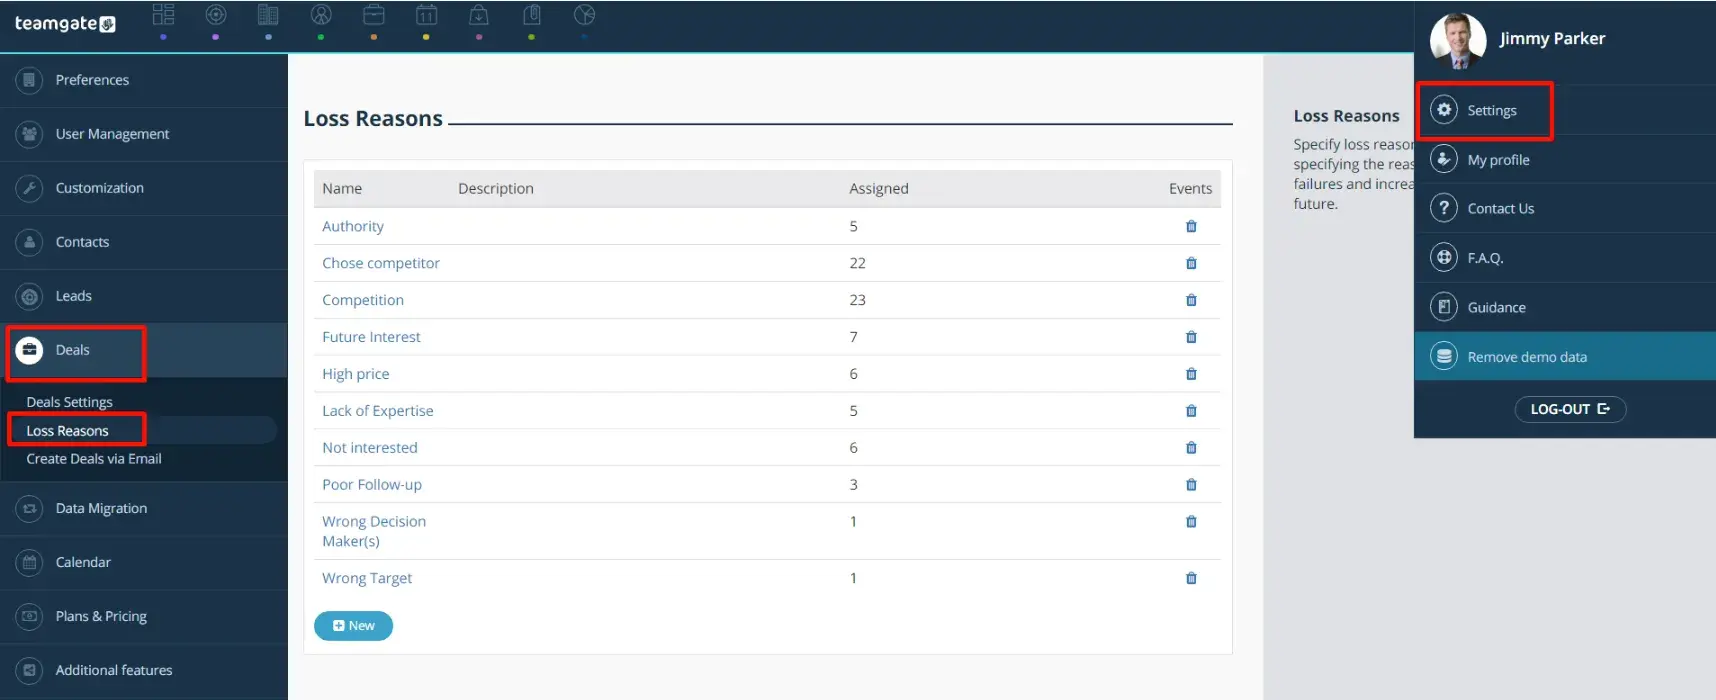
2. Reasons for Lost Deal Report Template
While every sales team strives to close as many deals as possible, some customers will inevitably say no. Understanding why your reps lose deals provides insight into why potential clients go elsewhere.
When creating this report template, I suggest adding a column or prompt to your current sales pipeline. This allows salespeople to choose why your team lost the deal. Here are a few reasons to include in your lost deal report:
- Pricing.
- Losing to a competitor.
- Not the right time.
- Lack of product features.
- Poor sales experience.
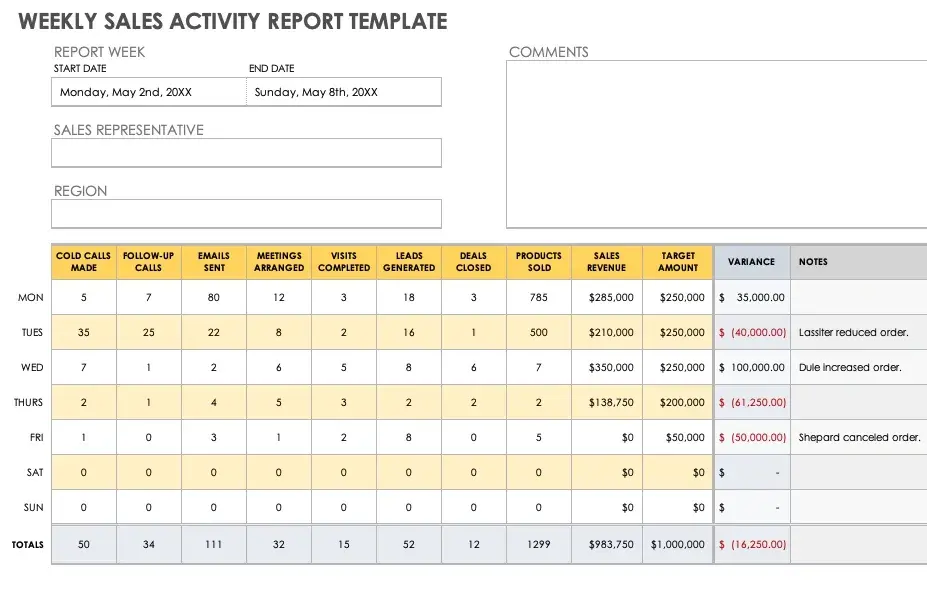
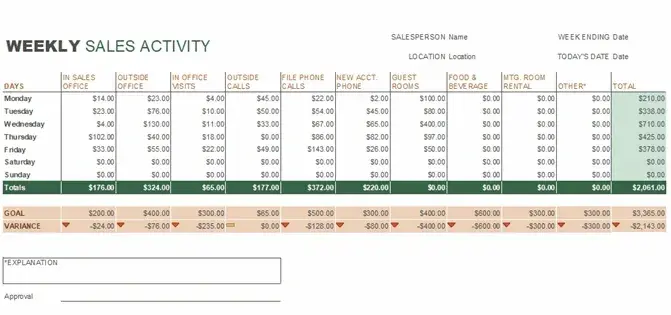
3. Overall Activity Report Template
For managers, having the ability to quickly view their team’s overall activity can be a great way to track productivity. It also provides information on key business development metrics, such as emails, prospect visits, and client calls.
I recommend customizing your report to include the metrics that matter most to your sales team. For instance, if your organization places a higher value on meeting prospects in person, you’ll want to include KPIs focused on visiting prospects.
4. Total Sales Report Template
Creating a custom total sales report dashboard allows your management team to quickly see how each salesperson is doing over a period. In my opinion, this information makes it easier to identify team members who outperform their peers and those who may need coaching.
Build Reports Your Sales Team Will Use
As a sales leader, I know you have a lot to keep track of. That’s where these sales reports shine. These documents provide critical insights into what’s working and what you could improve.
Here’s my key takeaway: Always track your customer and lead data. If you don’t, you'll miss out on reports that will undoubtedly help your business drive revenue growth.
Editor's note: This post was originally published in March 2016 and has been updated for comprehensiveness.
Free Sales Metrics Calculator
A free, interactive template to calculate your sales KPIs.
- Average Deal Size
- Customer Acquisition Cost (CAC)
- Customer Lifetime Value (CLV)
- And more!
Download Free
All fields are required.
Sales Reports
.jpg)