
I recently sat down with three top-tier social media experts and dove into HubSpot's State of Social Media report. Together, we explored how to develop a strategy that drives traffic and delivers real ROI to your brand.
We also pulled together the key trends shaping social media marketing today.
Table of Contents
- What is a social media strategy?
- Why You Need a Social Media Strategy
- How to Build a Social Media Strategy That Works
What is a social media strategy?
A social media strategy is an outline of the content your business will post, the responsibilities of your social media team, and the social media channels you'll use to promote your business. It includes social media goals that complement your business' overall digital marketing strategy.
In other words, a social media strategy is a structured approach to content creation, posting, and audience interaction. It involves:
- Defining brand voice and messaging.
- Selecting the most effective platforms for engagement.
- Setting measurable goals for audience growth and interaction.
- Implement a content calendar based on peak engagement times.
- Analyzing performance metrics to optimize strategy.
A social media strategy requires a comprehensive understanding of audience behavior, platform trends, and emerging digital tools.
Pro tip: If you want an easy way to track engagement metrics, audience growth, and more, I recommend trying HubSpot’s Marketing Analytics and Dashboard Software.

The State of Social Media in 2025
Explore the top trends in social media for brands to know and optimize your social strategy.
- AI Content Creation
- Community Building
- Social Media Shopping
- Social Vs. Search Engine
Download Free
All fields are required.
Why You Need a Social Media Strategy
Social media is more than a promotional tool; it is a core component of brand engagement, sales, and customer retention. Without a structured plan, businesses risk investing time and resources in content that fails to drive meaningful impact.
“One of the biggest challenges, I think, social media marketers face is saturation and competition. There's so much content on social media that sometimes it makes it challenging to stand out from the crowd.
“Having a robust strategy that understands the target audience includes strong copy and unique content can help to cut through the noise,” says Ellie Nash, social community executive at Kurago.
A strong strategy helps brands:
- Build authority.
- Engage audiences.
- Achieve measurable outcomes.
- Align messaging with customer preferences.
- Leverage technological advancements.
Brands without a defined strategy risk falling behind as consumer behaviors shift and platform algorithms change. This year alone, we’ve seen how digital marketing continues to evolve with AI’s growing role in marketing, AI-driven content, hyper-personalized advertising, and new engagement formats reshaping audience interactions.
How to Build a Social Media Strategy That Works
- Define your target audience.
- Incorporate ecommerce.
- Optimize your social channels for search.
- Focus on a few key social channels.
- Create engaging content tailored to each platform.
- Repurpose your content.
- Make a plan for customer service.
- Develop a posting schedule to guide you.
- Talk WITH, not AT, your followers.
- Measure your results.
- Adjust your tactics as needed.
1. Define your target audience.
If you haven’t already identified and documented your buyer personas, start by defining the key demographics of the audience you’re trying to reach — such as age, gender, occupation, income, hobbies, and interests.
To reach your audience without annoying them, you must first understand what they want and why.
What is their motivation?
Are social media users visiting these apps to learn, explore, shop, or just have a good time?
In our most recent State of Consumer Trends Survey, we asked over 500 general consumers to pick the three most common reasons they use social media.
While 65% actually use it socially to keep up with friends, 53% just want to be entertained and 50% want to learn new things. Unfortunately, 28% say they prefer to go on social media to learn about new products or brands.
The good news?
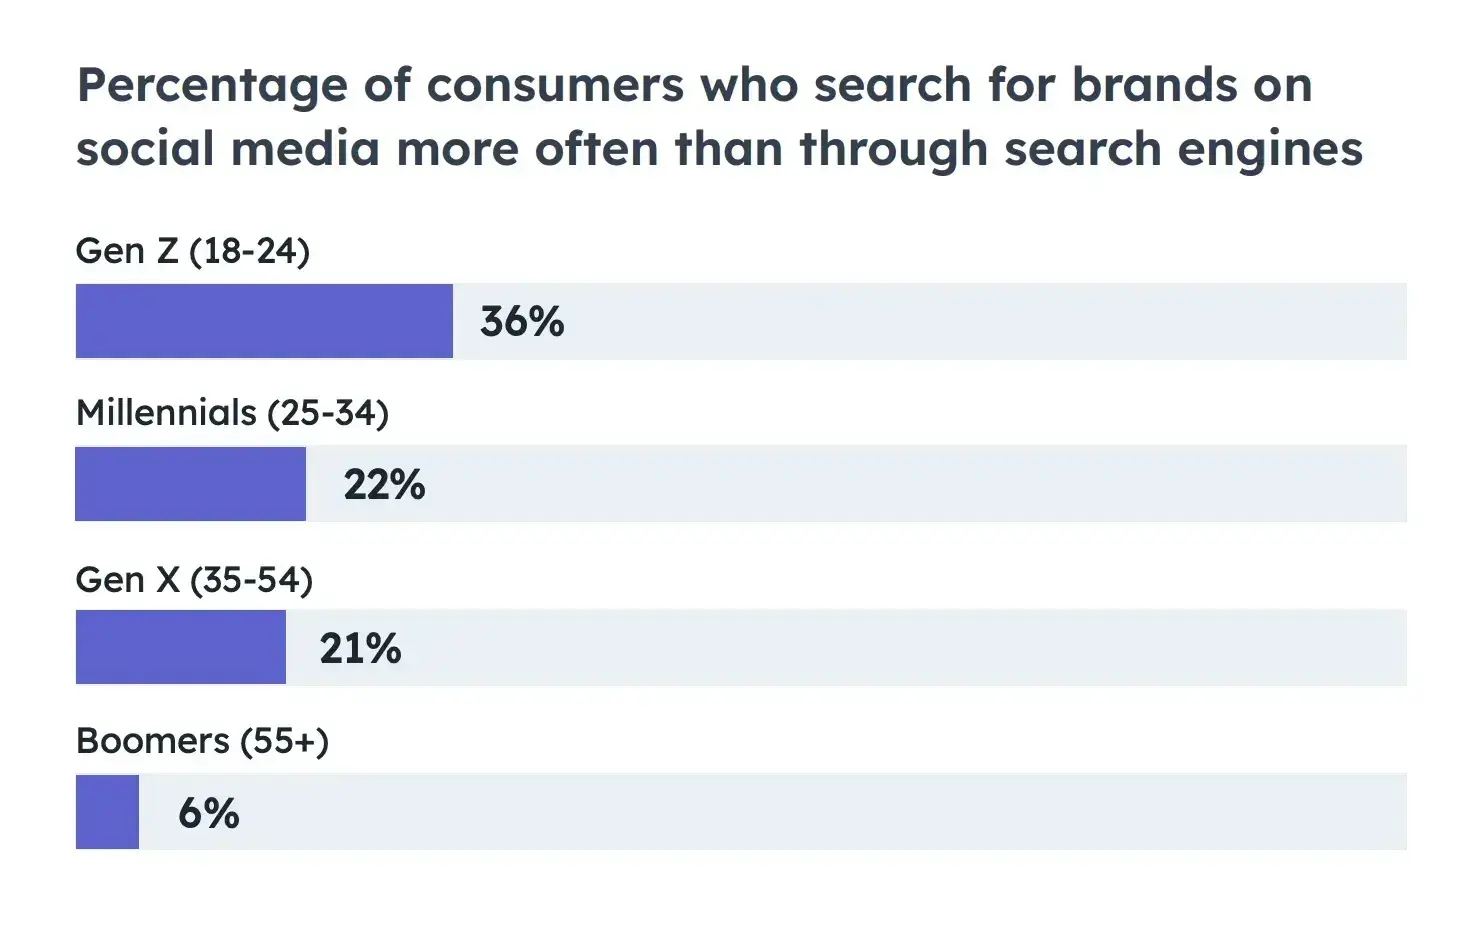
Later in the survey, when we asked consumers how they prefer to research and learn about brands and products, a whopping 41% said they like to do this on social media channels (a slight increase from a similar survey we ran six months prior).
While Gen X and Boomers skew lower on this average, Gen Z and Millennial generations are using social for brand research more often — which is not surprising due to their hyper-connectedness to the web.
As you might be able to tell from our data above, your target audience plays a role in how successful the right strategy will be. And better catering to them helps you create focused advertising that addresses your ideal consumer’s specific needs.
For instance, the sponsored post below by Monday.com, a project management platform, highlights the platform’s flexibility and workflow customization feature.
The post targets business owners and project managers who may feel limited by other project management software.

What does this mean for you?
Consider your ideal consumers’ challenges and what problems they're solving daily. Focus on no more than four types of people representing most of your buyers. Don’t get hung up on the exceptions or outliers, or you’ll never get started.
Once you start creating content for your audience, prioritize engaging your audience at every level.
Pay close attention to any questions or comments your audience posts. And be quick to address them, as that engagement could make or break a conversion or purchase.
Consumers like feeling like they’re part of a community when they’re on your social media pages. More than 1 in 5 social media users joined or participated in an online community in the last year.
Speaking of communities, creating social media groups is a smart move to attract, keep, and engage the audience, with 90% of marketers agreeing.
Here's why:
- Groups help people get involved.
- Followers can learn from each other.
- Your brand becomes a connector — something like a helpful friend.
- Communities feel like friendlier places to chat compared to pages.
Research from Sprout Social reveals that 60% of marketers refine their approach based on audience insights. Social listening tools help brands analyze trends and tailor content accordingly.
Pro tip: To reach the right audience, use social listening tools. These tools check social media for keywords, assess if the talk is positive or negative, and give you reports. I often use this info to create buyer personas for better targeting.
The State of Social Media in 2025
Explore the top trends in social media for brands to know and optimize your social strategy.
- AI Content Creation
- Community Building
- Social Media Shopping
- Social Vs. Search Engine
Download Free
All fields are required.
2. Incorporate ecommerce.
Social media isn’t just for discovering products anymore — it’s becoming a place to buy them, too. People love the convenience of shopping directly in the app where they first see something they like.
In fact, a quarter of social media marketers already say social shopping tools are more effective than traditional ecommerce sites. Looking ahead, 80% of them believe consumers will eventually shop more within apps than on brand websites or through third-party platforms.
If we look at how this trend is fairing across the globe, several other countries have already made social media shopping a norm.
For example, check out this comparison of data from the U.K., China, and the U.S.:
- In the U.K., social commerce was valued at $24.71 billion by 2023, it reached $31.27 billion in 2024. Forecasts indicate the market will grow to $83.27 billion by 2029.
- China leads the global social commerce market, with 90% of consumers making purchases through social media in 2023. Live streaming e-commerce is expected to grow to 8.16 trillion yuan by 2026.
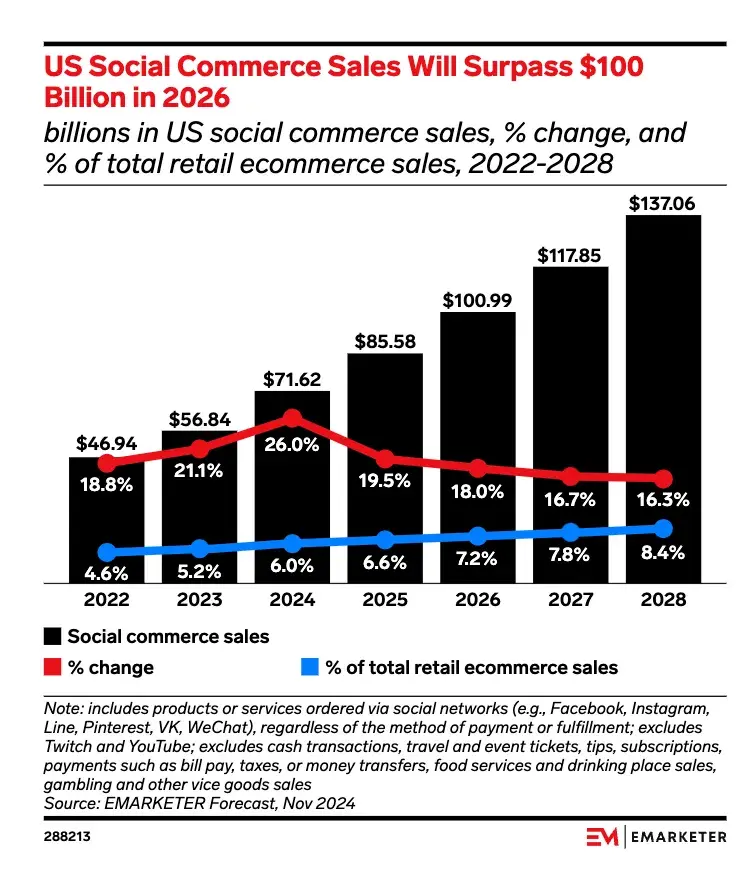
- In the U.S., social commerce sales are set to surpass $100 Billion in 2026, according to Emarketer.
So, what’s the takeaway?
If you sell products, social media should be a key part of your ecommerce strategy. It doesn't matter where you are. Social selling is a big deal — so it’s time to take it seriously.
Most platforms offer built-in ecommerce features like shoppable posts, and almost half (47%) of social media marketers are already selling directly within apps.
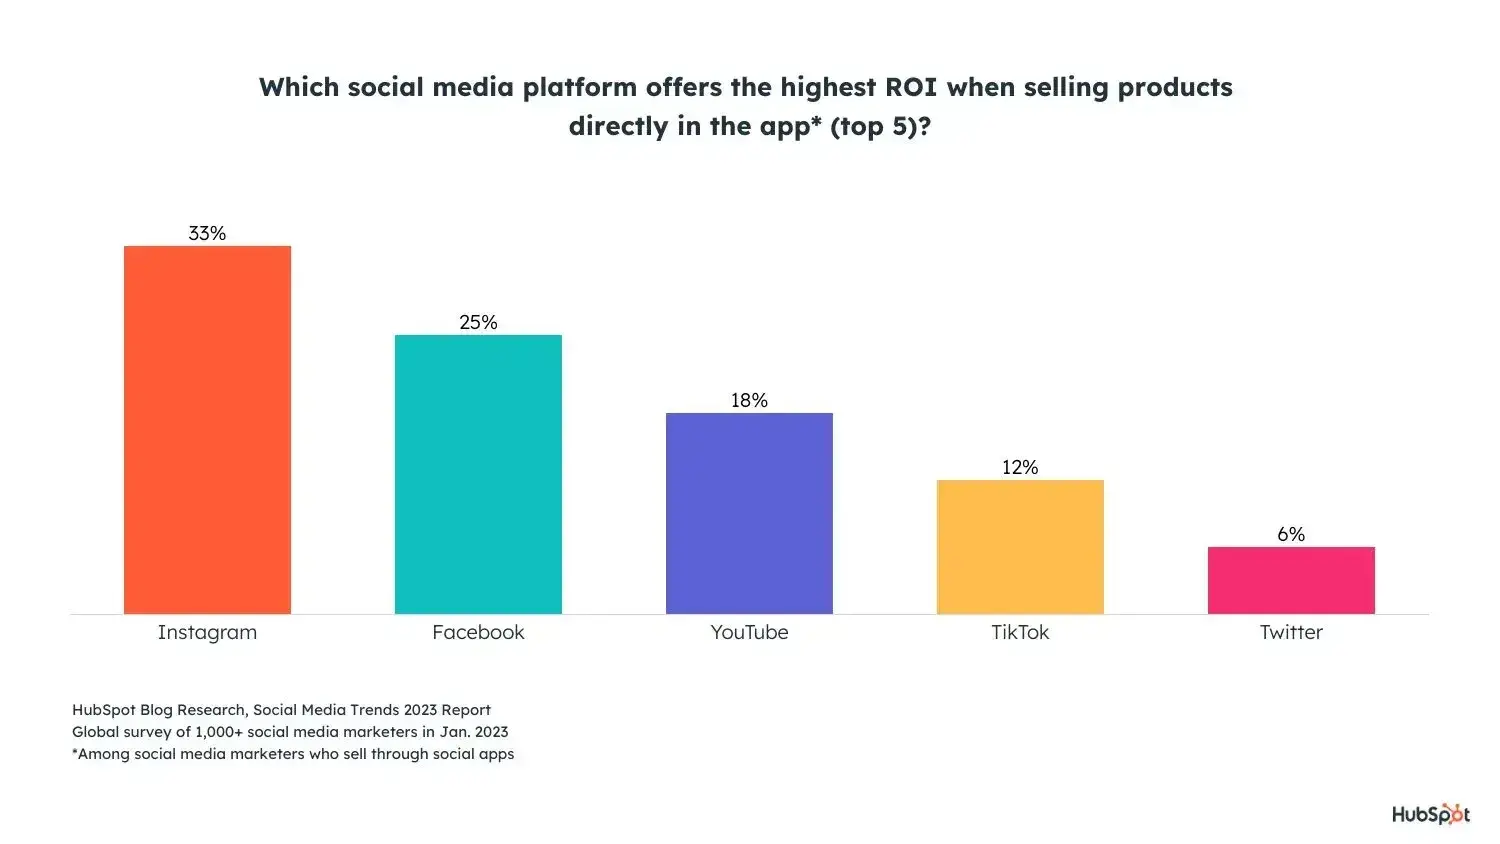
The most popular social selling tools for marketers are:
- Instagram Shops and Instagram Live Shopping (High ROI)
- Facebook Shops (Average ROI)
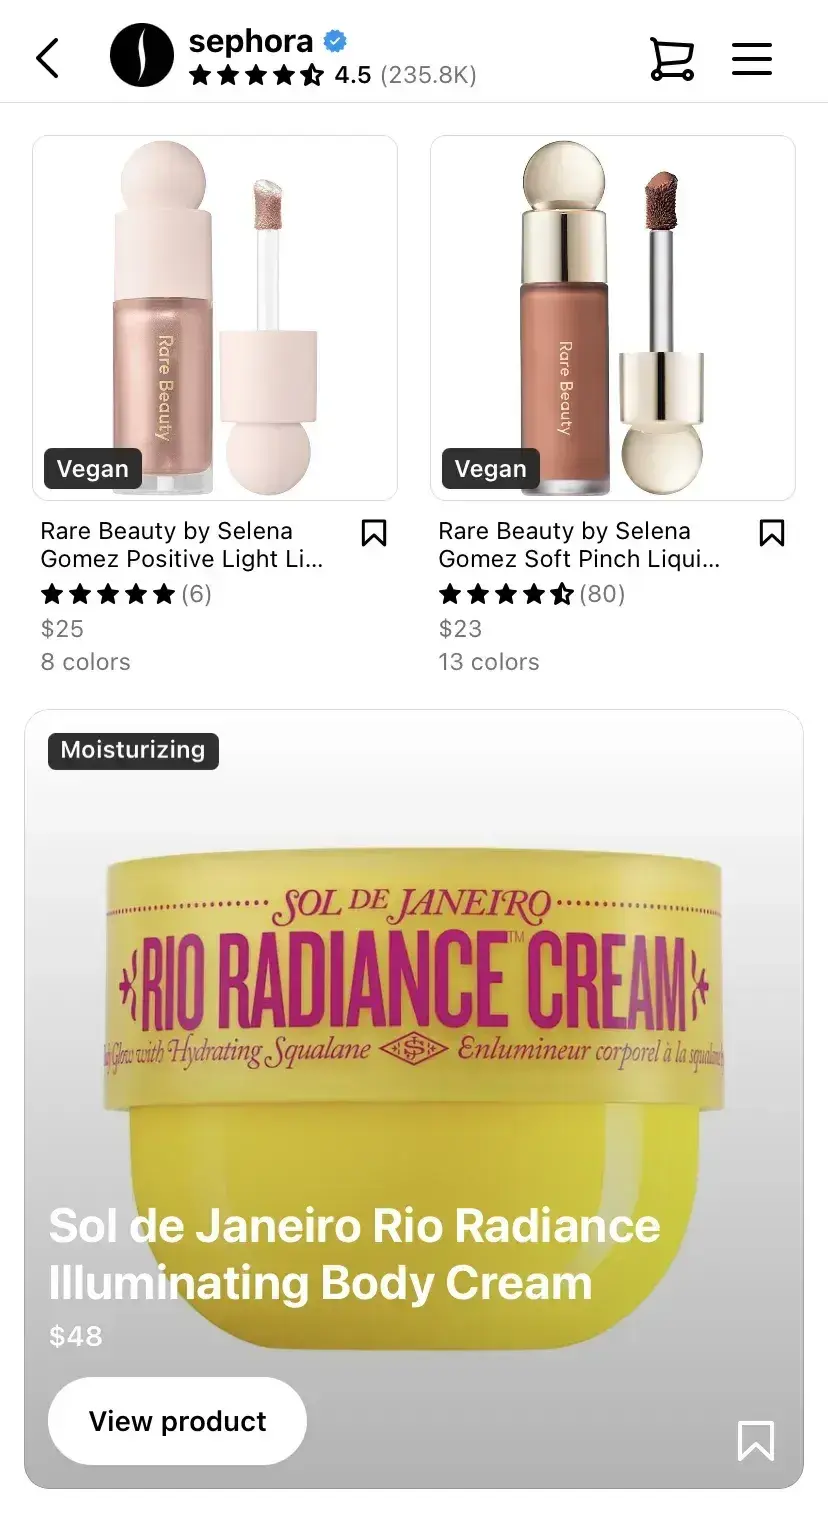
If you need inspiration for incorporating ecommerce into your social strategy, take a cue from Sephora.
Whenever the beauty brand posts a product image, it includes a product tag that links directly to its shoppable page. It’s seamless — followers can purchase without ever leaving the app.
The key to social selling success is trust. While Sephora has an established reputation, you can build trust by sharing customer reviews, user-generated content (UGC), and product info.
Pro tip: I recommend you go with image, video, and carousel ads for brand awareness to emphasize store visits, ad impressions, and engagement. For increased sales, select product, collection, or shopping ads to drive direct purchases and product page visits.
3. Optimize your social channels for search.
Social search is on the rise.
As more people turn to social media with their queries instead of search engines, 89% of social media marketers agree that social search is important to their overall social media strategies in 2023.
Nearly 24% of consumers aged 18-54 use social media first to search for brands.
For marketers, this means your social channels must be optimized for search. Prioritize social SEO if you want your social channels to show up in the results when your audience searches for your brand.
Similar to optimizing for search engines like Google, you can optimize your social presence.
Here's how:
- Include relevant keywords and hashtags in your posts and bio.
- Make sure your username is easy to search for.
- Keep your username consistent across accounts.
When adding alt-text, avoid stuffing keywords, says Annie-Mai Hodge, director and founder of Girl Power Marketing.
“This feature describes the image on a page for the visually impaired, so it’s important you describe the image accurately. In doing that, you’re providing extra context for the social platform too, which can, in turn, get your content more visibility in search results,” says Hodge.
Pro tip: You don’t need to film an hour-long video. Short-form video — think YouTube Shorts — can help you rank higher. Short-from video is also considered the future of lead generation.
4. Focus on a few key social channels.
Most small businesses or social teams don’t have the bandwidth to establish and sustain a quality social media presence on every single channel. And learning the ins and outs of each one? Totally overwhelming.
That’s why it makes sense to focus on the platforms that will bring the best ROI. For many brands, that’s Instagram.
Instagram continues to lead in engagement, ROI, and quality lead generation. In 2025, 58% of marketers cite Instagram as their top-performing platform for driving results, making it a priority for marketing investment.
Instagram Reels, in particular, remains a dominant force in user interaction, with short-form video driving higher engagement than static posts.
But don’t just jump into Instagram because I said so. Brands also need to be strategic about where they show up.
“The platform can say a lot about the brand itself. With more and more consumers being more in tune with how they spend their money and whether corporations' ideals align with theirs, this is becoming more of a consideration for brands in the long run,” says Tameka Bazile, senior social media manager at Elevate Labs.
If you want to create a strong social media strategy from scratch, start small.
If you're just starting out, don’t stretch yourself thin. Research where your target audience hangs out. For example, if you’re aiming for business professionals, LinkedIn might be a better fit than Instagram.
Bazile says brands should also consider the following when it comes to expanding across multiple platforms:
- Means. “Does their social team consist of enough members and get enough budget to successfully manage multiple accounts?” Bazile asks.
- Consumer access. “Are their ideal consumers found on the platforms they are seeking to expand to?” she says.
I recently read insightful expert perspectives on this LinkedIn article about picking the right social media platform.
Amidst all the chatter, Roel Timmermans' comment caught my attention:
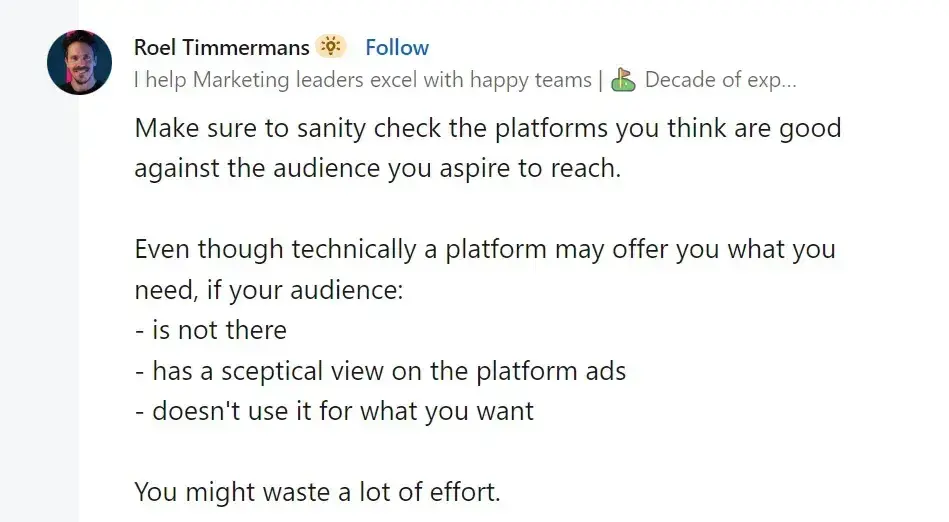
Or as Hodge says, “You don’t need to be on every single social media platform, full stop — for most businesses, it’s a waste of time and resources to be on platforms where your audience isn’t active.”
When creating your strategy, Hodge says, “You would’ve looked at where your audience is, what your competitors are doing, and what you’re aiming to achieve with social media — all of this will help inform you as to what social media channels you should be focusing on.”
Pro tip: Check where your competitors are most active and what kind of content they post. You’ll see what works or doesn't and how engaged their audience is. Don’t copy them — just use that info to make smart decisions for your strategy.
5. Create engaging content tailored to each platform.
As I mentioned, every social media platform has its own vibe.
The way people engage and the type of content they expect — it all varies. So, if you want your posts to land, you've got to adapt your content to fit each platform’s style and tone.
For example:
- LinkedIn is all about professional, insightful posts.
- Instagram is made for eye-catching visuals and quick messages.
- TikTok is all about creativity and riding trends.
- X loves snappy, real-time updates.
When you get it right, content tailored to the platform builds trust and boosts engagement.
Take Instagram, where you should focus on crisp images or short videos with punchy captions. On LinkedIn, you’ll want to lean into thought leadership and industry expertise. And for TikTok, it’s humor, challenges, or fun behind-the-scenes moments that humanize your brand.
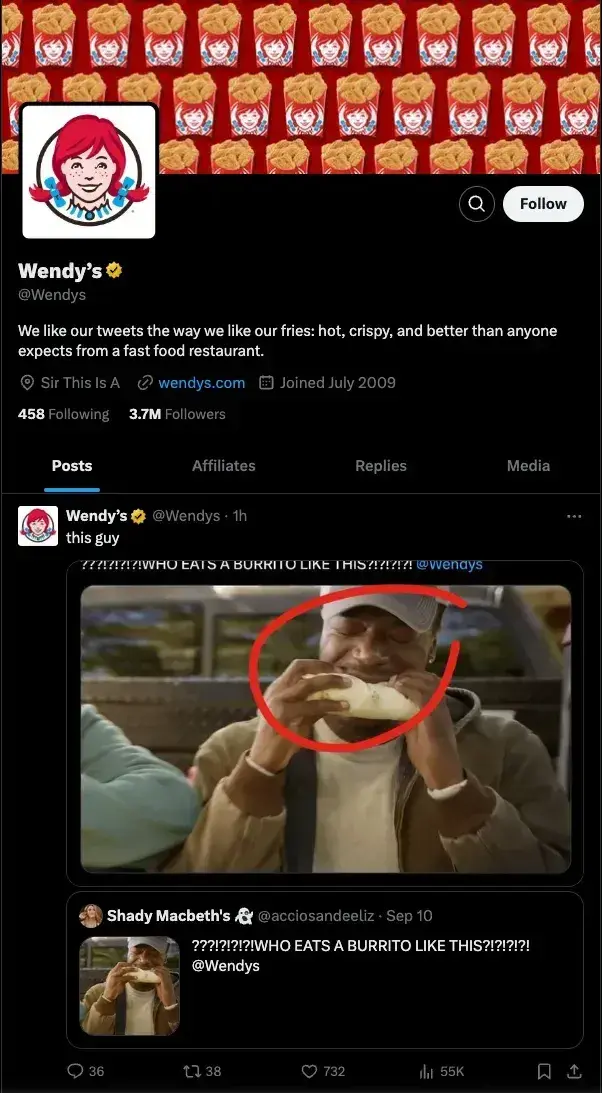
Wendy’s is a great example of this.
The brand's X game is sharp and sarcastic — perfect for the platform’s fast-paced nature.
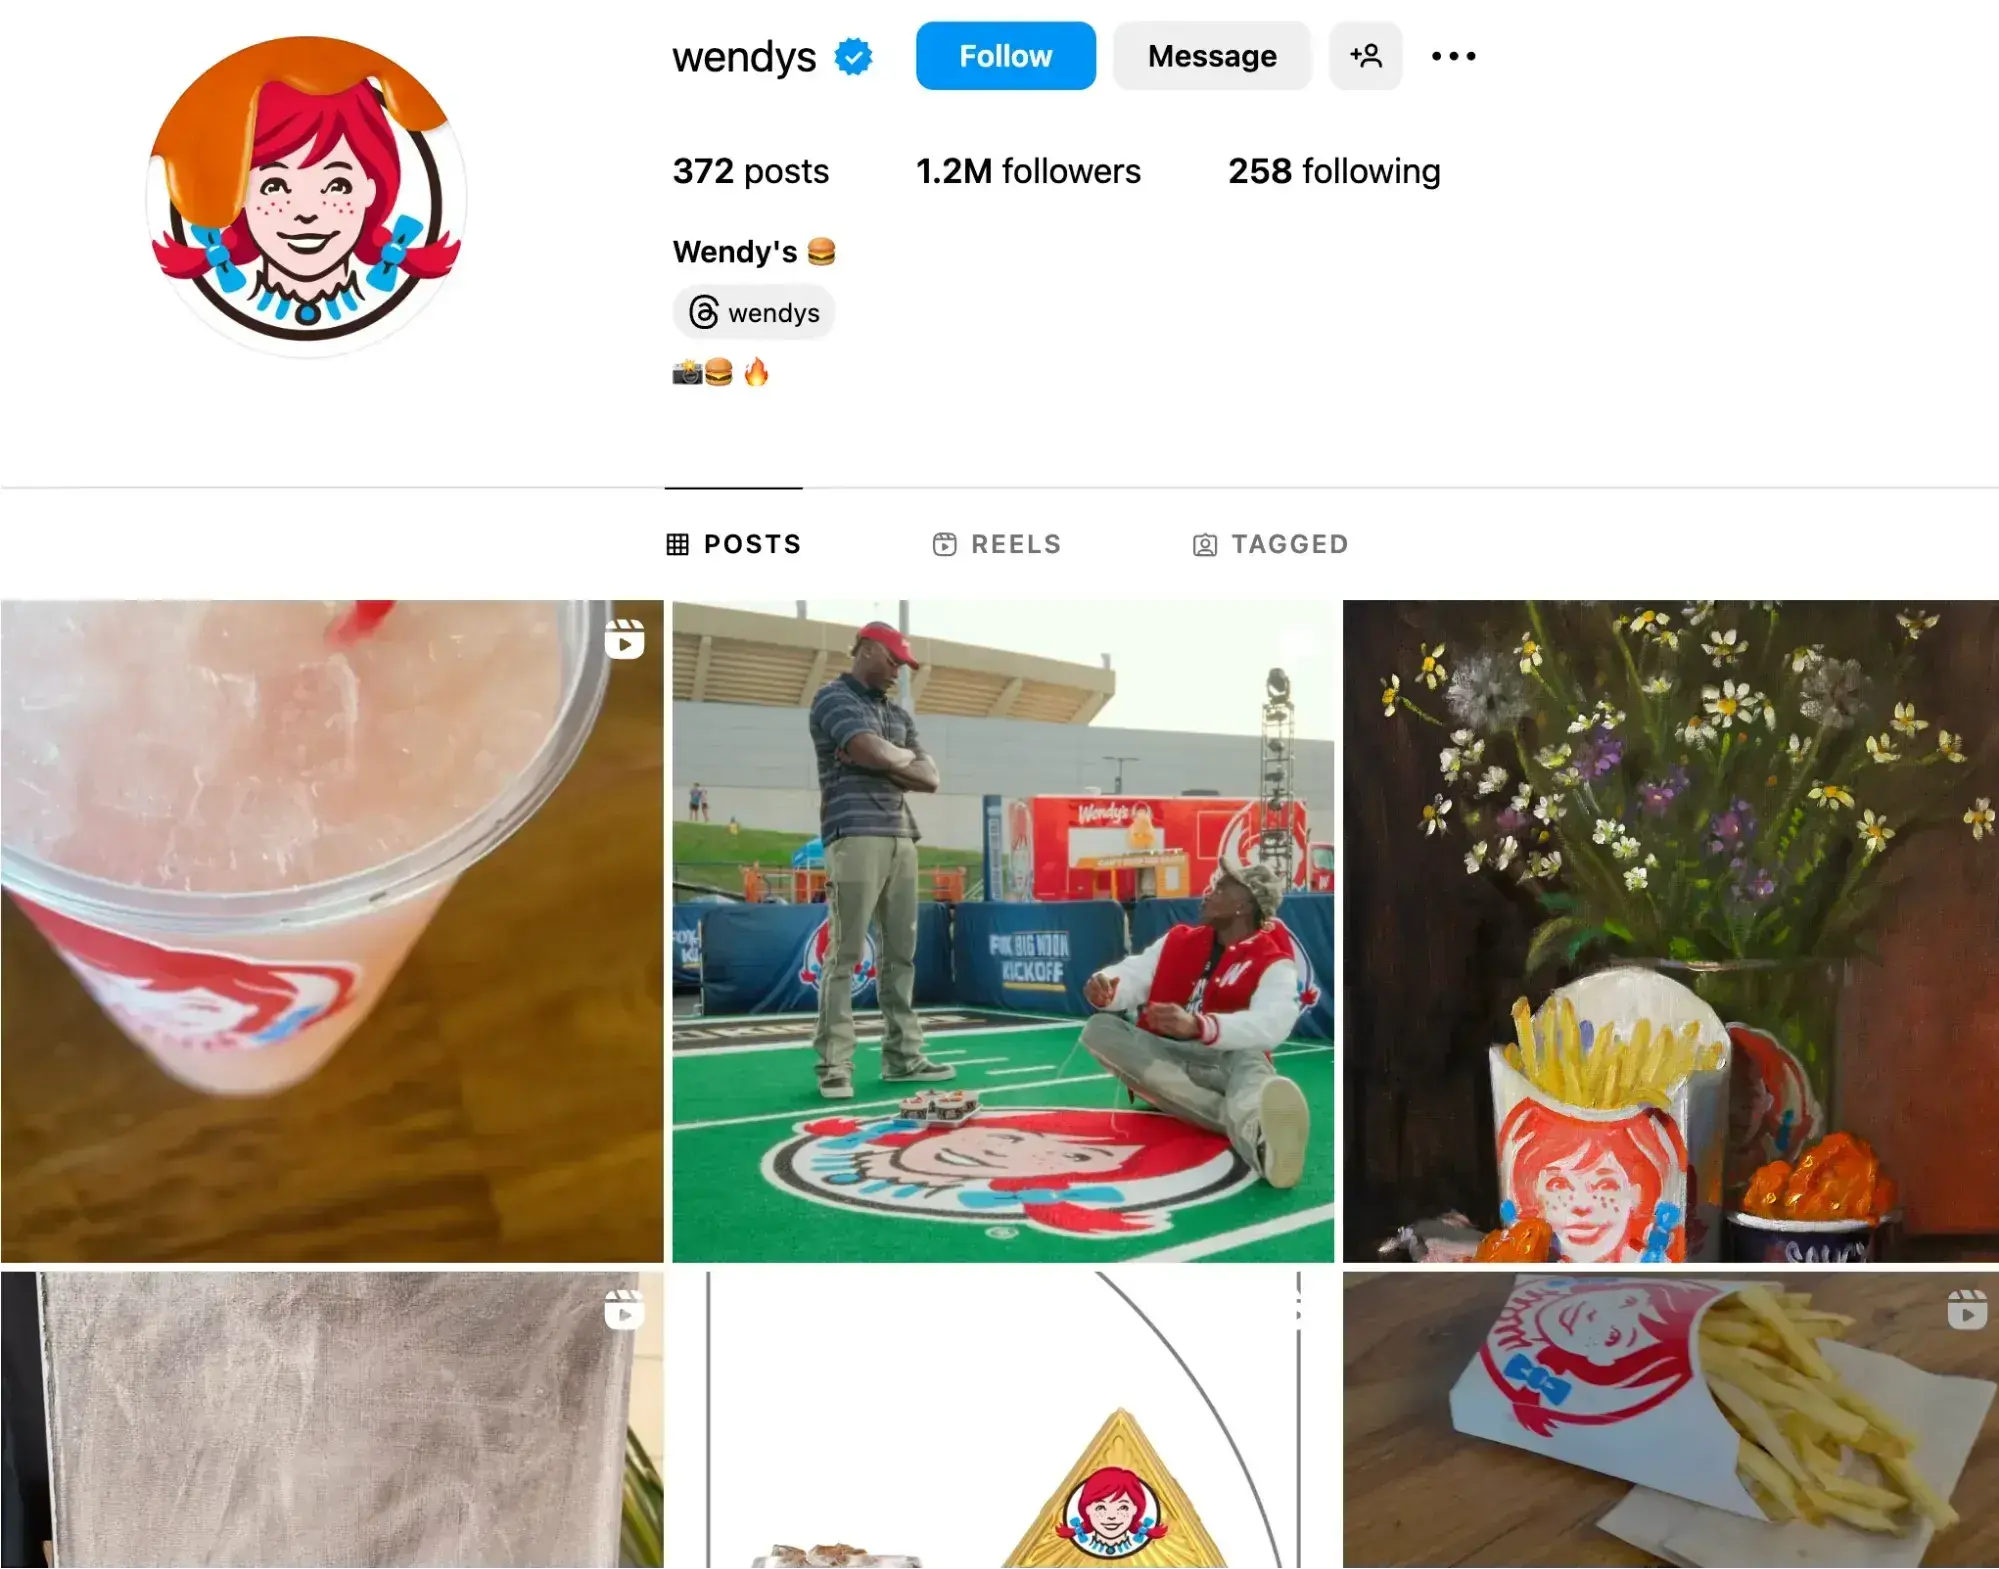
But on Instagram, Wendy switches gears with polished posts featuring new menu items and vibrant photography.
Pro tip: Instagram stories and TikTok challenges are perfect for casual, day-in-the-life content. Save the deep dives for YouTube and LinkedIn, where people are looking for more in-depth insights.
6. Repurpose your content.
Why stress over creating different content for each platform?
Keep it simple: repurpose and use the same awesome content in different places — within reason, of course.
According to our research, most marketers repurpose content in some way, shape, or form, while 17% consider it one of their key strategies.
This makes sense. By recycling content, you can:
- Get your message to more people on different platforms.
- Save time by using what you already have instead of starting from scratch.
- Stay visible on search engines by updating and reusing content.
- Cater to your audience's preferences with different formats.
- Make your content last longer by updating timeless pieces.
- Improve your strategy by checking how your content performs on different channels.
We at HubSpot love repurposing content — from simple LinkedIn posts like this …
… to hilarious TikTok video:
Although most marketers do it, only 7% told us it yields them substantial ROI compared to content that's more catered to platforms.
If you’re short on time or trying out a new platform similar to the one you already use, go ahead and make small tweaks to optimize content across channels. I’d say it’s worth experimenting with, as long as you’re delivering what your audience wants.
Just be careful not to spam them with the same content over and over again — that’s a quick way to lose their attention.
Pro tip: Stumped on a creative content idea that feels more personal than repurposed? HubSpot’s Content Remix tool uses AI to make it easy.
7. Make a plan for customer service.
When putting together your social media strategy, consider how you’ll use your channels for customer service.
Social media is so ingrained in our day-to-day lives, so it’s no surprise that people turn to these platforms for everything, from brand discovery to customer service.
According to our State of Social Media and Consumer Trends research, one in five social media users contact a brand through social DMs for customer service each quarter.
43% of marketers use customer service reps, 41% rely on platform managers, and 13% employ automated tools like chatbots.
Whether you create a separate account dedicated to customer service or have an auto-reply set up when people DM you on Instagram, have a plan for how you’ll handle it with this Free Social Media Customer Service Template.
Now, let’s talk a little bit about the importance of good customer service on social media.
According to Zendesk research:
- 73% of consumers will switch to a competitor after multiple bad experiences.
- 56% of consumers rarely complain about a negative customer experience- they quietly switch to a competitor instead.
- 3 in 4 consumers say a bad interaction with a business can ruin their day.
- Consumers will give companies 2.2 chances on average before switching to a competitor.
- 60% of consumers have purchased from a brand solely based on the service they expect to receive.
Pro tip: Apart from clearly stating working hours, let customers know the expected response time and inform them about quicker alternative resources if available.
The State of Social Media in 2025
Explore the top trends in social media for brands to know and optimize your social strategy.
- AI Content Creation
- Community Building
- Social Media Shopping
- Social Vs. Search Engine
Download Free
All fields are required.
8. Develop a posting schedule to guide you.
Social media isn’t an exact science, and it definitely doesn’t work the same for every business or industry. To make it work for you, I always advise people to create a clear posting schedule that helps your team stay consistent with content.
HubSpot offers some great social media tools and templates that help you plan your content and build a solid posting schedule and social media calendar.
One method I’ve found effective is from Tameka Bazile, who shared a neat way to categorize social media content.
Here’s how she categorizes it:
- Evergreen engagement content.
- Evergreen promotional content.
- Specific campaign content.
- Recurring communications content.
“Breaking down content into these buckets allows social teams to maintain regular presences online while also separating content data into easily trackable pieces,” she says.
Set realistic goals for how often you'll post and engage, and stick to the posting schedule you’ve created. It’s all about consistency.
Pro tip: Choose platforms that allow easy editing and content management within your team. This ensures smooth collaboration and calendar updates.
9. Talk WITH, not AT, your followers.
In our latest Consumer Trends research, 41% of consumers pointed to relatability as the most memorable aspect of posts from brands or companies on social or the web.
Friendly brands win more followers (and hearts). So, skip the self-promotion overload. Instead, get into conversations and respond to comments authentically.
People love it when you chat with them, not just throw information their way. It makes them feel special, creating a genuine affection for your brand.
And no, you don't have to sound super professional. Casual talk works even better on social media. Just take a cue from McDonald’s:

I personally can’t get enough of BMW and its fantastic relationship with fans and followers. They always try to respond to every comment on social media:

As of 2025, social media engagement rates for brand posts have experienced notable changes across various platforms.
- Facebook: 0.064% via rivaliq
- Instagram: 0.50% via social insider
- X: 0.021% via rivaliq
So, once you get a comment, find the right way to interact and show that you care. Don't just ghost and ignore. These comments boost your post higher in algorithms and make it more visible.
Pro tip: Never delete negative comments unless they’re super offensive or inappropriate. Instead, use them as an opportunity for constructive engagement and improvement.
10. Measure your results.
It’s hard to know what to focus on if you don’t have goals, a roadmap, or a clear brand strategy. You’ll end up lost in the noise of social media, unsure of what’s working or what to prioritize.
As Bazile says, “Without goals, a product roadmap, or even a full brand strategy, social media managers will struggle to know what to prioritize in the social space, what metrics to measure to convey progress, and what sort of content or social presence is ideal for the brand.”
There’s a lot you can track on social media with the right tools, but let’s not get overwhelmed.
- Start with the basics. For example, how much traffic are your social channels driving to your website or blog?
- Once you’ve got a handle on that, use tools like Facebook’s Page Insights, Instagram’s Account Insights, and LinkedIn’s Visitor Analytics to spot trends in engagement.
- Look for patterns around what topics or keywords get the most attention.
- Once you know what your average traffic and post performance look like, it’s time to set some goals.
- Choose metrics that are simple and easy to track — otherwise, you’ll lose motivation fast. Things like total interactions, traffic to your site, and social-driven revenue are a great place to start.
“One of the most valuable indicators, in my opinion, is impressions,” Nash says. “Impressions measure the number of times a piece of content is displayed on users' screens and help to evaluate the effectiveness of your content strategy in terms of exposure and brand awareness.”
Pro tip: Don’t only focus on platform numbers. Track the social sentiment as well. See if people express positive or negative feelings about you in online conversations. It takes a bit of manual work, but it's worth it. Check regularly for better insights.
11. Adjust your tactics as needed.
Social media won't start working overnight.
Establishing a following, stabilizing your brand, and seeing the results of your efforts take time. So, experiment to find the right combination of channels, content, and messaging that works for your audience.
We can pick up some cool tricks from Victoria's Secret in this regard.
The company has shifted from using only professional photos and videos to incorporating more casual content. Now, VS’s Insta feed also includes UGC and interviews with random people on the street and in their stores.
Victoria’s Secret proves that even as a high-end brand, you don’t lose anything by including everyday people.
Actually, you gain.

More followers. More engagement. More exposure.
Keep track of changes in your post views, audience demographics, and post interactions, and make changes as needed.
Over time, you can adjust your posting schedule, content, and personas based on the collected information, which will help you fine-tune your strategy and generate more consistent results.
I get it: trying new stuff might feel risky, but adapting is essential to staying relevant.
For instance, instead of relying solely on promotional content, brands should lean into formats that engage their audience.
In our 2025 survey of over a thousand global social media marketers:
- 35% said product demonstrations or tutorials drive the most engagement.
- 25% reported that behind-the-scenes content helps build stronger connections with their audience.
- 21% highlighted the impact of user-generated content.
These numbers show that audiences crave authenticity. Instead of just talking about your brand, showing the process, the people, and the community behind it can make a bigger impact.
Pro tip: Tailor your content to match seasonal trends and holidays. This helps keep your brand messaging timely and relatable. And most importantly — people love it.
Keeping Up With Social Media Strategies
The tips I’ve shared here will boost your ROI now, but make sure to stay prepared for the inevitable shifts as new tools, channels, and trends emerge.
To stay on top of things without feeling overwhelmed, I recommend following research like our State of Social Media report. You can also check out our blog for real, actionable insights on the trends and strategies you need to keep on your radar.
Editor's note: This post was originally published in February 2016 and has been updated for comprehensiveness.
The State of Social Media in 2025
Explore the top trends in social media for brands to know and optimize your social strategy.
- AI Content Creation
- Community Building
- Social Media Shopping
- Social Vs. Search Engine
Download Free
All fields are required.
Social Media Strategy
![The most effective types of content on social media in 2025 [new data]](https://53.fs1.hubspotusercontent-na1.net/hubfs/53/Copy%20of%20Featured%20Image%20Template%20Backgrounds%20(16).png)


-1.jpg)
.png)