

Successful companies measure every aspect of their go-to-market model, sales strategy, and sales team, but with so many sales metrics, how do you determine which numbers are truly relevant?
I've compiled this ultimate guide to sales metrics to help you identify the numbers you should be paying attention to.
What are sales metrics? Let's dive in.
Table of Contents
- What are sales metrics?
- Key Sales Metrics to Track
- Leading and Lagging Indicators in Sales
- SaaS Sales Metrics
- Sales KPIs by Team Type
- Sales KPI Template
What are sales metrics?
Sales metrics are data points that represent an individual's, team's, or company's performance. They help track progress toward goals, prepare for future growth, adjust sales compensation, award incentives, and identify any strategic issues.
Now, you might wonder how many sales metrics there are and which ones you should track.
Tracking the right metrics throughout each stage of the sales process is essential for effectively measuring the performance of your sales efforts. I dug through data from our 2024 State of Sales Report and found a list of key sales metrics that salespeople think are the most important to track.

.png)
Free Sales Metrics Calculator
A free, interactive template to calculate your sales KPIs.
- Average Deal Size
- Customer Acquisition Cost (CAC)
- Customer Lifetime Value (CLV)
- And more!
Download Free
All fields are required.
Key sales metrics to track
1. Total Revenue
Measures: Sales performance and effectiveness
Who this sales metric is helpful for: Sales managers+
Total revenue, also known as gross sales or turnover, is a crucial metric in evaluating your business's financial health and success. It is the entire income generated from all operational and sales activities across all products and services.
Calculate total revenue using:
Total revenue = Quantity of products and services sold x Price of the product or service
.png?width=690&height=220&name=sales%20metrics%20(1).png)
Suppose your company sells 100 units of its product for $10 per unit. Your total revenue would be $1000.
Why track it: Your business's total revenue objectively measures your ability to generate income. It helps monitor your progress and make informed decisions about enhancing profitability and optimizing sales operations.
Michele Potts, Director of Sales at Zoe Marketing and Communications, told me, "Tracking sales revenue helps you understand the direct outcome of your sales efforts. It allows you to gauge the effectiveness of your strategies and make informed decisions to drive growth.”
2. Percentage of Revenue From New Business
Measures: Sales performance and effectiveness
Who this sales metric is helpful for: Sales managers+
Our survey respondents told us that revenue from new vs. existing customers is the third-most important metric to track.
The percentage of revenue from new business is the monthly or quarterly revenue generated by new customers.
Calculate the percentage of revenue from a new business using this formula.
Percentage of revenue from new business = (Revenue from new customers / Total revenue) X 100

If your company generates $20,000 in revenue from new business and has total revenue of $100,000, it generates 20% of its revenue from new business.
Why I recommend tracking it: I recommend tracking the percentage of revenue from new businesses because it measures your company’s growth and success in acquiring new customers, and your ability to generate income from these new relationships.
3. Percentage of Revenue From Existing Customers
Measures: Sales performance and effectiveness
Who this sales metric is helpful for: Sales managers+
The percentage of revenue from existing customers is the income you generate from cross-selling and upselling, repeat orders, and expanded contracts.
Calculate the percentage of revenue from existing customers with this formula.
Percentage of revenue from existing customers = (Revenue from existing customers / Total revenue) * 100

If your company has total revenue of $100,000 and generated $20,000 in revenue from new business, it generated 80% of its total revenue from existing customers.
Why I recommend tracking it: Tracking revenue from existing customers helps you understand the success of your customer retention efforts, which is important because it’s more cost-effective than acquiring new customers: our survey respondents say it drives an average of 72% of their company revenue.
4. Conversion Rate
Measures: Sales performance and effectiveness
Who this sales metric is helpful for: Individual reps for personal performance (BDR, SDR, etc.), and sales managers+
Conversion rate is the percentage of leads that turn into customers. You can calculate conversion rate overall, or even get more granular with conversion rate by sales funnel stage.
Your conversion rates define your level of success. Higher numbers mean you’re well able to convert customers and can continue with your current process. If your conversion rates are lower, you have the opportunity to optimize your sales cycle to better target and speak to your leads.
Calculate conversion rate using this formula.
Conversion rate = (Total number of won deals / total number of opportunities) x 100

Why track it: “A deep focus on this metric allows us to identify not only the quality of the leads generated by our marketing efforts but also the efficiency of our sales processes. By analyzing our conversion rate, we can adjust our persuasion techniques, improve the training of our sales team, and refine our marketing messages to better resonate with our target audience,” says Jose Rodríguez Maldonado, CEO of Databay Solutions.
5. Cost of Selling
Measures: Sales performance and effectiveness
Who this sales metric is helpful for: Sales managers+
The cost of selling, also referred to as selling expenses or sales expense ratio, is the overall comparison of a sales activity's expenses to the revenue it generates. It’s helpful to measure it as a percentage.
Calculate sales expense ratio with this formula:
(Cost of sales) / (Total value of sales) x 100

Why I recommend tracking it: Understanding how much you spend throughout your selling process lets you know if you’re spending money in valuable ways. If you have a lower ratio, you’re effectively generating revenue. If you spend more money selling than you get as profit, you’re overspending to bring in customers and can benefit from revisiting your sales strategies and optimizing your process so nothing goes to waste.
6. Average Length of Sales Cycle
Measures: Sales performance and effectiveness
Who this sales metric is helpful for: Individual reps assessing personal performance, sales managers+ for team performance
The average sales cycle length refers to the time it takes for potential customers (leads) to go through the various stages of the sales process until they become a successfully closed deal.
Calculate the average length of sales cycle with this formula:
(Total number of days to close all deals) / (Total number of deals) = Average Sales Cycle

Why track it: Knowing how long it takes to convert a lead into a customer helps with forecasting, resource allocation, and planning. Chris Percival, Founder & Managing Director at CJPI, tells me, “Tracking the sales cycle more closely helped us to identify bottlenecks that extended our cycle and helped us refine our approach. We continue to streamline steps that are not improving the customer experience and are dragging deals out. We now close more deals faster, boosting our revenue and allowing for better forecasting.”
7. Market Penetration
Measures: Sales performance and effectiveness
Who this sales metric is helpful for: Sales managers+
Market penetration is your total customer base compared with the total market potential.
Calculate the market penetration rate using the following:
Market Penetration Rate= (Number of customers/Total Target Market Size) X 100
If your company sells its product to 500 customers with a target market of 1000 customers, your market penetration rate is 50%.
The higher the market penetration rate, the greater the opportunity for growth and revenue.
Why I recommend tracking it: Your market penetration rate will give you valuable insight into your market potential and help you develop strategies to increase your market share.
8. Win Rate
Measures: Sales performance and effectiveness,
Who this sales metric is helpful for: Any individual sales rep (BDR, SDR, etc.), and sales managers+ for team performance
Win rate refers to the proportion of successful deals out of the total number of opportunities. It can be evaluated at the team and individual levels, providing valuable insights into performance and effectiveness.
Calculate the win rate using this formula.
Win rate = (Number of won opportunities / Total number of opportunities) X 100

If your sales team had 100 sales opportunities for a particular product and closed 50 of them, the win rate is 50%.
Why track it: By tracking win rates based on product, market, target audience, and other factors, you can pinpoint the chances of success for each opportunity. This will enable you to strategically direct your resources toward those with the highest conversion potential.
Eugene Garla, Tech and recruiter lead at Index, shared an example with me about how you can use win rates to increase success. He said, “Understanding why you win or lose deals can help you make the right changes and sell more. For example, if a member of the sales team has a higher win rate than others, they can share tips on how they achieve that. It will help the overall team to increase their win rate and close more deals.”
9. Year-Over-Year Growth
Measures: Sales performance and effectiveness
Who this sales metric is helpful for: Account managers, sales managers+
Year-over-year (YoY) growth is the metric that compares revenue generated from year to year.
Calculate YoY Growth using:
YoY Growth = ((Current Year Revenue - Previous Year Revenue) / Previous Year Revenue) * 100

For example, if your company had revenue of $100,000 in 2021 and $120,000 in 2022, it had 20% YoY growth in revenue from 2021 to 2022.
You can also use this formula for any specific sales period. For example, if you wanted to see quarterly growth, you would simply do (current quarter metric - previous quarter metric)/ previous quarter metric * 100
Why I recommend tracking it: YoY growth is a valuable way to evaluate overall performance and success in growing your business and meeting your goals.
10. Revenue by Product or Service
Measures: Sales performance and effectiveness
Who this sales metric is helpful for: Individual reps, sales managers+
Revenue by product or service is the income generated by product or service. It’s vital for understanding the financial performance of different products and services.
The best way to track this is within your CRM since it’s typically automatically tracked.
Why I recommend tracking it: Tracking revenue by product or service lets you identify your most and least profitable offerings and optimize product mix to drive growth.
11. Average Customer Lifetime Value (CLV)
Measures: Sales performance and effectiveness
Who this sales metric is helpful for: Individual reps, sales managers+, marketing teams
The average customer lifetime value is a metric that measures the total revenue your business can anticipate generating from a single customer over the course of its relationship with your company.
CLV considers various factors such as customer behavior, purchase frequency, and average order value, providing valuable insights into each customer's value to the business.
To calculate CLTV, use the following formula.
Customer Lifetime Value = Customer Value x Average Customer Lifespan

Why track it: Tracking CLV helps you make informed decisions about acquisition and retention strategies, maximizing long-term profits and sustainable growth. When you know what type of customer spends the most, you can target that same persona with the rest of your marketing and sales strategies.
Zeeshan Khan, CEO of Dark Square, says that CLTV is the most important sales metric he tracks for his marketing and advertising agency. He says, “By meticulously tracking CLTV, we've been able to identify high-value customer segments and tailor our services accordingly. This has led to increased customer satisfaction, repeat business, and ultimately, higher revenue.”
He says the metric has also helped optimize marketing budgets by helping them focus on channels that deliver customers with the highest lifetime value.
12. Net Promoter Score (NPS)
Measures: Customer satisfaction
Who this sales metric is helpful for: Sales managers+, marketing teams, account managers
Net Promoter Score is a customer satisfaction and loyalty metric that measures how likely customers are to recommend your business to others.
To calculate NPS, you survey your customers and ask, “On a scale of 0 to 10, how likely are you to recommend us to a friend?”
You’ll then categorize respondents as detractors (0-6), passives (7-8), and promoters (9-10). Next, you subtract the percentage of detractors from the percentage of promoters.
Results range from 0 to 100, and higher scores mean customers are more satisfied and likely to recommend you to others.
Why I recommend tracking it: NPS helps you better understand your customers' experiences and take action to improve customer satisfaction. This, in turn, helps build strong and lasting relationships with your customers, increase customer retention, and drive long-term business growth.
13. Number of Deals Lost to Competition
Measures: Sales performance and effectiveness
Who this sales metric is helpful for: Sales managers+, business development reps, sales development reps
Number of deals lost to competition is the number of opportunities you failed to win due to competition from direct competitors.
Why I recommend tracking it: As companies risk losing up to 30% of their sales opportunities to competitors, it's vital to assess where your business lags and take action to enhance sales processes, marketing techniques, or product offerings. This will help you stay ahead of the competition.
Free Sales Metrics Calculator
A free, interactive template to calculate your sales KPIs.
- Average Deal Size
- Customer Acquisition Cost (CAC)
- Customer Lifetime Value (CLV)
- And more!
Download Free
All fields are required.
14. Weighted Value of Pipeline
Measures: Sales performance and effectiveness
Who this sales metric is helpful for: Sales managers, BDRs, SDRs
The weighted value of the pipeline metric shows the estimated value of deals as they move through the sales pipeline. You assign a value to each potential deal based on its position in the sales funnel and the likelihood of it closing.
Calculate the weighted value of the pipeline rate using the following:
Weighted value of pipeline = Probability of the deal closing x Deal value
Here, the probability depends on the stage of the pipeline. For example, the probability in the negotiation stage can be considered as 50%.
Why I recommend tracking it: A weighted pipeline provides accurate revenue projections and cash flow forecasting. It also highlights which stages of sales require the most attention. If you’re a HubSpot user, you can dive into your sales pipeline in the reporting feature.

15. Annual Contract Value (ACV)
Measures: Sales performance and effectiveness
Who this sales metric is helpful for: Sales managers+, SDRs, BDRs, account managers
Annual contract value refers to the amount of revenue a contract generates per year.
Calculate Annual contract value using:
Annual contract value = Total contract value / The number of years in the contract
If your company signs a five-year contract for $50,000, the Annual Contract Value is $10,000.
Why I recommend tracking it: Calculating ACV helps you identify accounts that generate the most revenue, which lets you know which accounts require strategic customer retention strategies and support.
16. Frequency/Volume of New Opportunities Added to the Pipeline
Measures: Sales performance and effectiveness
Who this sales metric is helpful for: Sales managers+, BDRs, SDRs
This metric refers to the rate and number of new sales leads or potential customers added to your sales pipeline.
Why track it: Tracking the number of new opportunities added to your pipeline helps you gain valuable insight into its overall health and the effectiveness of your sales and marketing strategies. The more new opportunities you have, the more deals you’ll likely close.
David Martirosian, Founder of David Martirosian, told me that tracking new leads or qualified appointments is the most important sales metric he tracks. He said, “From my experience, it’s very easy to start chasing old leads, pursuing lost deals, and even following up too much with clients. It's the path of least resistance, and it causes your pipeline to stagnate and fall apart…To me, tracking new leads will keep your business healthy and moving forward.
17. Average Lead Response Time
Measures: Sales activities
Who this sales metric is helpful for: Individual reps, sales managers+, SDRs, BDRs
Average lead response time is how long it takes salespeople to respond to a new sales lead. The faster the response, the more likely it is to turn that lead into a customer.
You calculate it by dividing the total time (minutes, hours, or days) spent responding to leads by the total number of contacts
Why I recommend tracking it: Tracking this information can reduce response time and increase lead conversion. About 50% of B2B sales go to the vendor who responds to a customer first; this highlights the importance of timely and efficient lead response.
17. Percentage of Leads Followed Up With
Measures: Sales activities
Who this sales metric is helpful for: Individual reps, sales managers+
The percentage of leads followed up refers to the ratio of the number of leads actively pursued and contacted by your sales representatives to the total number of leads generated.
Why I recommend tracking it: It is a metric used to measure your sales team's effectiveness in reaching out to potential customers and converting leads into paying customers.
18. Percentage of Leads Dropped
Measures: Sales activities
Who this sales metric is helpful for: Individual reps, sales managers+, BDRs, SDRs
The percentage of leads dropped refers to the ratio of the number of leads not pursued or contacted by your sales representatives to the total number of leads generated.
Why I recommend tracking it: This metric is crucial for understanding the quality of your leads. If you see a high drop-off rate, your leads are low-quality, and you need to change your marketing approach.
19. Percentage of Qualified Leads
Measures: Sales performance and effectiveness
Who this sales metric is helpful for: Individual reps, sales managers+
The percentage of qualified leads refers to the ratio of the number of leads that meet specific criteria and are deemed ready for the sales process to the total number of leads generated.
The higher the percentage of qualified leads, the more likely your sales team is to close deals and achieve their sales targets.
Why track it: Faton Sopa, Co-Founder & CEO of Superlinks, tells me that the most important metric at his company is qualified sales calls. He says sales teams start out focusing on quantity and monitoring open rate, interested leads, and booked calls, but that “None of these matter if the person who shows up in front of you on your call is unqualified. That is a loss of time, resources, and investment.”
Overall, this metric gives you insight into the efficiency of your company’s sales and marketing efforts in attracting and nurturing leads. It helps you measure your success and identify areas for improvement to generate higher-quality leads.
Featured Resource: Sales Metrics Calculator

Download the Template for Free
20. Email Open Rate
Measures: Sales performance and effectiveness
Who this sales metric is helpful for: Individual reps, BDRs, SDRs, sales managers+
Email open rate refers to the percentage of recipients who opened an email campaign out of the total number of emails sent.
Calculate email open rate using:
Email Open Rate = (Number of Unique Email Opens / (Number of Emails Sent - Number of Bounces)) X 100
For example, if you sent 1,000 emails, 200 were opened, and 200 got bounced, your email open rate would be 25%.
Why I recommend tracking it: This metric gives you a clear picture of your email marketing campaigns' performance and helps you improve future campaigns. Open rates average between 25% to 41%, so it’s essential to continuously track and optimize your sales emails to get better results.
21. Email Response Rate
Measures: Sales activities and sales effectiveness
Who this sales metric is helpful for: Individual reps, BDRs, SDRs, sales managers+
Email response rate refers to the percentage of recipients who respond to an email campaign.
Calculate email response rate using:
Email Response Rate = (Number of Responses / Number of Emails Sent) X 100
For example, if you sent out 100 emails and received 10 responses, your email response rate would be 10%.
Why I recommend tracking it: You can use the response rate to make data-driven decisions about future email campaigns, such as changing the email content, subject line, or sending time to improve response rates.
Free Sales Metrics Calculator
A free, interactive template to calculate your sales KPIs.
- Average Deal Size
- Customer Acquisition Cost (CAC)
- Customer Lifetime Value (CLV)
- And more!
Download Free
All fields are required.
22. Email Engagement Rate
Measures: Sales performance and effectiveness
Who this sales metric is helpful for: Individual reps, BDRs, SDRs, sales managers+
Email engagement rate is a metric that measures the level of interaction between recipients and an email. Unlike response rate, email engagement rate takes into account a range of actions that recipients may take with an email, such as opening it, link clicks, video plays, and so on.
Calculate email response rate using:
Email Engagement Rate = (Total Number of Engagements / Number of Emails Sent) X 100
For example, if you sent 100 emails and received a total of 200 engagements (e.g., 100 opens and 100 clicks), your email engagement rate would be 200%.
Why I recommend tracking it: Email engagement rate is a valuable metric for understanding how recipients interact with your emails and how you can improve your email campaigns going forward.
23. Total Revenue From Partner Deals
Measures: Sales performance and effectiveness
Who this sales metric is helpful for: BDRs, SDRs, account managers, sales managers+
Total revenue from partner deals is the amount earned from partnerships or collaborations with other companies.
This revenue is generated from agreements with other companies to offer products, services, or solutions to its customers. The partner company typically earns a commission or a percentage of total sales generated through channel sales.
Why I recommend tracking it: Knowing the total revenue generated from partner deals helps you plan your finances more effectively. You can use this information to set budget goals, allocate resources, and make informed decisions about pursuing more partnerships or expanding existing partnerships.
24. Revenue by Partner
Measures: Sales performance and effectiveness
Who this sales metric is helpful for: BDRs, SDRs, account managers, sales managers+
Revenue by partner refers to the amount of money your company earns from each partnership or collaboration. It provides a detailed view of the revenue generated from each partner, allowing you to understand which partnerships are the most profitable and valuable.
Why I recommend tracking it: By calculating revenue by partner, you can gain valuable insights into the performance of individual partnerships and make informed decisions about which partnerships to continue or discontinue.
25. Margin by Partner
Measures: Sales performance and effectiveness
Who this sales metric is helpful for: BDRs, SDRs, account managers, sales managers+
Margin by partner refers to your company's profit from each partnership or collaboration.
Why I recommend tracking it: It provides a detailed view of the profit generated from each partner, allowing you to understand which partnerships are the most profitable and have the highest margin.
26. Retention Rate of Partner Customers
Measures: Sales performance and effectiveness, customer satisfaction
Who this sales metric is helpful for: Individual reps, account managers, sales managers+
The retention rate of partner customers refers to the percentage of customers that continue to do business with your company after their initial transaction through a specific partner.
Why I recommend tracking it: Tracking retention rate measures customer loyalty from your partner customers. If a specific partnership has a higher percentage of customer churn, it signals that you should look to other types of businesses for future partnerships so you have a more qualified customer base that is less likely to churn.
27. Average Cross-sell and Upsell Rate of Partner Customers
Measures: Sales performance and effectiveness
Who this sales metric is helpful for: Individual reps, account managers, SDRs, sales managers+
The average cross-sell and upsell rate of partner customers refers to the average rate at which customers make additional purchases from a company through a specific partner.
Cross-selling refers to selling additional products or services to existing customers. In contrast, upselling encourages customers to purchase a higher-value or premium version of a product or service.
28. Average Customer Satisfaction Score of Partner Customers
Measures: Customer satisfaction
Who this sales metric is helpful for: BDRs, account managers, SDRs, sales managers+
The average customer satisfaction score of partner customers refers to the average rating or score customers give regarding their experience with a company through a specific partner.
The average customer satisfaction score of partner customers can be calculated by taking the average score from all customers who have transacted through a specific partner.
29. Percentage of Time Spent on Selling Activities
Measures: Sales activity
Who this sales metric is helpful for: Individual reps (including SDRs, BDRs, account managers), sales managers+
The percentage of time spent on selling activities refers to the amount of time your sales representatives spend engaging in activities that directly contribute to generating revenue, such as making sales calls, conducting product demonstrations, and closing deals.
Why I recommend tracking it: This metric tracks your sales team's efficiency, provides insights into your sales team's productivity, and identifies areas for improvement. What’s more, sales reps told us that sales productivity metrics (like CRM and sales tools usage, high-quality lead follow-ups, conversations, etc.) are the most important sales metrics to track.
30. Percentage of Time Spent on Manual Data Entry
Measures: Sales activity
Who this sales metric is helpful for: Individual reps (including SDRs, BDRs, account managers), sales managers+
The percentage of time spent on manual data entry refers to the time that employees or sales representatives spend manually entering data into a company's systems or databases.
This can include inputting customer information, updating sales records, and entering product information.
Why I recommend tracking it: If you find that you spend more time on manual data entry and similar tasks, it might be time to invest in sales tools that automate the process and give you time to focus on selling.
Regardless of your score, using a tool for manual data entry, especially an AI-powered tool, is a worthwhile investment. 43% of salespeople use AI tools that automate manual tasks (like data entry), and 63% say AI is highly effective.
31. Percentage of Marketing Collateral Used by Salespeople
Measures: Sales activity
Who this sales metric is helpful for: Individual reps (including SDRs, BDRs, account managers), sales managers+, marketing teams
The percentage of marketing collateral used by salespeople refers to how your sales representatives use various marketing materials, such as brochures, flyers, product sheets, presentations, and other promotional items, in their sales activities.
Why I recommend tracking it: This metric provides insight into the effectiveness of your sales team and the quality of the marketing materials produced.
32. Average Number of Sales Tools Used Daily
Measures: Sales activity
Who this sales metric is helpful for: Sales managers+
Average sales tool usage refers to how many resources your salespeople use to support their sales activities daily, such as software applications, CRMs, databases, presentations, and specific tools, such as LinkedIn Navigator, Datanyze, or Sales Hub.
Why I recommend tracking it: This metric can help your organization understand the level of technology adoption and utilization among their sales teams.
Free Sales Metrics Calculator
A free, interactive template to calculate your sales KPIs.
- Average Deal Size
- Customer Acquisition Cost (CAC)
- Customer Lifetime Value (CLV)
- And more!
Download Free
All fields are required.
33. Percentage of Sales Management Time Spent Recruiting
Measures: Sales activity and sales effectiveness (if compared to number of hires)
Who this sales metric is helpful for: Sales managers+
The percentage of sales management time spent recruiting refers to the amount of time your sales manager dedicates to finding, interviewing, and hiring new salespeople for their team.
This can include reviewing resumes, conducting interviews, participating in job fairs and networking events, and overseeing the onboarding process for new hires.
Why I recommend tracking it: Calculating the percentage of time spent recruiting can enable you to determine if the sales manager's recruitment efforts are efficient and productive.
34. Average Time-to-Hire
Measures: Sales activity and sales effectiveness (if compared to number of hires)
Who this sales metric is helpful for: Sales managers+
Average time-to-hire refers to the average time it takes to fill an open position, from when a job is posted to when a candidate is hired. It is a key metric that measures the efficiency and effectiveness of a company's recruitment process.
Why I recommend tracking it: Effective tracking of the average time-to-hire is critical in sales, where time-sensitive positions require prompt filling. Any delays can obstruct the sales team's success in reaching their targets and achieving their quotas. Moreover, a delay in the hiring process can result in losing top talent, as 55% of job seekers expect job offers to happen within two weeks of the initial interview.
35. Percentage of Hires From Various Sources
Measures: Sales activity
Who this sales metric is helpful for: Sales managers+
The percentage of hires from various sources is a metric that measures the proportion of new hires that come from different recruitment channels.
Why I recommend tracking it: By tracking this metric, organizations can determine which channels deliver the best results in attracting high-quality candidates and allocate resources accordingly to optimize recruitment.
36. Average Turnover Rate
Measures: Sales activity
Who this sales metric is helpful for: Sales managers+
The Average Turnover Rate is a metric that measures the rate at which employees leave your organization.
Why I recommend tracking it: Tracking the average turnover rate is vital to prevent high employee turnover. It helps you identify turnover trends and root causes, enabling you to take proactive steps for better employee retention and build a stable, effective sales team.
37. Average Cost to Replace a Salesperson by Role
Measures: Sales activity
Who this sales metric is helpful for: Sales managers+
The average cost to replace a salesperson by role measures how much it costs to replace a salesperson after they leave. This includes the cost of recruitment, advertising, hiring, training, and lost productivity associated with replacing an employee.
Why I recommend tracking it: By tracking the average cost to replace a salesperson by role, you can identify the financial impact of high turnover and make decisions about employee retention accordingly.
38. Sales Ramp
Measures: Sales activity
Who this sales metric is helpful for: Sales managers+
Sales ramp-up time represents the average time a new salesperson takes to become fully productive. You can use it to make hiring and firing decisions, set expectations with new reps, and develop more accurate sales forecasts.
There are multiple ways to calculate it. CRMs often automatically calculate the meantime to 100% quota attainment, which you can use to set the ramp. For instance, if it typically takes a salesperson four months to hit 100% quota, your ramp-up time would be four months.
Although this method is fairly simple, it ignores that new sales reps often take over existing accounts or prospects, giving them a head start. In addition, a salesperson who hits 98% of their quota is likely fully ramped, but this formula wouldn’t count them as such until they hit 100%.
Alternatively, Ideal CEO Somen Mondal has developed a formula that factors in training, the length of your sales cycle, and prior experience.
Ramp-up = amount of time spent in training + average sales cycle length + X
X is based on the salesperson’s experience: The more they have, the smaller this number is.
Here’s an example for a well-seasoned rep, assuming training lasts 20 days and your average sales cycle is six weeks.
Ramp = 20 days + 42 days + 16 days
This salesperson would receive 78 days to reach full productivity.
39. Percentage of Reps Following the Sales Process
Measures: Sales activity and sales effectiveness (if compared to other success metrics)
Who this sales metric is helpful for: Sales managers+
The percentage of reps following the sales process refers to the proportion of your sales representatives who consistently adhere to the established steps or stages of the sales process. It is a metric used to track the effectiveness and efficiency of your sales team and the sales process itself.
Why I recommend tracking it: Tracking the percentage of reps following the sales process ensures that all reps follow the same method, resulting in a more consistent sales experience for the customer.
40. Average Level of Satisfaction With Sales Training
Measures: Sales activity
Who this sales metric is helpful for: Sales managers+
The average level of satisfaction with sales training refers to the degree to which your sales representatives are satisfied with the training they receive.
Why I recommend tracking it: It is a metric used to measure sales training programs' effectiveness and identify areas for improvement. Additionally, tracking this metric can help your organization determine whether its investment is paying off.
Now, let’s look at how to make sense of your raw data with leading and lagging indicators.
Leading and Lagging Indicators in Sales
Leading and lagging indicators are used in sales to predict and look at final results.
Leading Indicators
A leading indicator predicts your results. In other words, it tells you which direction you're trending with enough time to change the outcome. Leading indicators can be more challenging to measure than lagging indicators, but they’re easier to influence.
Lagging Indicators
A lagging indicator reflects your ultimate results.
They're reactive, not proactive. For instance, a lagging indicator might be your team's quota attainment at the end of the month. After seeing the lagging indicators, creating or revisiting your sales plan can help you improve your results in the future.
Free Sales Metrics Calculator
A free, interactive template to calculate your sales KPIs.
- Average Deal Size
- Customer Acquisition Cost (CAC)
- Customer Lifetime Value (CLV)
- And more!
Download Free
All fields are required.
SaaS Sales Metrics
Software as a service (SaaS) is a software distribution model that provides customers with access to applications on the internet instead of requiring physical media and custom installation.
SaaS and subscription businesses require different metrics. As David Skok, general partner at Matrix Partners, explains:
“SaaS and other recurring revenue businesses are different because the revenue for the service comes over an extended period of time (the customer lifetime). If a customer is happy with the service, they will stick around for a long time, and the profit that can be made from that customer will increase considerably. On the other hand, if a customer is unhappy, they will churn quickly, and the business will likely lose money on the investment that they made to acquire that customer."
Rather than solely focusing on acquiring the customer (the "first sale"), Skok explains you must also focus on keeping them (the "second sale").
Key SaaS Sales KPIs to Track
- Customer Acquisition Cost
- Cost Per Acquisition
- Customer Lifetime Value (LTV)
- Average Revenue Per User or Account
- Monthly Recurring Revenue (MRR)
- Annual Recurring Revenue
- Churn Rate
- Revenue Churn
- Negative Churn

1. Customer Acquisition Cost
Measures: Sales performance and effectiveness
Who this sales metric is helpful for: BDRs, SDRs, sales managers+
Customer acquisition cost (CAC) is the average amount of sales and marketing expenses required to acquire one new customer.
Here are some potential components of your CAC:
- Inbound marketing (blogging, SEO, social media)
- Sales and business development
- Paid advertising
- Events and trade shows
To calculate CAC, divide the total amount you spent on sales and marketing in a given period by the number of customers you acquired in that same period.
(Cost of sales + cost of marketing) / Number of new customers = customer acquisition cost

For example, if you spent $1,000 in one month and acquired 50 customers, your CAC would be 20.
This formula is easy to follow, and the result of your equation lets you know if any aspects of your acquisition strategy need optimizing so you’re not spending more than you bring in.
HubSpot's former VP of Growth Brian Balfour explains that it can only be accurate if your prospects become customers extremely quickly or your marketing and sales expenses are static (which is unlikely).
If you measure CAC by month, but it takes your typical prospect two months to buy after the first marketing touchpoint, your results can be misleading. Perhaps you start a new marketing campaign in January — its impact on CAC won't be visible until February. If this sounds like your situation, Balfour recommends using the following formula:
CAC = (Marketing Expenses (n-60) + 1/2 Sales (n-30) + ½ Sales (n)) / New Customers (n), where n= Current Month
The cost of acquiring new customers for merchants has risen dramatically in recent years, with a 222% increase over the past eight years. To stay ahead of the trend, it's crucial to continuously monitor your Customer Acquisition Costs and implement strategies to minimize them.
2. Cost Per Acquisition
Measures: Sales performance and effectiveness
Who this sales metric is helpful for: BDRs, SDRs, sales managers+
Balfour also points out people commonly conflate "Customer Acquisition Cost" with "Cost Per Acquisition" — but the two are different, and this mistake can be expensive.
CPA represents how much money you need to spend to acquire a non-customer, like a lead, a free trial, a registration, or a user.
This means CPA and CAC are related: Your CPA is a leading indicator of your CAC.
For example, if you offer a freemium version of your software product, your CPA would measure the cost of acquiring a free user. Your CAC would measure the cost of acquiring a paid user.
It's calculated by dividing advertising spend by the number of acquisitions generated.
Cost Per Acquisition = Advertising spend / Acquisitions generated

SaaS companies must know how many months it takes to recover CAC and the amount they invested in getting a new customer.
Not only does this metric help you manage cash flow, but it also tells you how long you need to retain a customer to break even.
Let's say your CAC is $200, and your Average Revenue Per User or Account (ARPU/ARPA) is $400. Your gross margin is 95%.
Months to recover CAC = CAC divided by (ARPA x GM)
In this example, you'd break even in approximately two weeks.
3. Customer Lifetime Value (LTV)
Measures: Sales performance and effectiveness
Who this sales metric is helpful for: Account managers, sales managers+
Customer lifetime value (LTV) is the average amount of money your company makes from an individual buyer for however long they stay a customer (i.e., X months or years).
LTV tells you whether you're spending too much or too little on acquiring customers. The optimal LTV:CAC ratio is 3:1. In other words, if it takes a dollar to get a prospect to buy your product, they'll spend $3 over their time as a customer.
Segment your customers, then look at the average LTV. The findings will tell you where to focus your energy and/or change your strategy. For example, if Tier X of accounts has a 1.5:1 LTV:CAC ratio, while Tier Y has a 4:1 ratio, you'd probably want to:
- Decrease your marketing and sales expenses for Tier X and increase them for Tier Y.
- Figure out why Tier X customers are less profitable — are they churning earlier, buying less, and/or purchasing fewer add-ons?
4. Average Revenue Per User or Account
Measures: Sales performance and effectiveness
Who this sales metric is helpful for: Account managers, sales managers+
Average Revenue Per User or Account (ARPU/ARPA) is the mean amount of revenue from a single user or customer. Companies typically calculate it per month or year, depending on their business model.
If you offer monthly contracts, calculate it per month; if most of your contracts are annual, calculate it per year. This is the standard ARPU formula I recommend using:
ARPU = Revenue during set period / Number of active users/accounts during set period

5. Monthly Recurring Revenue (MRR)
Monthly Recurring Revenue (MRR) tracks the total predictable revenue your company expects to make each month. It's one of the most important sales metrics for SaaS businesses, since it reflects growth and helps you forecast future revenue.
How to Calculate MRR
There are two ways to calculate MRR.
- Add up the monthly revenue you're bringing in from each customer for the total MRR.
- Multiply ARPA/ARPU by your number of paying customers.
The first method takes longer but is also more accurate. If Customer X is paying $200 per month, and Customer Y is paying $400 per month, your MRR would be $600.
The second method is easier. If you have four customers, and your ARPA is $150, your MRR would be $600. This is the formula to use for yourself:
MRR = Average Revenue Per Account/User x Total Accounts That Month
Make sure you're not including one-time payments in your MRR, like implementation and/or limited support fees.
Be careful about quarterly, semi-annual, and annual plans as well. Let's say a new customer signs a $1,200 year-long contract in December.
If you tally up your MRR on a customer-by-customer basis that month, you might incorrectly add $1,200. But you're not generating $1,200 from this account each month — you're generating $100.
To include these subscription values in your MRR, divide them by four, six, or twelve if they're quarterly, semi-annual, or yearly, respectively.
There are different types of monthly recurring revenues you can calculate: new MRR, expansion MRR, and churn MRR.
New MRR
New MRR refers to revenue from new customers. Suppose you acquired one customer paying $50 monthly and a second customer paying $45 monthly. Your new MRR would equal $95 per month.
New MRR Formula = New MRR + Expansion MRR - Churned MRR
Expansion MRR
Expansion MRR is revenue generated from existing customers, including cross-sells (buying complementary products or services), upgrades/upsells (a more expensive plan), and greater volume (buying more seats, usage data, transactions, etc.)
Expansion MRR is considered the "holy grail" of MRR. Why? It's commonly known that retaining an existing customer is 5 to 25 times less expensive than acquiring a new one. Plus, customers are far less likely to churn when they've invested more into your suite over time.
Churn MRR
Churn MRR is the revenue you've lost from customers who have downgraded their plans or canceled altogether. It's a leading indicator of next month's MRR. For example, if two customers each paying $400 canceled in June, your MRR would be $800 lower in July.
Free Sales Metrics Calculator
A free, interactive template to calculate your sales KPIs.
- Average Deal Size
- Customer Acquisition Cost (CAC)
- Customer Lifetime Value (CLV)
- And more!
Download Free
All fields are required.
6. Annual Recurring Revenue
Measures: Sales performance and effectiveness
Who this sales metric is helpful for: Sales managers+
Annual recurring revenue is your MRR multiplied by 12 or the recurring revenue you'll generate in a calendar year.
It has a significant advantage over MRR. Because salespeople typically sell more during longer months (like March, August, and December) and sell less during shorter months (like February, June, and April), your predicted MRR might be off from month to month.
Since ARR applies to the entire year, monthly variance has no impact.
Should You Focus on MRR or ARR?
The short answer is that you should focus on both. While MRR tells you how your business is doing monthly, ARR gives you a yearly picture.
Your priority should depend on your company's maturity and business model. If you're generating more than $10 million every year, think in terms of ARR. A shorter-term lens is more helpful if you're generating less than that.
7. Churn Rate in SaaS
Measures: Sales performance and effectiveness
Who this sales metric is helpful for: Account managers, BDRs, SDRs, sales managers+
Your churn rate is the percentage of customers who cancel their recurring subscriptions. You can calculate per month, quarter, or year, depending on your most common contract type.
The formula for churn rate is:
(# of customers lost in a given time period) / # total customers at the beginning of a given time period
Imagine the majority of your customers are on semi-annual plans. In January, you have 400 customers. In June, you have 500 customers.
Your churn rate equals: -100 / 500, or -20%. You're gaining more customers than you're losing.
8. Revenue Churn
Measures: Sales performance and effectiveness
Who this sales metric is helpful for: Sales managers+
Churn is never ideal.
However, revenue churn is different from customer churn. Revenue churn is the amount of revenue you've lost (a.k.a. churn MRR), while customer churn is the number of customers you've lost.
From a business standpoint, it's probably preferable to lose three customers, each paying $40 per month, than one customer paying $300 per month.
9. Negative Churn
Negative churn is a term popularized by Skok that means your expansion MRR exceeds your churn MRR. If you can achieve negative churn, your business will grow exponentially.
Measures: Sales performance and effectiveness
Who this sales metric is helpful for: Sales managers+
Negative churn is a term popularized by Skok, and it means that your expansion MRR exceeds your churn MRR. If you can achieve negative churn, your business will grow exponentially.
Sales KPIs by Team Type
You can also look at sales KPIs by the type of team you have. Inside sales, field sales, and sales development have different metrics to measure.
Inside Sales KPIs
Inside sales teams rely on these KPIs (from most frequently used to least):
- Number of deals closed.
- Opportunities by stage.
- Calls.
- Meetings.
- Significant interactions or events (for example, ROI meetings or conversations lasting four-plus minutes).
- Opportunities created.
- Demos.
- Quotes/proposals.
- Emails.
- Meetings scheduled.
Free Sales Metrics Calculator
A free, interactive template to calculate your sales KPIs.
- Average Deal Size
- Customer Acquisition Cost (CAC)
- Customer Lifetime Value (CLV)
- And more!
Download Free
All fields are required.
Field Sales KPIs
Outside sales teams use many of the same metrics as inside sales teams but prioritize meetings more heavily.
- Meetings
- Number of deals closed
- Opportunities created
- Opportunities by stage
- Quotes/proposals
- Significant interactions or events
- Calls
- Demos
- Emails
Sales Development Metrics
Companies use these sales development metrics to benchmark their SDR team’s efficiency and ability to grow their pipeline.
- Meetings
- Calls
- Opportunities created
- Significant interactions or events
- Opportunities by stage
- Number of deals closed (by their partner Account Executive)
- Demos
- Emails
- Meetings scheduled
I’ve covered a lot of metrics so far — luckily, you don’t have to keep track of them manually. A sales metrics dashboard can compile these insights in an easy-to-scan format.
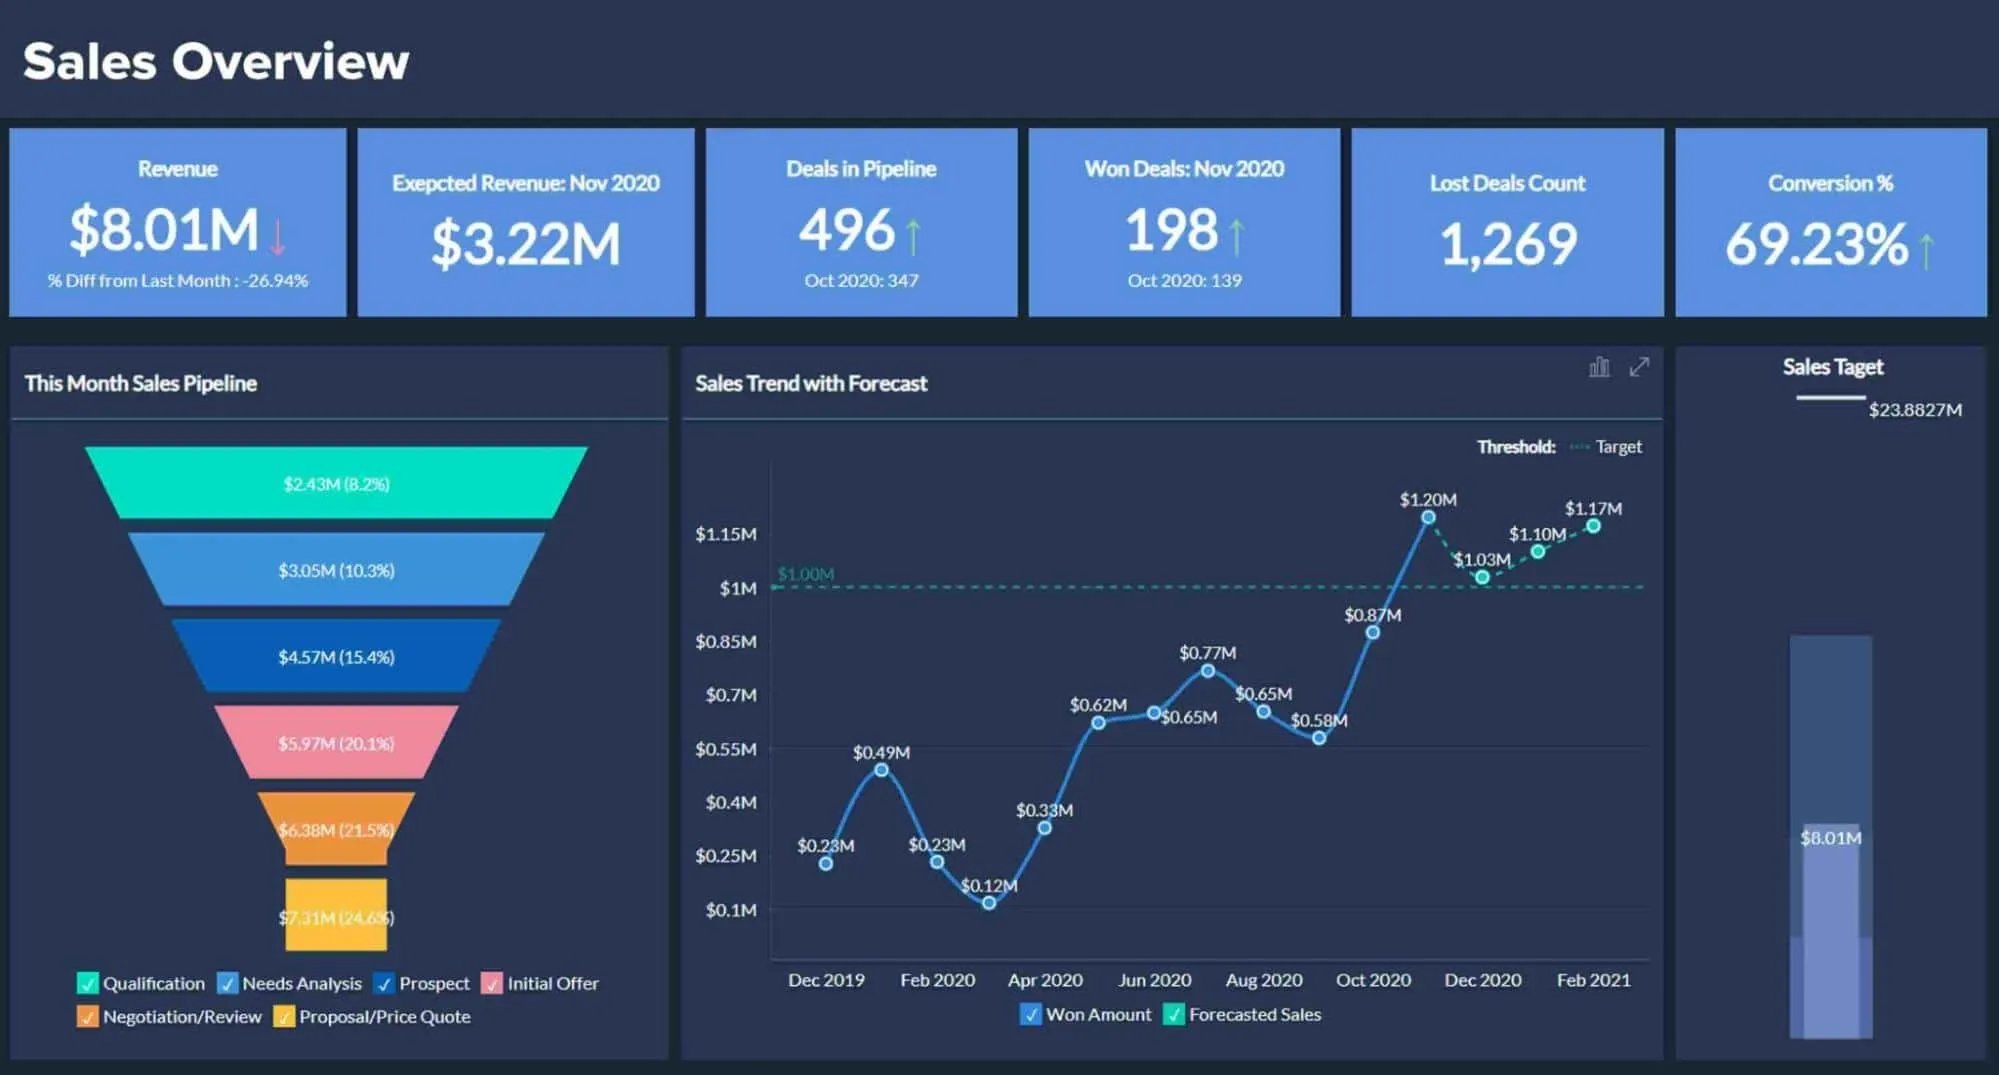
Sales Metrics Dashboard
A sales metrics dashboard provides a visual look at your business's sales data and metrics. They offer a variety of reports and displays for your sales leaders and reps to review, analyze, and act on.
Here’s an example of a dashboard:

CRMs, like HubSpot, come with the ability to create these dashboards within the system. Most provide pre-built dashboards, while others (also like HubSpot) let you build custom reports to track your most important sales metrics.
Learn how to create custom reports with HubSpot's Reporting Dashboard through a free demo.
Let’s review some metrics you’d track on a dashboard.
1. Sales Performance by Rep
Create friendly competition by tracking how each salesperson is performing. Pick your sales metrics based on the behavior you want to promote; for example, if you’re trying to increase your team’s prospecting efforts, you might display the number of total opportunities created in the last month.
To ensure your reps don't chase unqualified leads simply to fill their pipelines, you might also display total sales by rep.
2. Sales Activities
Keep your reps focused on the right tasks with an activities dashboard. Visualize how many days in a row they’ve logged into the CRM. This includes how many calls they made in the past week, how many presentations they gave, how many emails they sent, etc.
3. Sales Management
As a sales manager, you need to know how your team is trending. Track the value of new opportunities compared to the previous month or quarter, the weighted value of your pipeline, total sales versus your target, and/or close rate by the salesperson.
4. Funnel Reports
It is important to know how many contacts have been created, how many have been assigned, and how many are still in the sales funnel so that you can make better decisions for the team and set new goals. It can also help you identify and diagnose friction points in the sales funnel.
If you’re not ready to invest in a CRM that offers a sales metrics dashboard, I recommend using a sales KPI template that you can compile into a spreadsheet.
Sales KPI Template

A sales metrics calculator gives you an easy way to track your sales metrics in a single place.
This KPI calculator is customizable to your business goals. It includes tabs for different KPIs that you can then track monthly, quarterly, or yearly.
You’ll be able to track the following KPIs:
- Average Deal Size: Your company’s total revenue divided by the number of deals closed in a month, quarter, or year.
- Win Rate: The number of deals won versus the number of deals lost.
- Demo-to-Close Ratio: The number of demos that were carried out divided by the number of deals that were won.
- Quota Setting Calculator. On-target earnings (OTE) multiplied by five.
- Commission Calculator: The total amount you’ll pay out in commissions to your sales reps.
- Customer Acquisition Cost (CAC): The amount spent on sales and marketing efforts, divided by the number of customers acquired.
- Customer Lifetime Value (CLV): Average annual revenue per customer divided by the average lifetime of a customer.
- Revenue by Product: Amount of income generated per product.
- Customer Retention Rate: The percentage of customers who stay with your business.
- Revenue Churn: The amount of revenue that’s lost in a month, quarter, or year.
- Employee Turnover Rate: The percentage of sales reps who leave your team.
Track Sales Metrics to Increase Efficiency and Grow Better
It's critical to track sales metrics to ensure that your team is heading in the right direction. Carefully picking which ones to prioritize and then course-correcting (or even completely pivoting) will put you ahead of the game. You can analyze your progress, achieve your sales goals, and positively impact your bottom line.
Editor's note: This post was originally published in September 2019 and has been updated for comprehensiveness.
.webp?width=646&height=226&name=sales-metrics_1%20(1).webp)
Sales Metrics


![Understanding Sales Variance [Formula + Examples]](https://53.fs1.hubspotusercontent-na1.net/hubfs/53/Sales%20Variance.png)